Download presentation
Presentation is loading. Please wait.

1
NWS Precipitation Analysis Product Victor Murphy NWS Southern Region Climate Service Program Mgr. 5 th US Drought Monitor Forum Portland, OR October 11, 2007

2
NWS Southern Region Drought Monitor Forum Overview Data Collection Data Collection Data Mosaic Data Mosaic The Webpage The Webpage Controls Controls Products Products Future Plans Future Plans Current Feedback Current Feedback http://water.weather.gov

3
NWS Southern Region Data Collection – 2 Processes East of the Continental Divide East of the Continental Divide 1. Radar, and Rain Gauges (and satellite) 2. Most effective in areas with good radar coverage and dense gauge network. 3. “MPE” Multisensor Precipitation Estimator West of the Continental Divide West of the Continental Divide 1. Statistical relationship between precip at known stations and normal precipitation 2. Most effective in areas with poor radar coverage.” 3. “Daily QC/Mountain Mapper” http://water.weather.gov
 2. Most effective in areas with good radar coverage and dense gauge network. 3. MPE Multisensor Precipitation Estimator West of the Continental Divide West of the Continental Divide 1. Statistical relationship between precip at known stations and normal precipitation 2. Most effective in areas with poor radar coverage. 3. Daily QC/Mountain Mapper")
4
NWS Southern Region Mosaic Data into One Dataset Each NWS RFC is in unique position to create gridded precipitation estimates as part of the core function of their duties. Each NWS RFC is in unique position to create gridded precipitation estimates as part of the core function of their duties. Hourly Digital Precip (HDP) is computed for each radar within an RFCs area. Hourly Digital Precip (HDP) is computed for each radar within an RFCs area. This is merged with hourly observed rain gauge reports. This is merged with hourly observed rain gauge reports. Bias field created based on the difference between radar value and gauge value. Bias field created based on the difference between radar value and gauge value. Where no gauges exist, bias is computed using triangular grid and distance from nearest gauge site. Where no gauges exist, bias is computed using triangular grid and distance from nearest gauge site. http://water.weather.gov
 is computed for each radar within an RFCs area. Hourly Digital Precip (HDP) is computed for each radar within an RFCs area. This is merged with hourly observed rain gauge reports. This is merged with hourly observed rain gauge reports. Bias field created based on the difference between radar value and gauge value. Bias field created based on the difference between radar value and gauge value. Where no gauges exist, bias is computed using triangular grid and distance from nearest gauge site. Where no gauges exist, bias is computed using triangular grid and distance from nearest gauge site.")
5
NWS Southern Region Drought Monitor Forum Bias field then used to create the final precipitation product. Bias field then used to create the final precipitation product. Hydrologic Rainfall Analysis Project (HRAP) grids are created. Hydrologic Rainfall Analysis Project (HRAP) grids are created. Resolution is 4km x 4km. Resolution is 4km x 4km. Grids available daily for download by customers to create their own value added products. Grids available daily for download by customers to create their own value added products. http://water.weather.gov
 grids are created. Hydrologic Rainfall Analysis Project (HRAP) grids are created. Resolution is 4km x 4km. Resolution is 4km x 4km. Grids available daily for download by customers to create their own value added products. Grids available daily for download by customers to create their own value added products.")
6
NWS Southern Region Drought Monitor Forum Hourly Quality Control Hourly Quality Control Hail Contamination/Bright Banding Hail Contamination/Bright Banding Beam Blockage/AP Beam Blockage/AP Poor Z-R Relationships Poor Z-R Relationships Rain gauge errors Rain gauge errors Hourly gauge data supplemented with Co- Op Network data at 12Z daily. Hourly gauge data supplemented with Co- Op Network data at 12Z daily. Supplemental data (i.e. CoCoRaHS, local alert gauges, etc.) also used. Supplemental data (i.e. CoCoRaHS, local alert gauges, etc.) also used. http://water.weather.gov
 also used. Supplemental data (i.e. CoCoRaHS, local alert gauges, etc.) also used.")
7
NWS Southern Region Drought Monitor Forum Derived Gridded Products Derived Gridded Products Observed Precipitation Observed Precipitation Normal Precipitation (Monthly PRISM data used…and weighted for daily values). Normal Precipitation (Monthly PRISM data used…and weighted for daily values). Departure from Normal. Departure from Normal. Percentage of Normal. Percentage of Normal. http://water.weather.gov
. Departure from Normal. Departure from Normal. Percentage of Normal. Percentage of Normal.")
8
NWS Southern Region Drought Monitor Forum Observed Data Observed Data Expressed as a 24 hour total ending at 1200Z. Expressed as a 24 hour total ending at 1200Z. Usually available at approx 1500Z. Western data usually available at approx 1700Z. Usually available at approx 1500Z. Western data usually available at approx 1700Z. http://water.weather.gov

9
NWS Southern Region Observed Precipitation http://water.weather.gov

10
NWS Southern Region Easy to use Controls http://water.weather.gov

11
NWS Southern Region Regional/State Choices http://water.weather.gov

12
NWS Southern Region Time Interval Selections http://water.weather.gov

13
NWS Southern Region Normal Values Available http://water.weather.gov

14
NWS Southern Region Departure from Normal http://water.weather.gov

15
NWS Southern Region Percent of Normal http://water.weather.gov

16
NWS Southern Region Individual States Selected http://water.weather.gov

17
NWS Southern Region Individual States Selected http://water.weather.gov

18
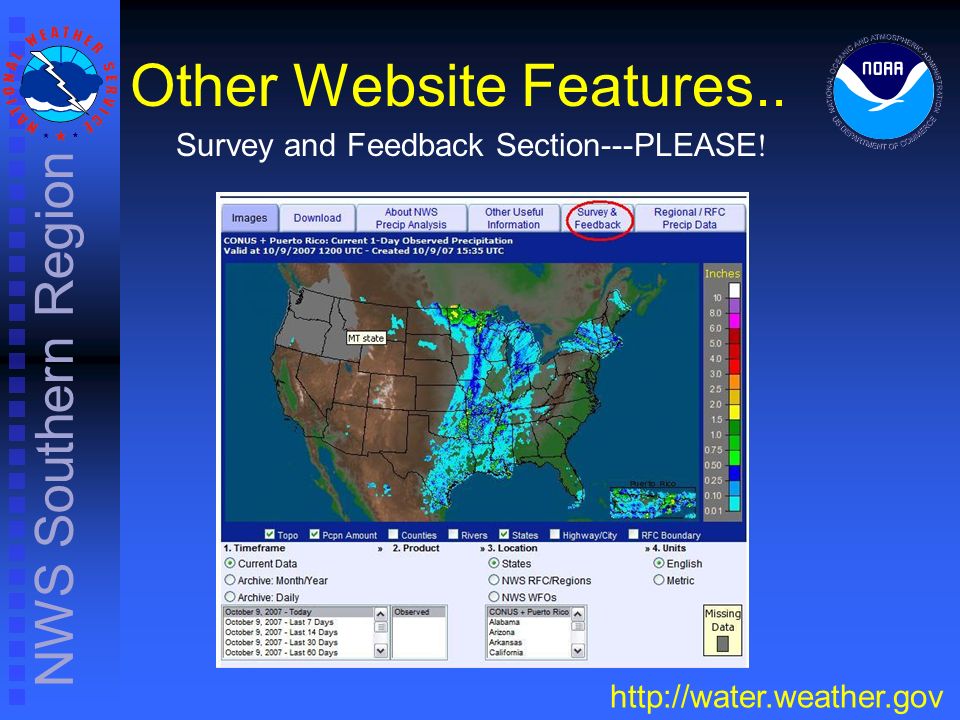
NWS Southern Region Other Website Features.. Survey and Feedback Section---PLEASE ! http://water.weather.gov
19
NWS Southern Region Future Plans Enable dynamically created websites to easily download a graphic of the product that is currently being viewed. Enable dynamically created websites to easily download a graphic of the product that is currently being viewed. Extend archive back to 2001. Extend archive back to 2001. User selectable time intervals. User selectable time intervals. NEW! Product now nationally supported by OH AHPS program with regard to web presentation. NEW! Product now nationally supported by OH AHPS program with regard to web presentation. http://water.weather.gov

20
NWS Southern Region Drought Monitor Forum Questions?? http://water.weather.gov

Similar presentations

>")
 How to Better use SSHP ER Flash Flood Workshop June.>")


 Data, Stream Flow Data, and Rain Gauge Data located in the San Antonio Basin Jayar.>")


 Microwave energy reflects off objects (e.g. hydrometeors) and the return is reflectivity WHAT IS R? Rainfall.>")


 NETWORK.>")


