Download presentation
Presentation is loading. Please wait.

1
CARPE DIEM Centre for Water Resources Research NUID-UCD Contribution to Area-3 Dusseldorf meeting 26th to 28th May 2003

2
AREA-3 WP 9 : Assessment of the bias, spatial pattern and temporal variability of errors in the different sources of areal precipitation estimates. WP 10 Optimal use of radar, NWP and rain gauge data in precipitation forecasts for improving flood forecasts in urban and rural catchments.

3
WP 9 : Assessment of the bias, spatial pattern and temporal variability of errors in the different sources of areal precipitation estimates New/ongoing 1: SMHI New/ongoing 2 : CWRR-NUID

4
Swedish catchment Catchment area: 4295 km 2 MAP: ~700 mm Location of rainfall stations

5
Precipitation estimates Interpolated station observations (PTHBV) –Based on all available stations, corrected for observation losses. –Optimal interpolation. –Frequencies of wind direction and wind speed included in the description of the topographic influence. –Spatial resolution 4x4km 2. Temporal resolution 24 hours. –Period with data 1961-2002. Radar estimates –Spatial resolution 2x2 km 2. Temporal resolution 3 hours. –Evaluation so far only made for accumulated 24 hour precipitation. –Period with data 2000-2002. Hirlam forecasts –Spatial resolution 22x22 km 2. Temporal resolution 6 hours. –Evaluation so far only made for accumulated 24 hour precipitation (6- 30hours). –Period with data 2002.
. –Period with data")
6
Results-1 Comparison of radar and interpolated station data 2000-2002 –Higher spatial resolution and realistic spatial variability for single days in radar data –Technical problems cause non-realistic local spatial gradients in radar data. –Systematic deviations both spatially and temporally - could be explained by technical problems and/or physiographic factors.

7
Results-2 Comparison of HIRLAM forecasts and interpolated station data 2002 –No obvious systematic deviations. –Higher spatial variability in HIRLAM forecasts. –Hirlam tends to generate small rainfall events during dry periods.

8
Investigation of bias - monthly catchment precipitation

9
Investigation of bias - spatial distribution Annual precipitation 2002 Interpolated Radar Hirlam

10
Comparison of daily catchment precipitation 2002

11
Spatial distribution of daily precipitation - examples 2000-07-13 2000-07-19

12
Grid by grid comparison of radar and interpolated data Deviations versus altitude Daily ratios Deviations versus season computed for each grid and then classified by altitude and month respectively. Values from 2002.

13
Time series of daily catchment precipitation and runoff - examples

14
Future work-1 Further analysis of deviations between radar and interpolated station data Runoff simulations with different precipitation estimates –analysis of the effects of the higher temporal and spatial variability of radar data

15
Future work-2 Development of methods for combining radar and point observations in an optimal way –Evaluation of methods for handling the uncertainty in radar data (caused by technical problems)
")
16
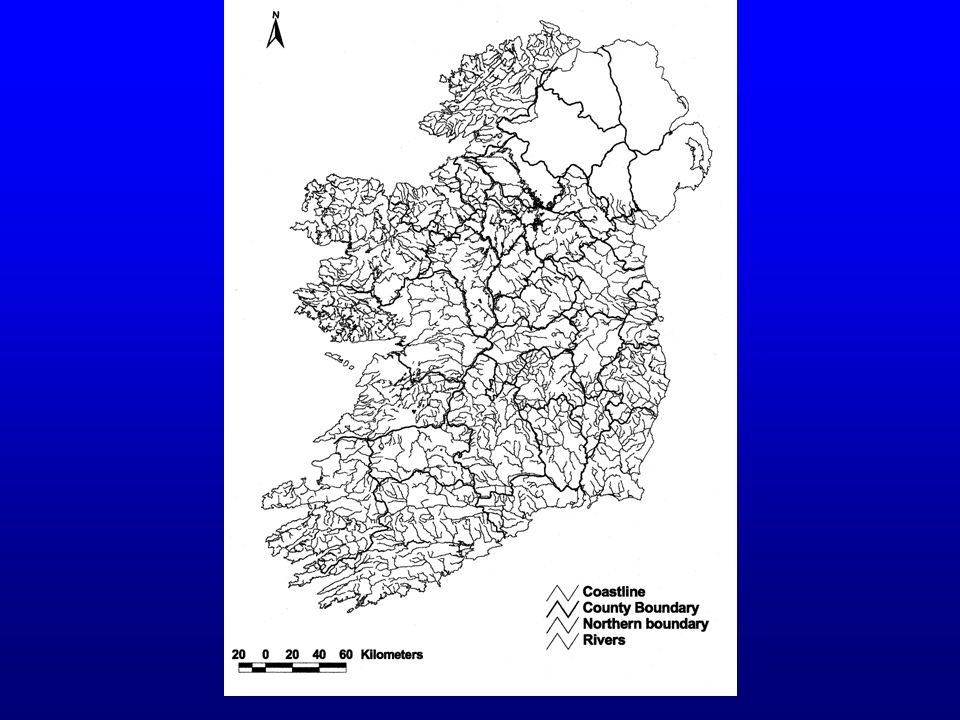
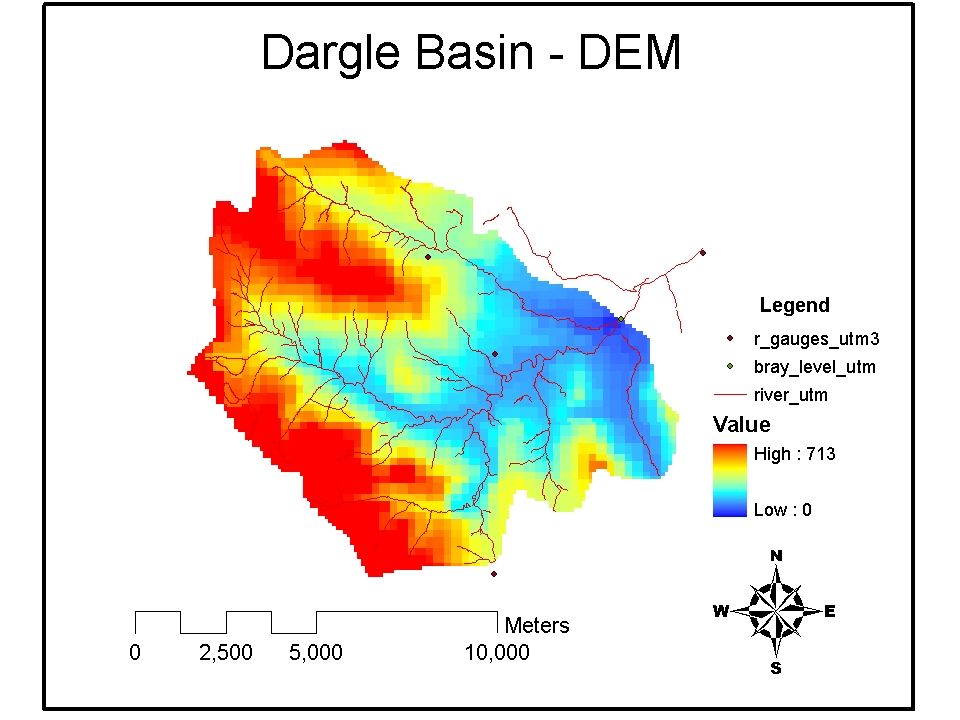
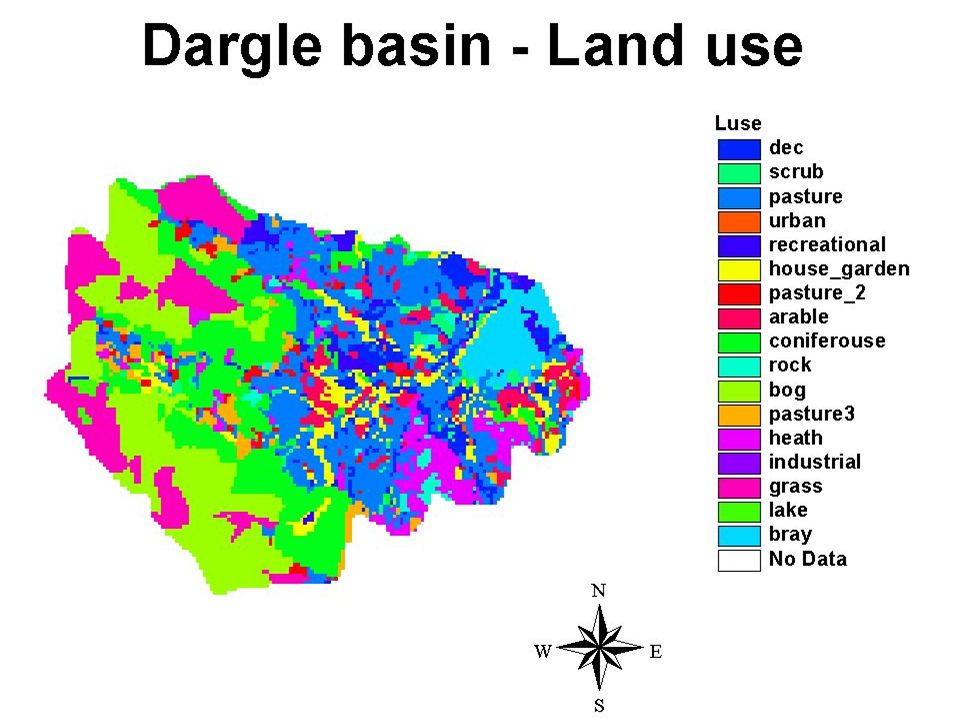
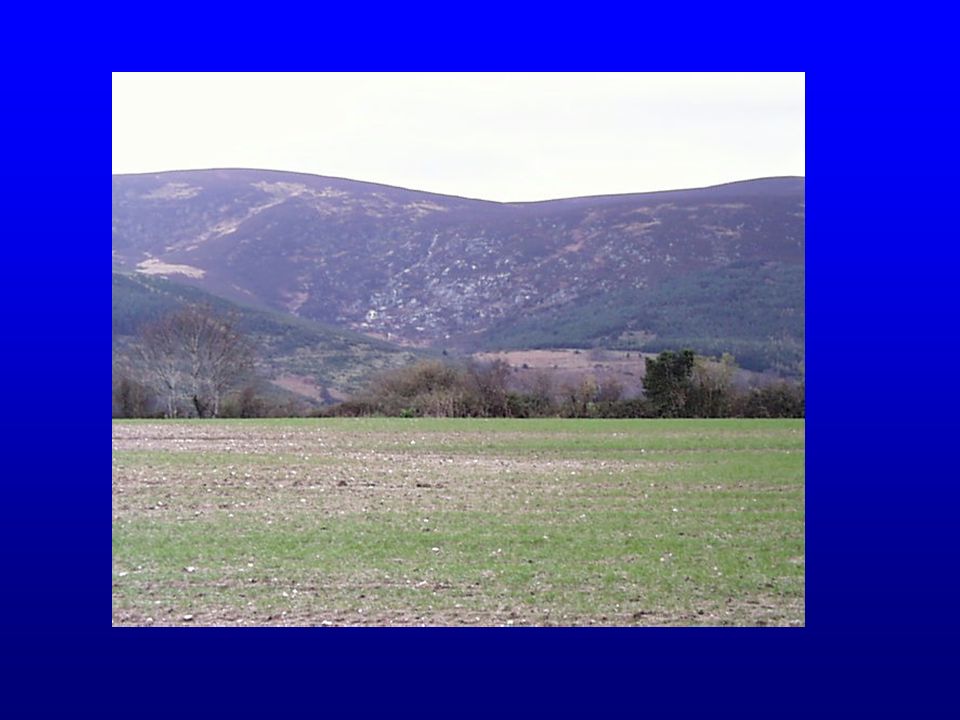
CWRR-NUID Catchment Dargle river catchment (100 km 2 ) East coast of Ireland Mainly rural
 East coast of Ireland Mainly rural")
18
CWRR-NUID Planned Activities Data collection for Case Study (Dargle catchment) Implementation of TOPKAPI Model for Dargle catchment ( together with PROGEA/Prof. Todini) Sensitivity studies
 Sensitivity studies.")
19
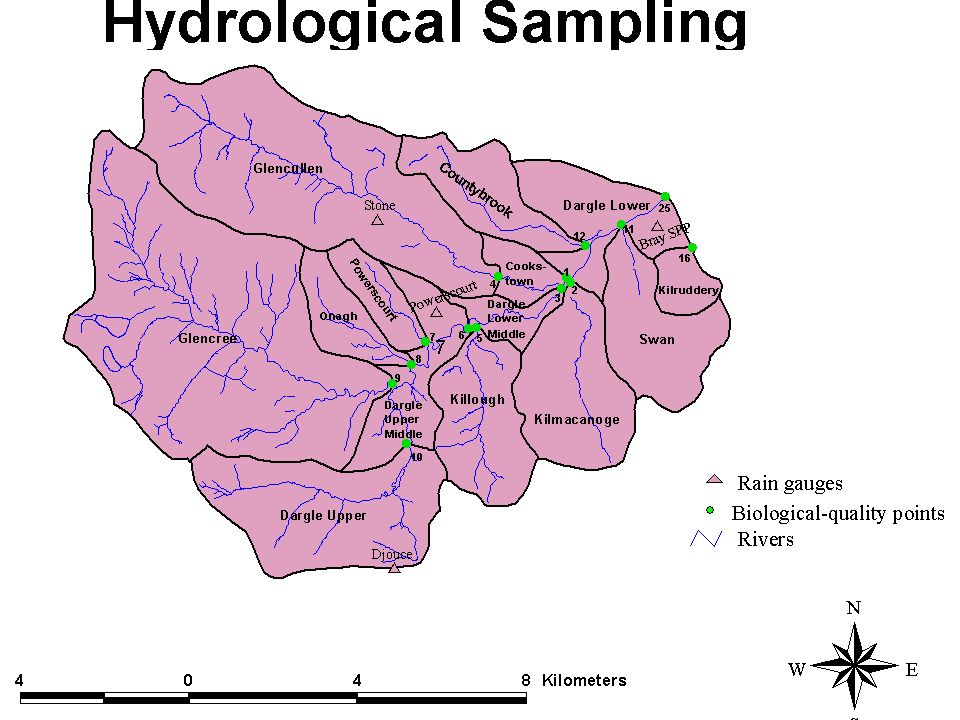
Data Collection Rain gauges (4) in operation, tipping bucket type (tips every 0.2 mm) Water level recorders (11) in operation, Ott Thalimides or Optalimes (1 mm resolution, 5 minute data interval) Archiving radar data from Met Eireann radar at Dublin airport (1 km CAPPI, 15 minute intervals, 1 km resolution)
 in operation, tipping bucket type (tips every 0.2 mm) Water level recorders (11) in operation, Ott Thalimides or Optalimes (1 mm resolution, 5 minute data interval) Archiving radar data from Met Eireann radar at Dublin airport (1 km CAPPI, 15 minute intervals, 1 km resolution)")
20
TOPKAPI Model Structure

28
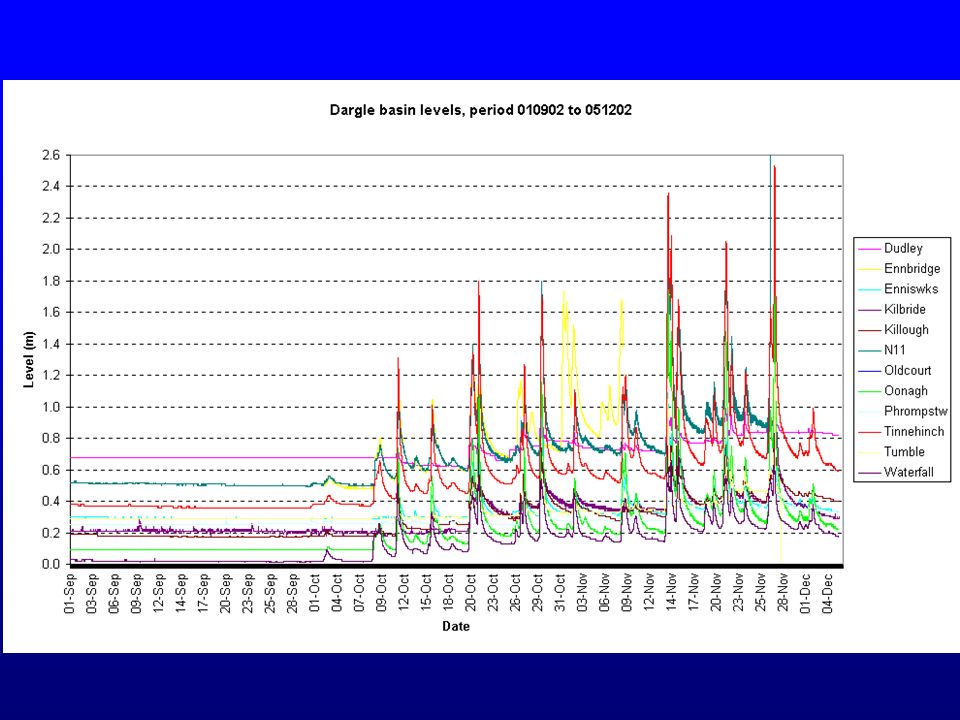
Comments Dry summer Wet winter with many significant storms, at least 10 significant events in period September to December alone. Good possibilities for hydrological model evaluation.

29
Implementing Topkapi: to dos from Colchester To do : Add baseflow component and calibrate model. (completed) To do : Do sensitivity analysis and evaluations (adding data from 2003)
 To do : Do sensitivity analysis and evaluations (adding data from 2003).")
30
Topkapi Calibration- summer/winter 2002

31
Topkapi Calibration- detail

32
Additional work Analysis and integration of archived radar data. (commenced) Inclusion of HIRLAM output. (to be commenced when storms to be analysed are chosen) Refining rating equations for catchment gauges (on-going)
 Inclusion of HIRLAM output. (to be commenced when storms to be analysed are chosen) Refining rating equations for catchment gauges (on-going).")
33
WP 10 Optimal use of radar, NWP and rain gauge data in precipitation forecasts for improving flood forecasts in urban and rural catchments. Commenced January 2003 Builds on results and data from WP9

Similar presentations


 Bruce Macpherson Mesoscale Assimilation, NWP Met Office EWGLAM / COST-717.>")


 meeting – Bologna Critical Assessment of available Radar Precipitation Estimation techniques and Development of Innovative approaches.>")

 Microwave energy reflects off objects (e.g. hydrometeors) and the return is reflectivity WHAT IS R? Rainfall.>")
 Presentation for CARPE DIEM kick-off meeting, DLR-GERMANY, 28-29 January 2002. Contact.>")


 DIAM UNIGE September.>")
