Download presentation
Presentation is loading. Please wait.

1
Comparative Precipitation Analysis and Validation of NEXRAD (Stage III) Data, Stream Flow Data, and Rain Gauge Data located in the San Antonio Basin Jayar S. Griffith

2
http://www.ncdc.noaa.gov Next Generation Weather Radar WSR-88D (NEXRAD) Resolution: 1,2,4 (km) Temporal Resolution: 6-10 min Maximum Reflectivity Range: 143 miles Remote Sensing Radar emits energy Dr. Hongjie Xie 160 Radars

3
returned pulse receiver Z-R Relation Standard Z = 300 R 1.4 Tropical Z = 250 R 1.2 ZR Reflectivity Precipitation Dr. Hongjie Xie

4
NEXRAD Products GRLevelII Software Stage I: Hourly Digital Precipitation (HDP) Stage II: HDP Merges with Rainfall Gages Stage III: Mosaic Stage II cover a RFC area Stage IV: Mosaic Stage III for CONUS Level II: Reflectivity Product Level III: Rainfall Product
 Stage II: HDP Merges with Rainfall Gages Stage III: Mosaic Stage II cover a RFC area Stage IV: Mosaic Stage III for CONUS Level II: Reflectivity Product Level III: Rainfall Product")
5
Real Time NEXRAD DATA on the WEB http://www.rap.ucar.edu/weather/radar

6
NEXRAD 0.5 Base Reflectivity http://www.rap.ucar.edu/weather/radar

7
Area of Study San Antonio Basin Watershed

8
San Antonio Basin Sub-Regions Jayar S. Griffith

9
San Antonio Basin Major River System

10
National Weather Service Rain Gage Network

11
Hourly Rain Gage Data COOP ID Rain Gage Station Data unavailable on Internet No Rain Gage Validation http://nndc.noaa.gov

12
USGS Stream Flow Data Stream Flow Data in Hourly Discharge (cfs) is only available within the past 31 days Data must be downloaded monthly http://waterdata.usgs.gov/nwis/rt
 is only available within the past 31 days Data must be downloaded monthly")
13
Analysis of Stream Flow Data Stream Flow USGS Gage: 08181500 Discharge, cfsHour Discharge, cubic meters USGS 8181 500 10/23/2004 15:15 4.6 320816 USGS 8181 500 10/23/2004 15:30 4.7 723016 USGS 8181 500 10/23/2004 15:45 4.8 824816 USGS 8181 500 10/23/2004 16:00 4.9 826516 951 16 Total269.29 USGS 8181 500 10/23/2004 16:15 5.0 227217 USGS 8181 500 10/23/2004 16:30 5.0 627917 USGS 8181 500 10/23/2004 16:45 5.0 627917 USGS 8181 500 10/23/2004 17:00 5.0 728117 1111 17 Total314.60 USGS Stream Flow Data http://waterdata.usgs.gov/nwis/rt 1) Download Hourly Stream Flow Data 2) Convert Text file to Excel
 Download Hourly Stream Flow Data 2) Convert Text file to Excel")
14
Where to Download NEXRAD Data Monthly-Hourly Rainfall Data Data is compressed multi-tarred files http://dipper.nws.noaa.gov/hdsb/data/nexrad/wgrfc_stageiii.html

15
Data Collection and Analysis Establish NEXRAD Stage III Database Download Rainfall Data from NOAA (Compressed and Multi-tarred Binary file) stage3_102004_WG.tar Uncompress Multi-tarred Binary file by automated data conversion designed by Dr. Hongjie Xie Uncompressed ASCII to GIS Grid – 1.3 Gb Workflow of Data Conversion Dr. Xie Re-projection from Polar-stereographic to Texas Centric NAD83 Albers

16
ASCII files to GIS Grid Files

17
NEXRAD Projected in GIS Re-Define Arcview Shapefiles to equal NEXRAD Projection. GCS_NAD83 to Albers

18
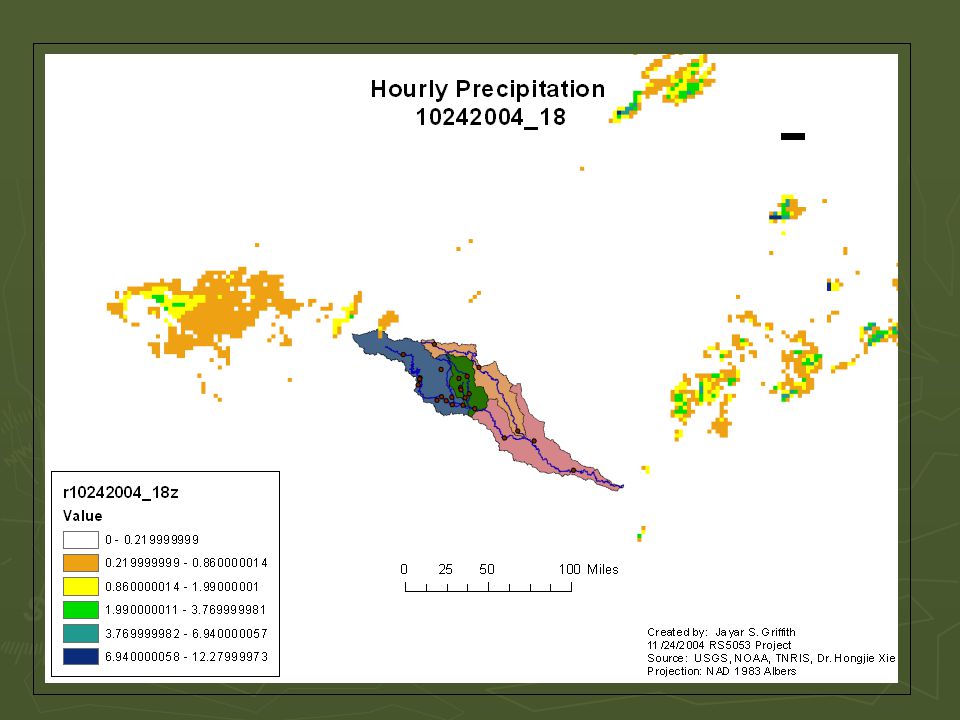
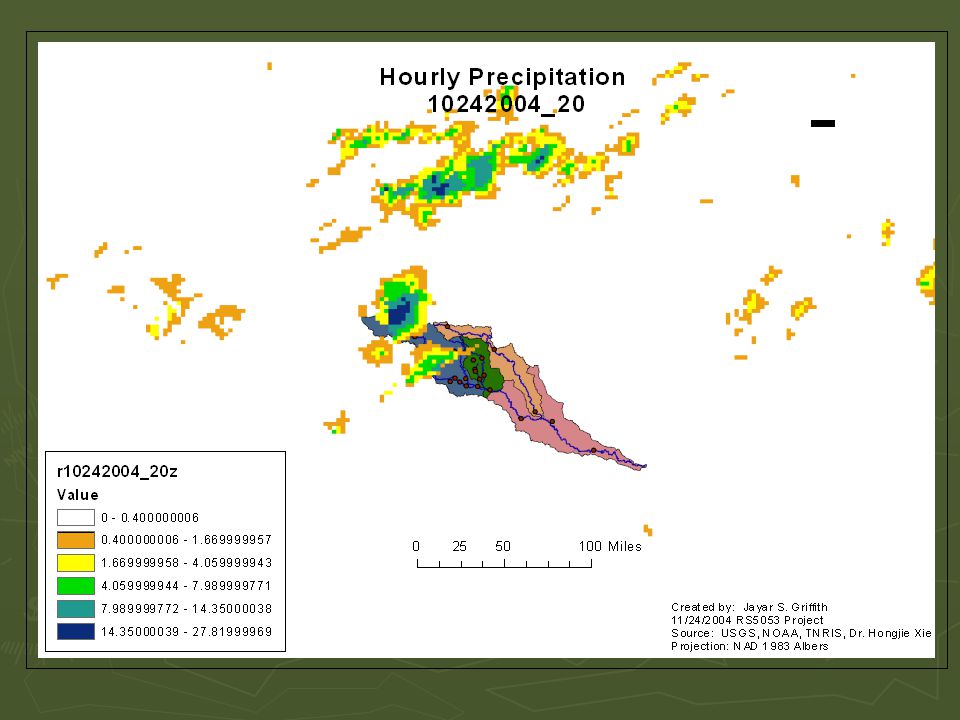
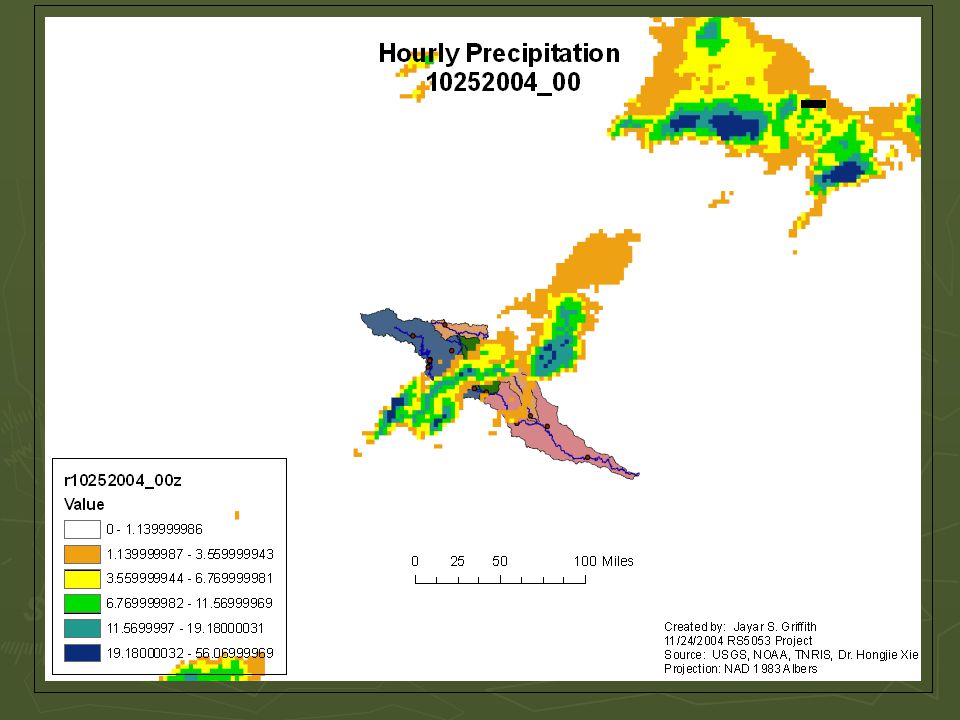
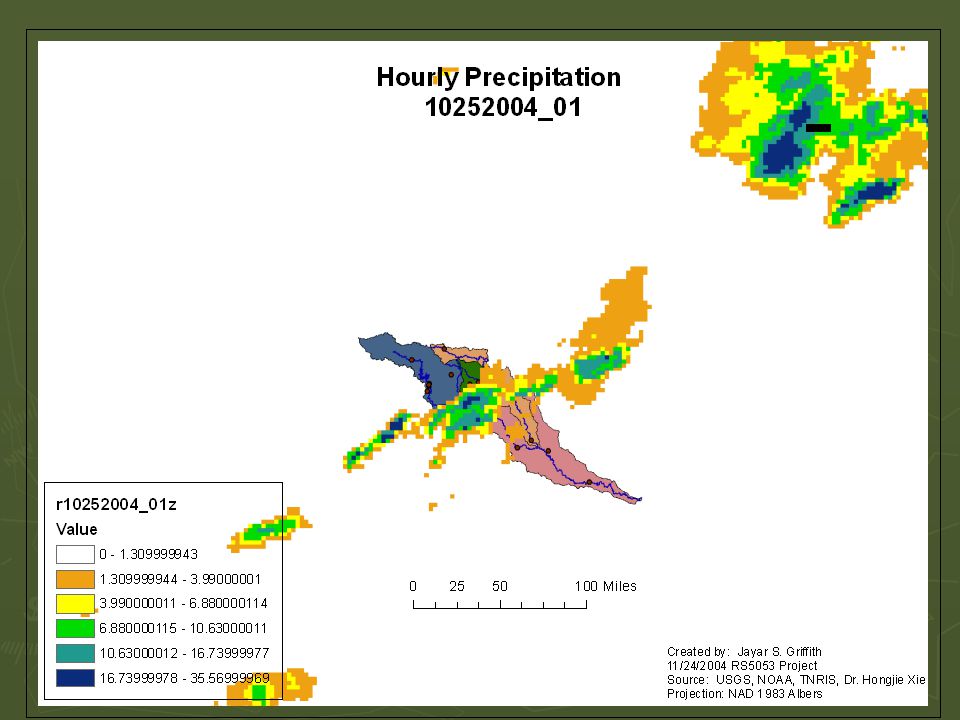
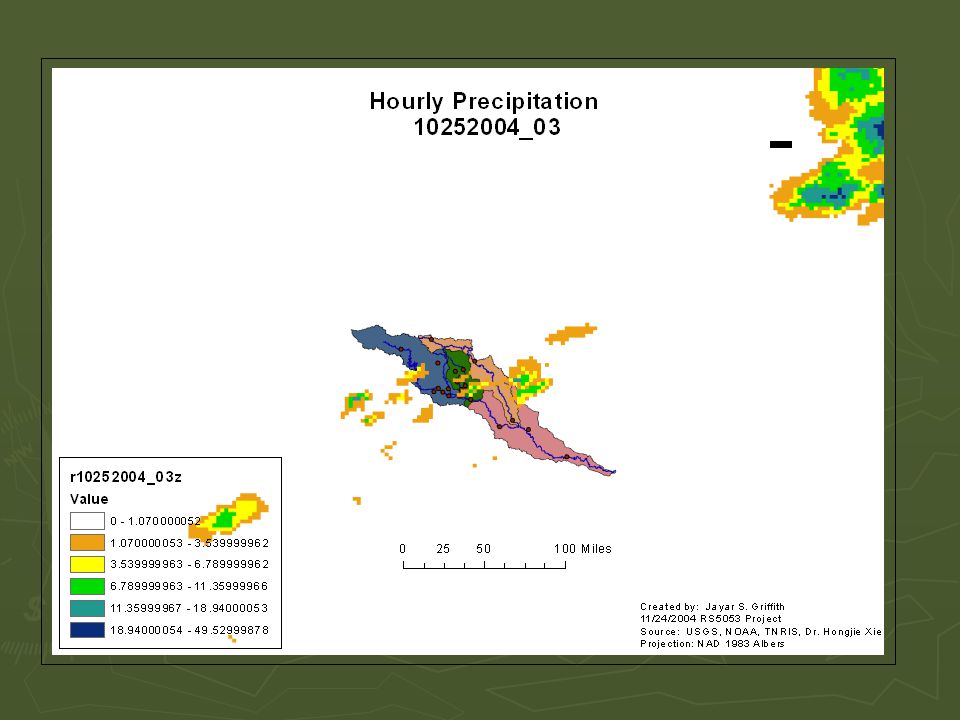
Pixel Value of NEXRAD Data (4km)
")
19
Zonal Statistics GIS Spatial Analyst 2 km Buffer was created for each Sub-Region Zonal Statistic for each Buffer vs Hourly Precip Data

20
Analysis of Rainfall Data and Stream Flow Data Zonal Statistics with "Medina_L2_Buffer" Medina Area = 3.49801 X10^9 sq meters Hourly Precip.Hoursum, mmsum, m Area NEXRAD (volume cubic m) r10242004_16z16003.49801E+090.00E+00 r10242004_17z17003.49801E+090.00E+00 r10242004_18z181.750.001753.49801E+096.12E+06 r10242004_19z1937.120.037123.49801E+091.30E+08 r10242004_20z20618.540.618543.49801E+092.16E+09 r10242004_21z211656.591.656593.49801E+095.79E+09 r10242004_22z221350.611.350613.49801E+094.72E+09 r10242004_23z23834.820.834823.49801E+092.92E+09 r10252004_00z0439.240.439243.49801E+091.54E+09 r10252004_01z1570.250.570253.49801E+091.99E+09 r10252004_02z2333.60.33363.49801E+091.17E+09 r10252004_03z367.330.067333.49801E+092.36E+08 r10252004_04z40.180.000183.49801E+096.30E+05 NEXRAD Rainfall Data (sum x area = cubic meters) Zonal Statistic
 r _16z E E+00 r _17z E E+00 r _18z E E+06 r _19z E E+08 r _20z E E+09 r _21z E E+09 r _22z E E+09 r _23z E E+09 r _00z E E+09 r _01z E E+09 r _02z E E+09 r _03z E E+08 r _04z E E+05 NEXRAD Rainfall Data (sum x area = cubic meters) Zonal Statistic")
33
Analysis of Rainfall Data and Stream Flow Data NEXRAD (volume cubic m) Discharge, cubic m 0.00E+00269.29 0.00E+00314.60 6.12E+06315.73 1.30E+08293.36 2.16E+09293.36 5.79E+09287.42 4.72E+09266.46 2.92E+09253.44 1.54E+09258.82 1.99E+09255.13 1.17E+09250.32 2.36E+08243.81 6.30E+05243.81 Increase in Precipitation = Increase in Stream Flow ? Problem with Stream Flow Data, NEXRAD Data, or Projection ? Need further analysis. Repeat Methods for month of November 1) Preliminary Statistics
 Preliminary Statistics.")
34
Revised NEXRAD vs Stream Flow Central Time Zone to UTC Zonal Statistic vs. Adjusted USGS Hourly Discharge 2) Adjusted Statistics NEXRAD (volume cubic m)discharge, m 0.00E+000 0 6.12E+06173341.7867 1.30E+083676826.928 2.16E+0961267902.16 5.79E+09164089297.4 4.72E+09133781228.9 2.92E+0982690965.95 1.54E+0943507797.95 1.99E+0956484659.37 1.17E+0933043897.18 2.36E+086669201.429 6.30E+0517829.44092
 Adjusted Statistics NEXRAD (volume cubic m)discharge, m 0.00E E E E E E E E E E E E")
35
Results Preliminary Results ► Ground-truthing is needed to validate NEXRAD data ► NEXRAD can be used when stream flow gages and rain gages are not available ► Hourly Rain Gage Data is not free or available through NOAA website ► Hourly Stream Flow Data must be downloaded monthly ► NEXRAD Rainfall Data are large files (> 1 Gb) ► Stream Flow data does not correlate with NEXRAD data ► Method must be repeated for month of November ► Problem with Projection in GIS Albers to Polar-stereographic ► Develop a Geodatabase on a local server Final Results ► Linear Relationship of NEXRAD Stage III data vs Stream Flow data ► USGS Stream Gage hours adjusted to Universal Time Zone ► Relationship shows that Increase Precipitation = Increase in Stream Flow
 ► Stream Flow data does not correlate with NEXRAD data ► Method must be repeated for month of November ► Problem with Projection in GIS Albers to Polar-stereographic ► Develop a Geodatabase on a local server Final Results ► Linear Relationship of NEXRAD Stage III data vs Stream Flow data ► USGS Stream Gage hours adjusted to Universal Time Zone ► Relationship shows that Increase Precipitation = Increase in Stream Flow")
36
Satellite Remote Sensing 715 AM CDT Fri Jul 5, 2002 http://www.srh.noaa.gov/ewx/html/wxevent/2002/jul2002/julfld2002.htm Water Vapor Satellite Photos Cibolo Creek at Selma Guadalupe River at New Braunfels

37
GOES Remote Sensor http://www.goes.noaa.gov

38
Reference ESRI ArcGIS 9 Xie, H., Xiaobing, Z., Vivoni, E.R., Hendrickx, J.M.H, Small, E.E, 2004. GIS-based NEXRAD Stage III precipitation database: automated approaches for data processing and visualization. Xie, H., Xiaobing, Z., Vivoni, E.R., Hendrickx, J.M.H, Guan, H., Tian, Y.Q., Small, E.E. Comparison of NEXRAD Stage III and Gauge Precipitation Estimates in Central New Mexico San Antonio River Authority. Regional Watershed Modeling System Master Plan. Section 5 NOAA Website Available at http://www.srh.noaa.gov/forecasts/TXZ205.php?warncountyhttp://www.srh.noaa.gov/forecasts/TXZ205.php?warncounty= TXC029&city=San+Antonio USGS Water Resource Website Available at http://waterdata.usgs.gov/nwis/rt Weather Underground http://www.wunderground.com/radar/help.asp#base_reflectivity Habib, E. and W.F. Krajewski, 2002. Uncertainty Analysis of the TRMM Ground- Validation Radar-Rainfall Products: Application to the TEFLUN-B Field Campaign. Journal of Applied Meteorology 41:558-572. Grassotti, C., R.N. Hoffman, E.R. Vivoni, and D. Entekhabi, 2003. Multiple Timescale Intercomparison of Two Radar Products and Rain Gauge Observations over the Arkansas-Red River Basin. Weather and Forecasting 18(6):1207-1229
:")
Similar presentations


>")


 NETWORK.>")