Download presentation
Presentation is loading. Please wait.

1
Distribution of bioluminescence in the Mediterranean Sea and predicted effects on a neutrino telescope Jessica Craig, Alan Jamieson, Amy Heger, Alain Zuur & Monty Priede Oceanlab, University of Aberdeen, Scotland, UK www.oceanlab.abdn.ac.uk

2
Bioluminescent sources (BL) Bioluminescent sources (BL) Talk outline Measurement methods Measurement methods BL Distribution in the Mediterranean Sea BL Distribution in the Mediterranean Sea BL Distribution at neutrino telescope sites BL Distribution at neutrino telescope sites Modelling the frequency of BL Modelling the frequency of BL BL around the PMT optical module BL around the PMT optical module
 Bioluminescent sources (BL) Talk outline Measurement methods Measurement methods BL Distribution in the Mediterranean Sea BL Distribution in the Mediterranean Sea BL Distribution at neutrino telescope sites BL Distribution at neutrino telescope sites Modelling the frequency of BL Modelling the frequency of BL BL around the PMT optical module BL around the PMT optical module")
3
Bioluminescent sources BACTERIA - Steady baseline source of light BACTERIA - Steady baseline source of light Mesoplankton – 0.2-20 mm (e.g. copepods) Macroplankton – 20-200 mm (e.g. euphausiids) Megaplankton – 200-2000 mm (e.g. medusae & large colonial organisms (e.g. pyrosomes)) (Dussart et al. 1965, Sieburth et al. 1978) (Dussart et al. 1965, Sieburth et al. 1978) Centred on 480nm Centred on 480nm ANIMALS - Non steady-state flashes ANIMALS - Non steady-state flashes
 Macroplankton – mm (e.g. euphausiids) Megaplankton – mm (e.g. medusae & large colonial organisms (e.g. pyrosomes)) (Dussart et al. 1965, Sieburth et al. 1978) (Dussart et al. 1965, Sieburth et al. 1978) Centred on 480nm Centred on 480nm ANIMALS - Non steady-state flashes ANIMALS - Non steady-state flashes.")
4
Bioluminescent sources Mechanical, chemical and visual stimulation Mechanical, chemical and visual stimulation (Heger 2007) Quantum emission (photons.flash -1 ) Quantum emission (photons.flash -1 )
 Quantum emission (photons.flash -1 ) Quantum emission (photons.flash -1 )")
5
ISIT profiler ISIT profiler ISIT camera – 5 x 10 -6 lux (min faceplate sens.)ISIT camera – 5 x 10 -6 lux (min faceplate sens.) ‘Splat screen’ – 500 x 375 mm‘Splat screen’ – 500 x 375 mm Measurement method AB C D A – Ultra-low-light camera B – Power/control unit C – Lamp D – Splat-screen (Priede et al. 2006, Heger et al. 2008)
.")
6
Mediterranean BL distribution Sampling stations from 4 cruises Sampling stations from 4 cruises ANTARES - Jan 2004 ANTARES - May 2004 RV Meteor 60-1 - October 2006 NESTOR RV Aegeao - May 2007

7
Mediterranean BL distribution Sampling stations from 4 cruises Sampling stations from 4 cruises ANTARES - Jan 2004 ANTARES - May 2004 RV Meteor 60-1 - October 2006 NESTOR RV Aegeao - May 2007

8
Mediterranean BL distribution Sampling stations from 4 cruises Sampling stations from 4 cruises ANTARES - Jan 2004 ANTARES - May 2004 RV Meteor 60-1 - October 2006 NESTOR RV Aegeao - May 2007

9
Mediterranean BL distribution Sampling stations from 4 cruises Sampling stations from 4 cruises ANTARES - Jan 2004 ANTARES - May 2004 RV Meteor 60-1 - October 2006 NESTOR RV Aegeao - May 2007

10
Mediterranean BL distribution Sampling stations from 4 cruises Sampling stations from 4 cruises ANTARES - Jan 2004 ANTARES - May 2004 RV Meteor 60-1 - October 2006 NESTOR RV Aegeao - May 2007

11
Mediterranean BL distribution

17
Depth range500-15001500-25002500-3500>3500 Adriatic2.51 Strait of Sicily1.38 ANTARES1.650.62 Tyrrhenian1.530.40 NW Ionian1.530.21 NESTOR0.300.060.040.02

18
High surface productivity High surface productivity High abundance bioluminescent sources Mediterranean Sea productivity July April January October (Ocean Colour Portal: http://marine.jrc.cec.eu.int) MODIS monthly composites Chlorophyll a (2006)
")
19
Near-bottom BL density decreases with increasing seafloor depth Near-bottom BL density decreases with increasing seafloor depth Near seafloor BL density R 2 = 0.92 At seafloor depth of 3500m Estimate: 0.05 sources.m -3 NEMO site not yet sampled BL density (sources.m -3 ) Seafloor depth (m)
 Seafloor depth (m)")
20
Impacts on detector Modelling BL frequency Impacts on detectorBackground Flash rateFlash Interval Density m -3 min -1 h -1 minmin r =1mmin r = 10m ANTARES 1500-2500m 0.6220.2816.793.572.29 x 10 5 54.5 NESTOR 1500-2500m 0.0680.0311.8432.691.91 x 10 7 4565 NESTOR 2500-3500m 0.0430.0191.1652.684.78 x 10 7 11416 NESTOR >3500m 0.0180.0080.49125.472.73 x10 8 65150 Background Predicted number of bioluminescent flashes in vicinity of OM NEMO 3500m 0.050.021.3145.53.97 x10 7 9498 (Priede et al. submitted; Heger 2007; Buskey & Swift 1990)
.")
21
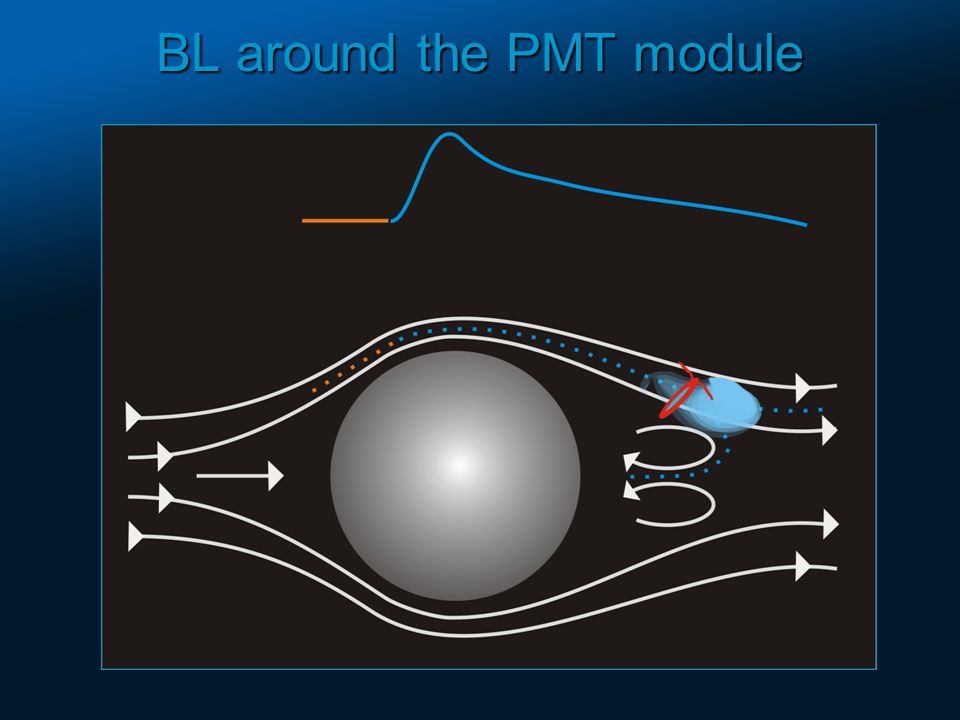
BL around the PMT module

25
(Latz et al. 1987; Bowlby & Case 1991)
")
26
BL around the PMT module (Latz et al. 1987; Bowlby & Case 1991; Bowlby et al. 1990)
")
27
BL around the PMT module

29
Deeper site Low BL density Deeper site Low BL density Summary Low surface productivity Low BL density Low surface productivity Low BL density More detailed info: Priede et al. (submitted) The potential influence of bioluminescence from marine animals on a deep sea underwater neutrino telescope array in the Mediterranean Sea. DSR I.
 The potential influence of bioluminescence from marine animals on a deep sea underwater neutrino telescope array in the Mediterranean Sea. DSR I..")
30
Thanks to: John Carr, the ANTARES collaboration and crew of the GGIX fast catamaran Andre Freiwald, (University of Erlangen) and crew of the FS Meteor (cruise M70 leg-1) Spyros Stavrakakis (HCMR) and crew of the RV Aegaeo UK Natural Environment Research Council Luxembourgish Ministry of Culture Thank you!
 and crew of the FS Meteor (cruise M70 leg-1) Spyros Stavrakakis (HCMR) and crew of the RV Aegaeo UK Natural Environment Research Council Luxembourgish Ministry of Culture Thank you!")
Similar presentations


NOW2004, 11-18 sept. 2004 A km 3 detector in the Mediterranean: status of NEMO Motivation for a km 3 detector.>")

 15 October 2009 Athens, Greece Study of data filtering algorithms.>")


 a km 3 detector in the Mediterranean Sea Lee F. Thompson University of Sheffield, UK Neutrino 2004 Conference, Paris, June 18th 2004.>")


 Experiment Virendra P. Ghate MPO 531.>")