Download presentation
Presentation is loading. Please wait.

1
16 – Measurement of Flows in Piping Systems 1 March 14, 2013 Professor Doran CEE 410

2
Learning goals for today are to improve understanding of: Why and when flow measurement is needed Difference between ‘one-time’ and continuous measurement systems Integration of flow and sampling for composite measurement Simple ‘bucket and stopwatch’ methods Indirect methods Tracer methods End of pipe methods Venturi, Pitot and Orifice methods

3
Learning goals for today are to improve understanding of: Why and when flow measurement is needed Difference between ‘one-time’ and continuous measurement systems Integration of flow and sampling for composite measurement Simple ‘bucket and stopwatch’ methods Indirect methods Tracer methods End of pipe methods Venturi, Pitot and Orifice methods

4
Learning goals for today are to improve understanding of: Why and when flow measurement is needed Difference between ‘one-time’ and continuous measurement systems Integration of flow and sampling for composite measurement Simple ‘bucket and stopwatch’ methods Indirect methods Tracer methods End of pipe methods Venturi, Pitot and Orifice methods

5
Learning goals for today are to improve understanding of: Why and when flow measurement is needed Difference between ‘one-time’ and continuous measurement systems Integration of flow and sampling for composite measurement Simple ‘bucket and stopwatch’ methods Indirect methods Tracer methods End of pipe methods Venturi, Pitot and Orifice methods

6
Learning goals for today are to improve understanding of: Why and when flow measurement is needed Difference between ‘one-time’ and continuous measurement systems Integration of flow and sampling for composite measurement Simple ‘bucket and stopwatch’ methods Indirect methods Tracer methods End of pipe methods Venturi, Pitot and Orifice methods

7
Learning goals for today are to improve understanding of: Why and when flow measurement is needed Difference between ‘one-time’ and continuous measurement systems Integration of flow and sampling for composite measurement Simple ‘bucket and stopwatch’ methods Indirect methods Tracer methods End of pipe methods Venturi, Pitot and Orifice methods

8
Learning goals for today are to improve understanding of: Why and when flow measurement is needed Difference between ‘one-time’ and continuous measurement systems Integration of flow and sampling for composite measurement Simple ‘bucket and stopwatch’ methods Indirect methods Tracer methods End of pipe methods Venturi, Pitot and Orifice methods

9
Q H

10
Account K4573919B Customer 1-235-7893 Bill N0. 854152 Current Charges Due: 03/30/2013 Amount Due: $234.25 Amount Remitted $________________________ Check No._________________

11
Meter signals sampler at programmed volume increment.

12
( Source: US Environmental Protection Agency Values for Specific Communities Vary)
")
13
( Source: US Environmental Protection Agency Values for Specific Communities Vary) Q
 Q")
14
( Source: US Environmental Protection Agency Values for Specific Communities Vary) C
 C")
15
( Source: US Environmental Protection Agency Values for Specific Communities Vary)
")
16
Time IncrementVolume (gal)Volume Sampled (mL) 8:00-8:15 AM52,00052 8:15-8:3061,00061 8:30-8:4565,00065 8:45-9:0060,00060 9:00-9:1551,00051 9:15-9:3045,00045 …..
Volume Sampled (mL) 8:00-8:15 AM52, :15-8:3061, :30-8:4565, :45-9:0060, :00-9:1551, :15-9:3045,00045 …..")
18
City of Parkersburg WV Wastewater Flow and Loadings Summary: Flows: Average10.0 mgd Peak Month12.5 mgd Peak Week13.7 mgd Peak Day15.2 mgd Peak Hour28.9 mgd

19
City of Parkersburg WV Wastewater Flow and Loadings Summary: Biochemical Oxygen Demand (BOD 5 ): Average 14,100 lb/d Peak Month 17,700 lb/d Peak Week 18,800 lb/d Peak Day 28,200 lb/d Peak Hour NA Note – loading information also necessary for TSS, P, N and sometimes other parameters.
: Average 14,100 lb/d Peak Month 17,700 lb/d Peak Week 18,800 lb/d Peak Day 28,200 lb/d Peak Hour NA Note – loading information also necessary for TSS, P, N and sometimes other parameters.")
20
Q A·dh = Q dt Bucket and Stopwatch

21
Example 1 – A 10 ft diameter manhole is used as a pumping station wetwell. Testing of the pump was done at 2 AM during a period of low flow by plugging the inlet sewer and monitoring the level in the wetwell over time while the pump was running. The following data were collected: Time (min)Depth below datum (ft) 0.004.52 0.104.78 0.205.02 0.305.26 0.405.51 0.505.73
Depth below datum (ft)")
22
600 gal/min

23
Error of Measurement: Here we have three variables that are involved in the math (as products) to arrive at a solution: d = diameter of wetwell ∆h = depth measurement ∆t = time measurement
 to arrive at a solution: d = diameter of wetwell ∆h = depth measurement ∆t = time measurement")
25
E d Perhaps the diameter is off by 1-in, then E d = 1/(10*12) = 0.008 E h Perhaps we are off 0.05 ft in 0.80 ft E h = 0.05/0.80 = 0.062 E t Perhaps we are off 2 sec in our time measurement over the 60 sec period, then Et = 2/60 = 0.033
 = E h Perhaps we are off 0.05 ft in 0.80 ft E h = 0.05/0.80 = E t Perhaps we are off 2 sec in our time measurement over the 60 sec period, then Et = 2/60 = 0.033")
26
E Σ = 0.07 = 7.0%

27
Simple Lift Station Flow Logic for daily flow: 1.Runtime meter logs daily runtime (can transmit to central SCADA System) 2.Runtime (minutes) times pumping rate (gpm) = Total Volume (gal) 3.Can program for various conditions of number of pumps running Indirect Method
 2.Runtime (minutes) times pumping rate (gpm) = Total Volume (gal) 3.Can program for various conditions of number of pumps running Indirect Method")
28
Indirect Methods (other examples) Use water meter data as an estimate of wastewater flow volume.
 Use water meter data as an estimate of wastewater flow volume.")
29
Indirect Methods (other examples) Use water meter data as an estimate of wastewater flow volume. Use number of septic hauling vehicles x average hauling vehicle tank volume for total volume of septage to wastewater plant.

30
Indirect Methods (other examples) Use water meter data as an estimate of wastewater flow volume. Use number of septic hauling vehicles x average hauling vehicle tank volume for total volume of septage to wastewater plant. Weigh (before/after unloading) trucked waste to wastewater plant.
 trucked waste to wastewater plant..")
31
Indirect Methods (other examples) Use water meter data as an estimate of wastewater flow volume. Use number of septic hauling vehicles x average hauling vehicle tank volume for total volume of septage to wastewater plant. Weigh (before/after unloading) trucked waste to wastewater plant. Develop gal/ton product based on detailed testing, then base on tons product manufactured.
 trucked waste to wastewater plant. Develop gal/ton product based on detailed testing, then base on tons product manufactured..")
32
Tracer Find Q based on known q, c and C Q? Metering Pump (known q) Stock Tracer (known C)
 Stock Tracer (known C)")
33
Tracer Find Q based on known q, c and C Q? Metering Pump (known q) Stock Tracer (known C) (Q+q)c = q·C Q = q (C/c) - q Sample/Test (known c)
 Stock Tracer (known C) (Q+q)c = q·C Q = q (C/c) - q Sample/Test (known c).")
34
Example 2 – A 10,000 mg/L tracer is metered into a pipeline at 2.00 mL/s. If the tracer concentration in the pipeline is sampled and analyzed to be 1.37 mg/L what is the flowrate in the pipline? Q = q (C/c) – q Q = (2.00 x 10 -3 L)(10,000 mg·L) – 2.00 x 10 -3 L/s s (L·1.37 mg) Q = 14.60 L/s = 14.6 x 10 -3 m 3 /s
 – q Q = (2.00 x L)(10,000 mg·L) – 2.00 x L/s s (L·1.37 mg) Q = L/s = 14.6 x m 3 /s.")
35
Tracers often used for Stream Flow Estimates

36
Example 3 – Badfish Creek (Madison MSD) Q at plant discharge = 37 mgd Cl at plant discharge = 260 mg/L Cl in private wells downstream of Madison = 12.7 mg/L Cl in Badfish at downstream location = 222 mg/L
 Q at plant discharge = 37 mgd Cl at plant discharge = 260 mg/L Cl in private wells downstream of Madison = 12.7 mg/L Cl in Badfish at downstream location = 222 mg/L")
37
Tracers often used for Stream Flow Estimates 37(260) + Q gw (12.7) = (37+Q gw )(222) 9,620 + 12.7 Q gw = 8,214 + 222 Q gw 1,406 = 209 Q gw 6.7 = Q gw Q Downstream = 37 + 7 = 44 mgd
 + Q gw (12.7) = (37+Q gw )(222) 9, Q gw = 8, Q gw 1,406 = 209 Q gw 6.7 = Q gw Q Downstream = = 44 mgd")
38
End of Pipe Methods - Flume Example – 12-in Parshall Flume Equation=cfs, ft Q = 4·H 1.522 Equation= L/s, m Q = 690.9·H 1.52

39
End of Pipe Methods - Weir Rectangular V-Notch Cipolletti Q = C·LH 3/2 Rectangular; Cipolletti Q = C·H 5/2 V-Notch (e.g., 30, 45, 90 degrees) C is function of weir type and unit system
 C is function of weir type and unit system")
40
End of Pipe Methods - Weir Cipolletti

41
End of Pipe Methods - Weir

42
Venturi and Methods Venturi for Flow Measurement P1P1 P2P2 V1V1 V2V2

43
Venturi and Methods Venturi for Flow Measurement z 1 + P 1 /γ + V 1 2 /2g = z 2 + P 2 /γ + V 2 2 /2g

44
Venturi and Methods Venturi for Flow Measurement z 1 + P 1 /γ + V 1 2 /2g = z 2 + P 2 /γ + V 2 2 /2g

45
Venturi and Methods Venturi for Flow Measurement z 1 + P 1 /γ + V 1 2 /2g = z 2 + P 2 /γ + V 2 2 /2g V 2 2 -V 1 2 = h 1 -h 2 2g

46
Venturi Methods Q = A 1 V 1 = A 2 V 2 V 2 2 – (d 1 /d 2 ) 4 V 2 2 = h 1 -h 2 2g
 4 V 2 2 = h 1 -h 2 2g")
47
Venturi Methods Q = A 1 V 1 = A 2 V 2 V 2 2 – (d 2 /d 1 ) 4 V 2 2 = h 1 -h 2 2g (1-β 4 )V 2 2 = 2g(h 1 -h 2 )[β = d 2 /d 1 ]
![Venturi Methods Q = A 1 V 1 = A 2 V 2 V 2 2 – (d 2 /d 1 ) 4 V 2 2 = h 1 -h 2 2g (1-β 4 )V 2 2 = 2g(h 1 -h 2 )[β = d 2 /d 1 ]](http://images.slideplayer.com/38/10788066/slides/slide_47.jpg "Venturi Methods Q = A 1 V 1 = A 2 V 2 V 2 2 – (d 2 /d 1 ) 4 V 2 2 = h 1 -h 2 2g (1-β 4 )V 2 2 = 2g(h 1 -h 2 )[β = d 2 /d 1 ]")
48
Venturi Methods

49
Example 4 – What is the rate of flow for a Venturi flow meter with a throat diameter of 6 in installed in a 12 in diameter line where h 1 -h 2 is 1.50 ft? Assume no losses. V 2 = 10.1 ft/s Q = V 2 A 2 = 10.1 (ft/s)(π)(0.25) 2 ft 2 = 1.98 ft 3 /s
(π)(0.25) 2 ft 2 = 1.98 ft 3 /s.")
50
Example 4 – What is the rate of flow for a Venturi flow meter with a throat diameter of 6 in installed in a 12 in diameter line where h 1 -h 2 is 1.50 ft? Assume no losses. Q = V 2 A 2 = 10.1 (ft/s)(π)(0.25) 2 ft 2 = 1.98 ft 3 /s The above assumes no losses. Venturis will have a C d of 0.95-0.98 typically depending upon size, material and V 2. Q Actual = C d Q Theoretical = 0.95(1.98) ft 3 /s = 1.88 ft 3 /s
(π)(0.25) 2 ft 2 = 1.98 ft 3 /s The above assumes no losses. Venturis will have a C d of typically depending upon size, material and V 2. Q Actual = C d Q Theoretical = 0.95(1.98) ft 3 /s = 1.88 ft 3 /s.")
51
Pitot Tube A Stagnation Pressure Static Pressure

52
Pitot Tube A Stagnation Pressure Static Pressure Stagnation Pressure = V 2 /2g + P/γ = h 2 Static Pressure = P/γ = h 1

53
Pitot Tube A Stagnation Pressure Static Pressure Stagnation Pressure = V 2 /2g + P/γ = h 2 Static Pressure = P/γ = h 1

54
Pitot Tube V 2 /2g = h 2 -h 1

55
Pitot Tube Example 5 – What is the flow rate in a 300 mm pipe where ∆h = 1.75 m?

56
Pitot Tube

57
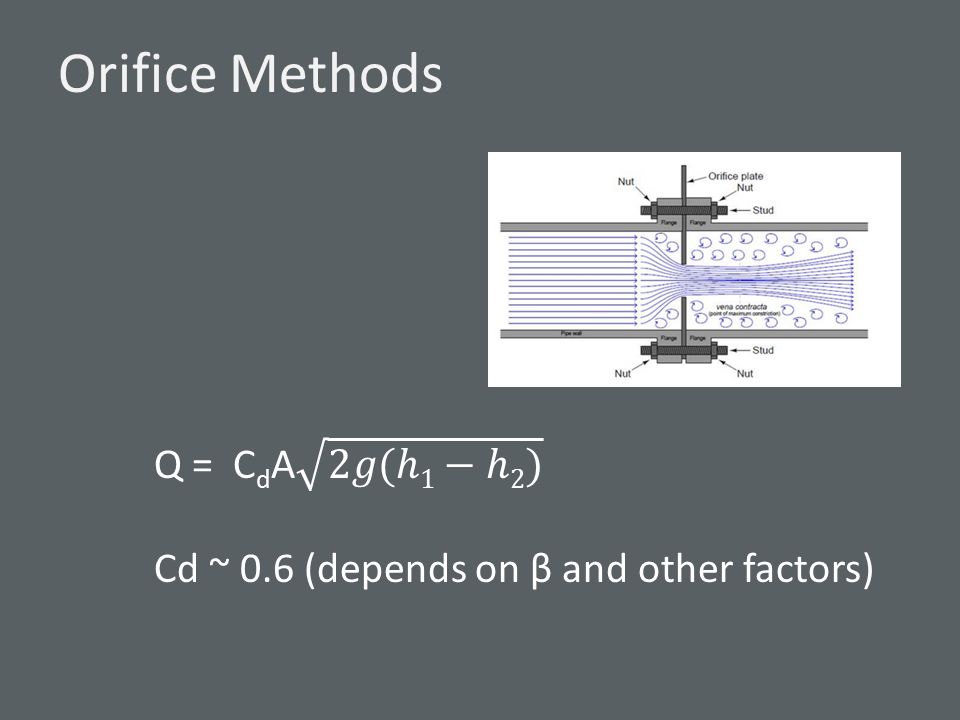
Orifice Methods

59
Example 5 – Repeat Example 4 for a sharp edged orifice rather than the venturi.

60
Orifice Methods Example 5 – Repeat Example 4 for a sharp edged orifice rather than the venturi. From handbook, C d = 0.62 Q = 0.62π(0.25) 2 (64.4·1.5) 0.5 = 1.20 ft 3 /s
 2 (64.4·1.5) 0.5 = 1.20 ft 3 /s.")
61
Venturis, Orifices and Similar Methods in Practice ∆P reading to SCADA SCADA programmed to record and totalize flow

62
Learning goals for today are to improve understanding of: Why and when flow measurement is needed Difference between ‘one-time’ and continuous measurement systems Integration of flow and sampling for composite measurement Simple ‘bucket and stopwatch’ methods Indirect methods Tracer methods End of pipe methods Venturi, Pitot and Orifice methods

Similar presentations


. Sewer Basics Collection and transport of wastewater from each home/building to the point where treatment occurs.>")

 Math for Water Technology MTH 082 (pg. 468) “Required by Law”>")


