Download presentation
Presentation is loading. Please wait.

1
Quantitative Chemical Analysis Seventh Edition Quantitative Chemical Analysis Seventh Edition Chapter 4 Statistics Copyright © 2007 by W. H. Freeman and Company Daniel C. Harris

2
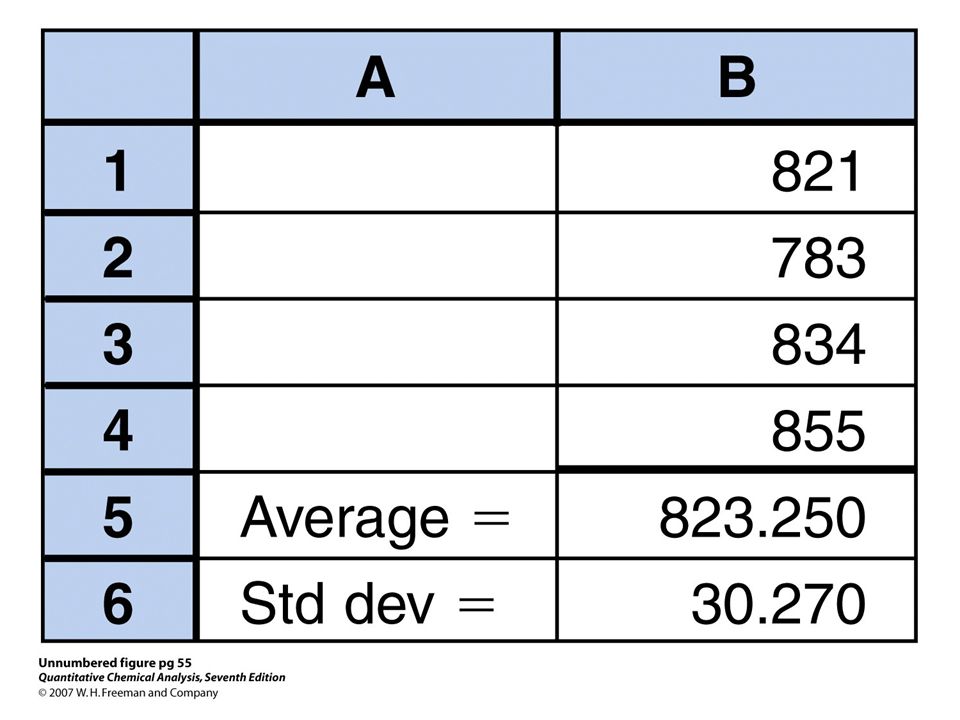
mean Standard deviation

6
A Gaussian curve in which μ = 0 and σ = 1. A Gaussian curve whose area is unity is called a normal error curve. In this case, the abscissa, x, is equal to z, defined as z = (x − μ)/σ.
/σ..")
9
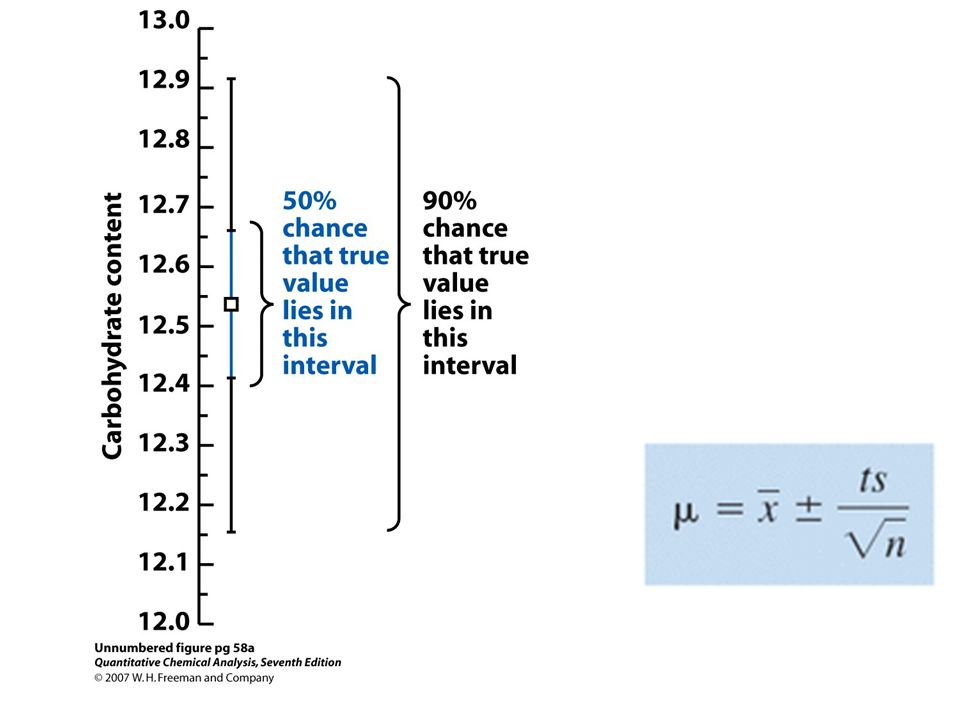
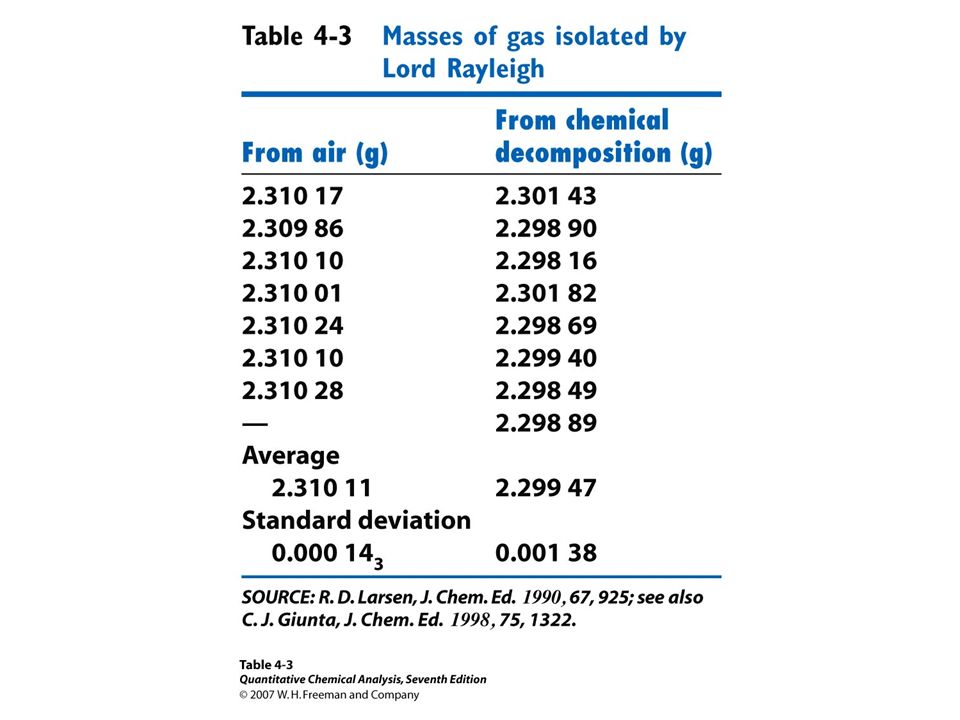
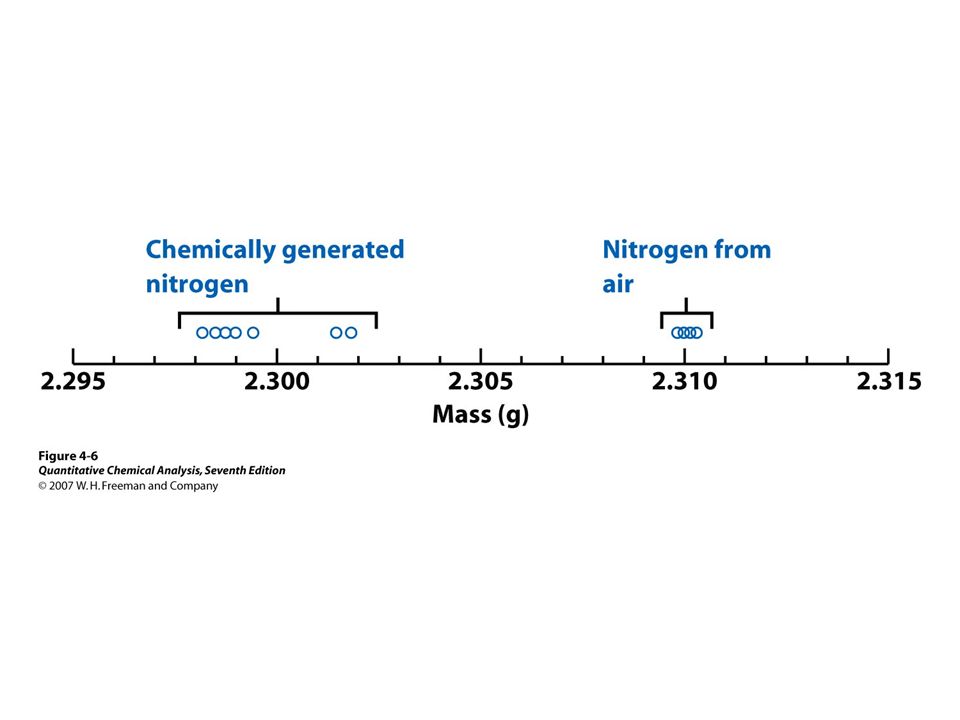
HOW CLOSE IS YOUR MEASURED AVERAGE TO THE REAL VALUE?

14
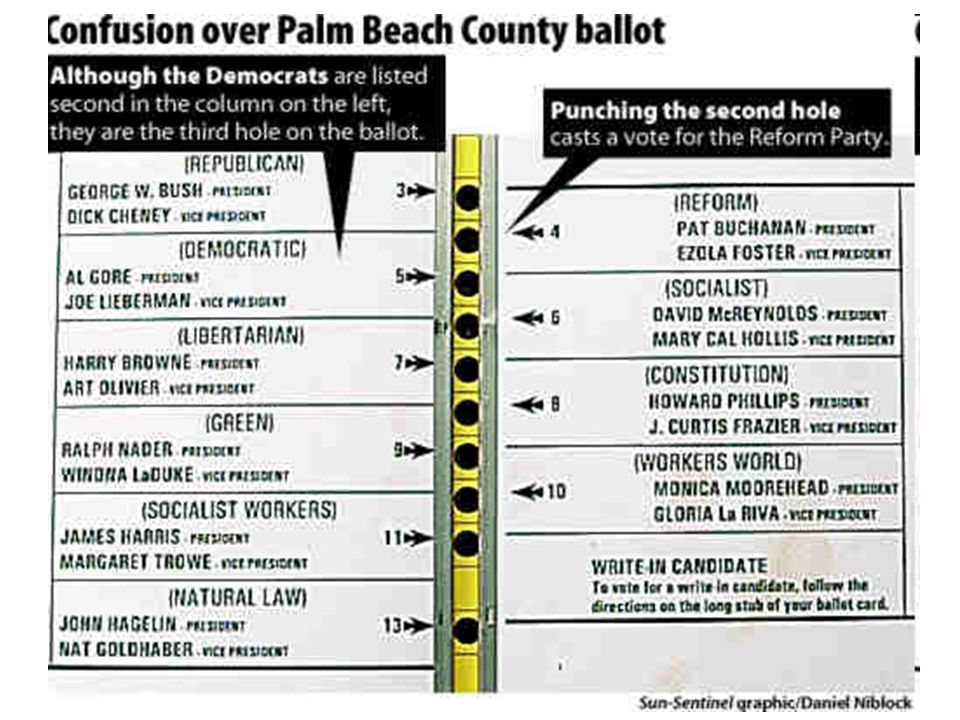
Federal official vote for the state of Florida (25 electoral votes) Presidential CandidateVote Total%Party George W. BushGeorge W. Bush (W)2,912,79048.847Republican Al Gore2,912,25348.838Democratic Ralph Nader97,4211.634Green Patrick J. Buchanan17,4840.293Reform Harry Browne16,4150.275Libertarian John Hagelin2,2810.038Natural LawNatural Law/ReformReform Howard Phillips1,3780.023Constitution Other3,0280.051— Total5,963,110 Source: 2000 OFFICIAL PRESIDENTIAL GENERAL ELECTION RESULTS2000 OFFICIAL PRESIDENTIAL GENERAL ELECTION RESULTS
2,912, Republican Al Gore2,912, Democratic Ralph Nader97, Green Patrick J. Buchanan17, Reform Harry Browne16, Libertarian John Hagelin2, Natural LawNatural Law/ReformReform Howard Phillips1, Constitution Other3, — Total5,963,110 Source: 2000 OFFICIAL PRESIDENTIAL GENERAL ELECTION RESULTS2000 OFFICIAL PRESIDENTIAL GENERAL ELECTION RESULTS.")
16
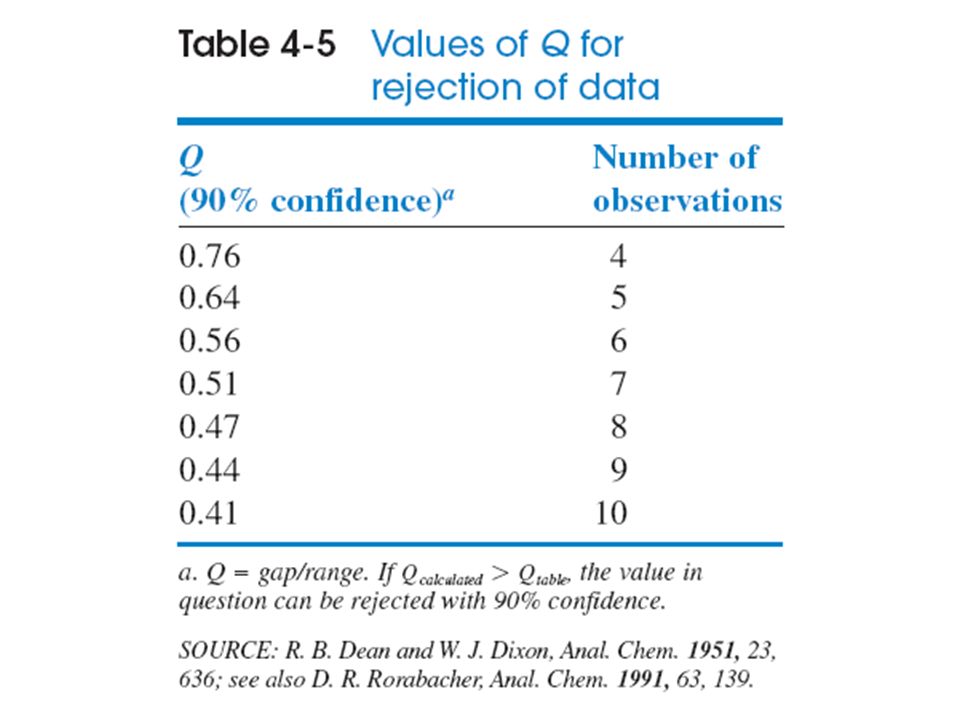
CAN YOU THROW OUT OUTLAYERS?

19
0.11/0.2 = 0.55 For 5 measurements Q = 0.65 So…….. KEEP!

20
WHAT LINE CAN YOU DRAW THROUGH THE POINTS??

21
WHAT LINE CAN YOU DRAW THROUGH THE POINTS??

24
calibration (-blanks)
")
25
Standard addition

28
Internal standard

29
Standard addition calibration (-blanks)
")
Similar presentations