Download presentation
Presentation is loading. Please wait.

1
Chapter 6: Random Errors in Chemical Analysis CHE 321: Quantitative Chemical Analysis Dr. Jerome Williams, Ph.D. Saint Leo University

2
Overview Nature of Random Errors Statistical Treatment of Random Error – Populations – Standard Deviation

3
Nature of Random Errors Random (Indeterminate) errors exist in measurement; they can never be totally eliminated since many sources of small individual random errors can not be identified. The accumulation of these small random errors gives rise to a Gaussian distribution (also called a normal error curve).
..")
4
Figure 6-2c p95

5
Statistical Treatment of Random Errors Mean = Average Median = Middle Value Spread = the difference between the highest and lowest values in a data set – In Excel, one uses the MAX() and MIN() functions to find high and low values.
 and MIN() functions to find high and low values.")
6
Table 6-2 p96

7
Table 6-3 p96

8
Statistical Treatment of Random Errors Frequency distribution data often presented as a bar graph (histogram) or as a Gaussian curve. Gaussian curve shows the symmetrical distribution of data around the mean of an infinite set of data.

9
Figure 6-3 p97

10
Statistical Treatment of Random Errors Example Study: Coin Flipping Measure = How many heads will occur in ten (10) flips? Collect Data = compare results with data in Feature 6.1 and plot distribution – As number of trials increases, the mean approaches five (5) as expected based on laws of probability.
 as expected based on laws of probability..")
11
Figure 6-1 p98

12
Statistical Treatment of Random Errors Statistical analysis reveals only information that is already present in a data set, no new information is created by statistical treatments. In scientific studies we infer information about a population (universe) from observations made on a sample (subset of universe).
 from observations made on a sample (subset of universe)..")
13
Statistical Treatment of Random Errors A population is the collection of all measurements of interest to the experimenter, while a sample is a subset of measurements selected from the population. Distinction is important because one refers to the following parameters. – Population mean vs. Sample Mean – Population standard deviation vs. Sample standard deviation – Variance (square of standard deviation)
.")
14
Statistical Treatment of Random Errors Sample mean and population means are calculated using the same equation (sum of data in set / N); one uses the Greek letter μ to denote population mean (true mean for population). Sample mean approaches population mean when data sets become large (typically when N > 20 or 30)
.")
15
Statistical Treatment of Random Errors Population standard deviation (denoted by the Greek letter σ ) is a measure of the precision of a population of data and is calculated using the following equation. σ = SQRT (SUM (x i – μ) 2 / N) The population variance is equal to σ 2.
 2 / N) The population variance is equal to σ 2..")
16
Figure 6-4 p99

17
Statistical Treatment of Random Errors Sample standard deviation (denoted by the letter s) is a measure of the precision of a sample data set and is calculated using the following equation. s = SQRT (SUM (x i – mean) 2 / N-1) The sample variance is equal to s 2.
 2 / N-1) The sample variance is equal to s 2..")
18
Figure 6-4b p99

19
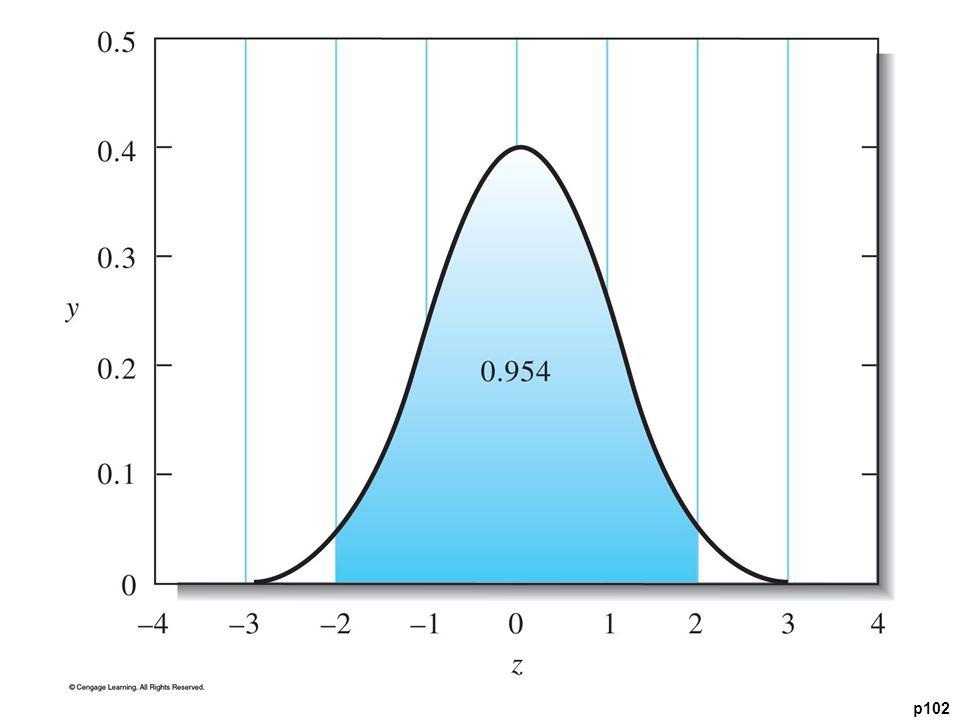
p102

21
p103

22
p108

Similar presentations


 has infinitely many possible outcomes Probability is conveyed for a range of.>")


