Download presentation
Presentation is loading. Please wait.

1
www.sdu.nhs.uk Head in the sand or Line in the sand: measuring progress of the public sector into a low carbon world David Pencheon NHS Sustainable Development Unit, England Cambridge Statistics Discussion Group Wednesday, 23 rd February, 2011

2
www.sdu.nhs.uk
3
Global addiction to oil: very cheap, very useful and very dangerous In the last 150 years we have been releasing 350 million years-worth of carbon locked away in fossil fuels 150 years First Oil Well 100 years 4000 cars in USA NOW 600,000,000 cars 4,000,000,000 passenger flights p.a. 50 years First commercial jet ticket

4
www.sdu.nhs.uk
5
Although climate change can cause illness and death directly...

6
www.sdu.nhs.uk …there are MUCH greater health risks through:

7
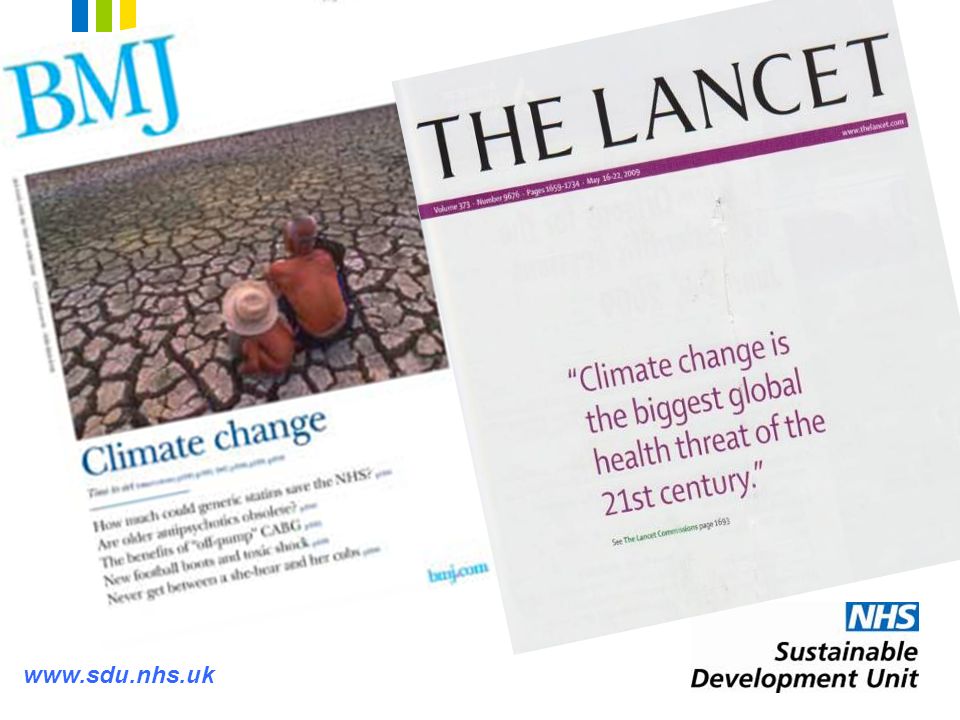
www.sdu.nhs.uk The world map reflecting production related to climate change. “Climate Change presents the biggest threat to health in the 21 st Century” The Lancet (373;9697 pp 1659- 1734, May 16-22 2009). Who produces the greenhouse gases?
. Who produces the greenhouse gases .")
8
www.sdu.nhs.uk Who bears the burden? The world map reflecting mortality related to climate change. “Climate Change presents the biggest threat to health in the 21 st Century” The Lancet (373;9697 pp 1659- 1734, May 16-22 2009).
..")
9
www.sdu.nhs.uk CO2e emissions, by country, for the year 2000. Each rectangle’s area shows the greenhouse gas emissions for that country. The width is the population (in billions) of the country; the height is the greenhouse gas pollution (tons CO2e/year per person) for that country.
 of the country; the height is the greenhouse gas pollution (tons CO2e/year per person) for that country..")
10
www.sdu.nhs.uk Global footprint over the period 1880–2004: by country, by continent (colour), per capita (vertical axis), by population (horizontal axis), and absolute amount (area of rectangle)
, per capita (vertical axis), by population (horizontal axis), and absolute amount (area of rectangle)")
11
www.sdu.nhs.uk The time is now At least 30,000 people died prematurely as a result of Europe’s heat wave in 2003 in France 1 1. Unprecedented heat-related deaths during the 2003 heat wave in Paris: consequences on emergency departments Jean-François Dhainaut, Yann - Erick Claessens, Christine Ginsburg, and Bruno Riou. Crit Care. 2004; 8(1): 1–2. Published online 2003 December 4. doi: 10.1186/cc2404. and Bhattacharya, S. (October 2003), ‘European heat wave caused 35,000 deaths’, The New Scientist. http://www.newscientist.com/article/dn4259
: 1–2. Published online 2003 December 4. doi: /cc2404. and Bhattacharya, S. (October 2003), ‘European heat wave caused 35,000 deaths’, The New Scientist.")
12
www.sdu.nhs.uk NHS England CO 2 e footprint 1990 – 2020 with Climate Change Act targets

13
www.sdu.nhs.uk Carbon Footprint - NHS England

14
www.sdu.nhs.uk Procurement Breakdown

15
www.sdu.nhs.uk Carbon Intensity of the NHS

16
www.sdu.nhs.uk Policy wedges

17
www.sdu.nhs.uk NHS MAC curve

18
www.sdu.nhs.uk Energy: Measuring, monitoring, displaying

19
www.sdu.nhs.uk Travel: Better access to health care, not more vehicles: Default place for health care is the home / local community Every unplanned admission is a sign of system failure until proven otherwise An infrastructure for a nationwide sustainable transport system

20
www.sdu.nhs.uk

22
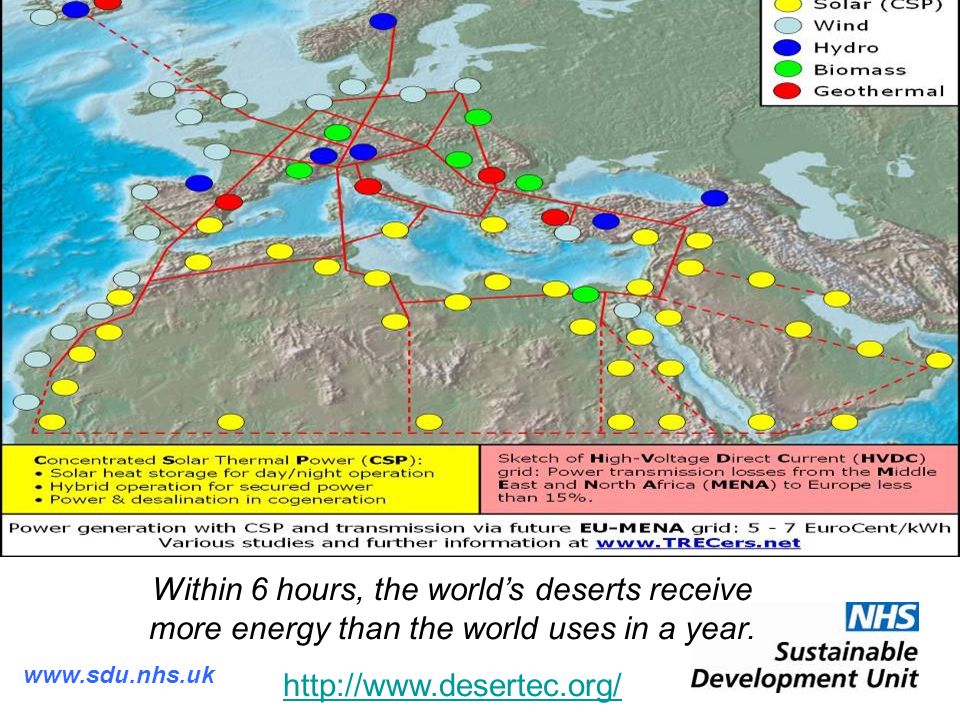
Within 6 hours, the world’s deserts receive more energy than the world uses in a year. http://www.desertec.org/
23
www.sdu.nhs.uk
Similar presentations


 Source: Statistics Canada.>")


