Download presentation
Presentation is loading. Please wait.

1
Motion Graphs (p. 93-94 in notebook)
")
2
Interpret The Graph Below: (As time increases, ….)
")
3
Interpret The Graph Below: The graph shows an object which is not moving (at rest). The distance stays the same as time goes by because it is not moving.

4
Interpret The Graph Below:

5
The graph shows that the objects distance increases as time passes. The object is moving and so it has velocity. The straight line shows it is a constant (not changing).
..")
6
Interpret The Graph Below:

7
Just like the previous graph, this graph shows an object moving with constant velocity The object moves backwards

8
Interpret The Graph Below:

9
The curve in the graph shows that the objects velocity is increasing as time passes. This is acceleration.

10
Interpret The Graph Below:

11
In the first part of the graph the object is moving with constant velocity. In the second part of the graph the object is at rest (not moving). In the third part the object is again moving with constant velocity, backwards.
. In the third part the object is again moving with constant velocity, backwards..")
14
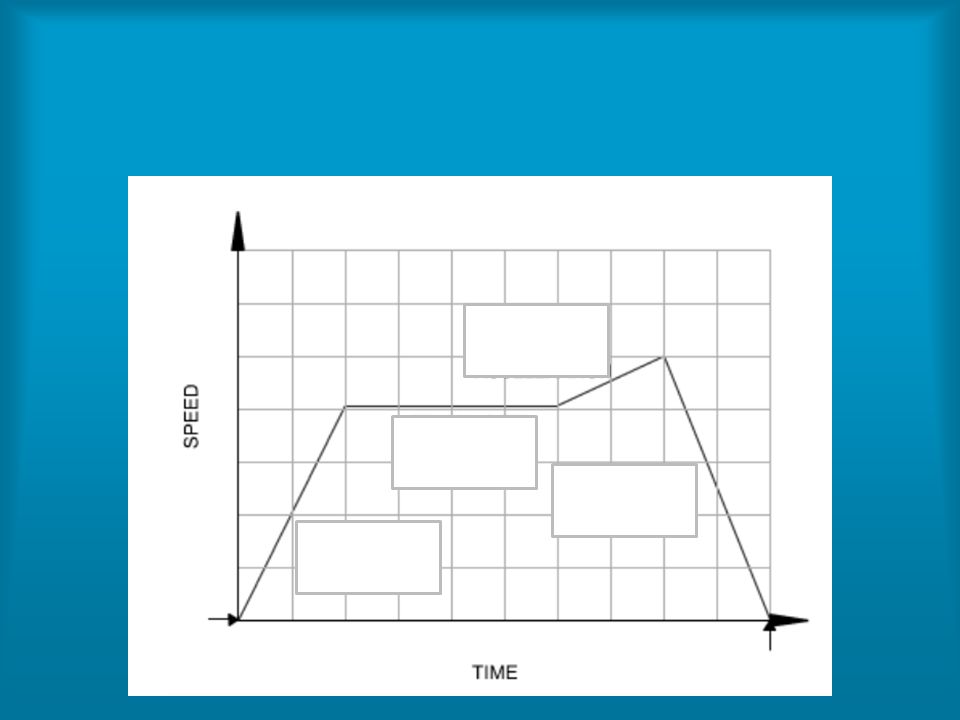
Velocity vs. Time Graph AKA Speed vs. Time Graph Speed (m/s) SAME
 SAME")
15
Interpret The Graph Below:

16
The graph shows that the objects velocity does not change as time passes. It shows constant velocity.

17
Interpret The Graph Below:

18
The graph shows that the object’s velocity is increasing as time passes – it is positive acceleration. The straight line shows that it is constant acceleration.

21
Now make a tree map: Graphing Velocity and Acceleration Distance vs. Time Graph Velocity vs. Time Graph __________________

22
Distance vs. Time Summary Flat, horizontal line means: Up and to the right means: STOPPED; no Motion Moving forward steadily

23
Distance vs. Time Summary Down and to the right means: Curved line means: Returning to the start Increasing speed: Going faster

24
Velocity (Speed) vs. Time Summary Flat, horizontal line means: Up and to the right means: CONSTANT speed; going the Same speed during that time Steadily acclerating

25
Velocity (Speed) vs. Time Summary Down and to the right means: Curved line means: Steadily negatively Accelerating [decelerating] Increasing/changing acceleration

26
BOTH graphs: *The steeper the slope, the faster the speed! Faster because It is closer to being vertical! Slower because It is closer to being horizontal!

Similar presentations


. The distance stays the same as time goes by because.>")


/ TIME GRAPHS>")


