Download presentation
Presentation is loading. Please wait.

1
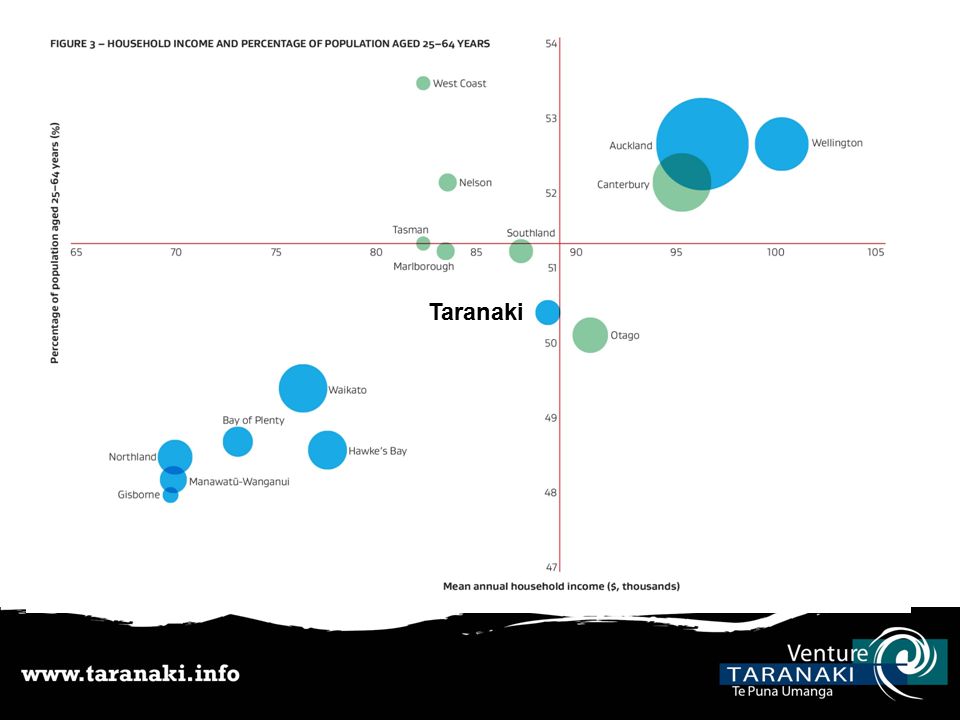
Regional snapshot

2
Taranaki

6
Population Growth – comparisons

7
Population Growth = 5 th highest region

8
Demographics: New Plymouth v New Zealand

9
International migration less people leaving; more people coming from overseas

10
Highest regional GDP per capita in NZ

11
Regional GDP = $9.2B (Stats NZ)
")
12
NZ Comparison Circa 2.5% NZ (Population, Businesses) But 4% GDP Taranaki is a powerhouse in the economic drivers that matter to NZ: – Energy, – Exports, – Primary production/added value – Engineering Highest GDP per capita in NZ
 But 4% GDP Taranaki is a powerhouse in the economic drivers that matter to NZ: – Energy, – Exports, – Primary production/added value – Engineering Highest GDP per capita in NZ")
13
Employment Almost 28% higher than 2000

14
Industries such as O&G, engineering, manufacturing and dairy farming are comparative strengths

15
We’re New Zealand’s foremost energy province

16
2013/2014 Q1 – A Rock Star Year

18
Taranaki Challenges a perfect storm?

19
But…we are also diversified

20
What lies ahead? Early 2016 economic outlook – tight Global dairy & O&G prices create challenging economy Skill retention/impacts for many industries 2017/18 – major projects in pipeline(eg Ballance) Shell NZ Divestment? Changing patterns and new opportunities. Diversification, online retail, innovation, export development, work-live patterns, infrastructure Proactive strategies needed in line with the above.
 Shell NZ Divestment. Changing patterns and new opportunities. Diversification, online retail, innovation, export development, work-live patterns, infrastructure Proactive strategies needed in line with the above..")
Similar presentations


 National Development and Reforming Commission of PRC 68501512>")


