Download presentation
Presentation is loading. Please wait.

1
Studies on performance of food waste collections Chris Mills - ROTATE Adviser WRAP

2
Food waste collections Local Authority drivers and objectives: LATS recycling targets cost service quality

3
Earlier WRAP Research - key findings Potentially higher costs where food waste is added to fortnightly garden collections typically lower diversion of food waste (~0.6 kg/hhld/wk) proportion of food waste in mixed collections low (~10%) higher treatment costs from processing large amounts of garden waste through IVC and treating food still in refuse system Consider separate food waste collections achieve higher capture rates when collected weekly and if refuse collected fortnightly processing costs for food waste can be minimised need to make it easy for people to take part
 proportion of food waste in mixed collections low (~10%) higher treatment costs from processing large amounts of garden waste through IVC and treating food still in refuse system Consider separate food waste collections achieve higher capture rates when collected weekly and if refuse collected fortnightly processing costs for food waste can be minimised need to make it easy for people to take part")
4
Postcards from Italy

5
How are food collections being implemented in UK? 54 UK Authorities are collecting food and garden waste combined 55 UK Authorities are operating food only services Separate round Collected on same vehicle as recycling/refuse

6
Monitoring Participation and set out rates Kg/hh/wk diverted Capture rates Socio-economic links Refuse and recycling system links Householder views Pass rates / pick rates Productive/non-productive time Consensus on service delivery/roll out Authorities need good quality data to plan and deliver efficient services

7
Combined garden/food waste

8
Capture issues with combined systems Low food / high garden captures Residents disposing of food waste in the residual bin in the intervening week? Less willing to put meat/fish in garden bin? Suitability of feedstock for treatment option More difficult to monitor Studies underway to obtain more data on performance of combined garden and food collections

9
% Composition of combined material food card garden contamination fortnightly food + caddy AWC refuse fortnightly food + caddy AWC refuse fortnightly food AWC refuse weekly food + caddy weekly refuse weekly food AWC refuse fortnightly food + caddy weekly refuse

10
Participation & waste composition studies (Sept/Oct 2008) Weekly combined GW/FW - 57-81% participation; 41-62% set out Fortnightly combined GW/FW - 64-88% participation; 41-68% set out Large gap between participation and set out Participation more likely led by garden Fair capture of vegetables and fruit Very low captures of cooked food and meat/dairy/fish
 Weekly combined GW/FW % participation; 41-62% set out Fortnightly combined GW/FW % participation; 41-68% set out Large gap between participation and set out Participation more likely led by garden Fair capture of vegetables and fruit Very low captures of cooked food and meat/dairy/fish")
11
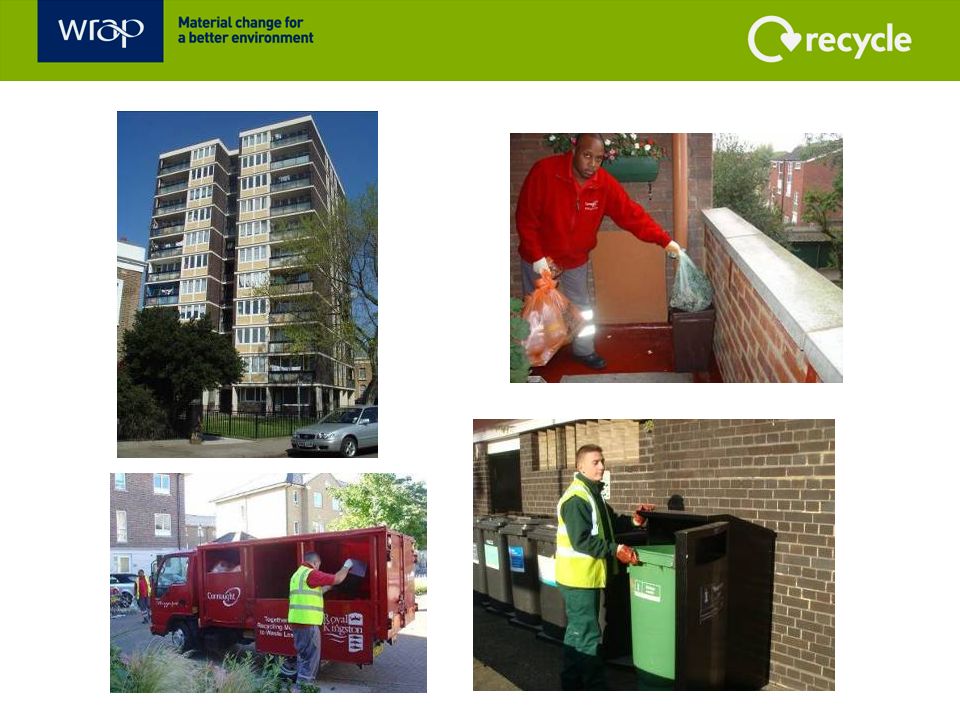
WRAP Trial authorities: 18 English partners 1 N Ireland partner 94,000 households Trials also taking place in Scotland managed by Remade Scotland Food only Collections

12
…all householders provided with a kitchen caddy & free supply of liners 7l caddy 20 cm After initial supply, targeted supply to participating households only was encouraged

13
Kerbside Buckets c 25 litre

14
Range of smaller vehicles trialled – typically 7.5t gvw

16
Participation rate and yield Weekly refuse Fortnightly refuse Multi- occupancy

17
Influence of AWC (Kg/hhld served/wk)
")
18
Food waste and deprivation levels

20
What do these results mean? Refuse collection frequency and deprivation statistically significant factors in the performance of food services Higher food waste yields: –more affluent areas –fortnightly refuse collections Yields and participation rates tend to be maintained in schemes with fortnightly refuse Good captures of cooked food and meat/dairy In areas with weekly refuse collections – where sacks used for refuse, food waste yields tended to be higher

21
Satisfaction levels – participants Collection service 78% of respondents never had any service problems Issues raised: –6% odour/vermin –4% missed collections –3% insufficient liners provided Containers & caddies ~95% satisfaction; ~2% “too small” Liners 98% satisfaction; <1% “liners leak” Communications materials Leaflets most commonly seen publicity material 95% “provided all necessary practical information”

22
Comparing collection system types Kg food per participating hh/year

23
Liner options 1.Free (but targeted) provision; c £2-3 hh/yr 2.Limited supply then residents buy own 3.Residents purchasing own from local retailers; £11- £32 hh/yr Liners do seem to raise participation and satisfaction Careful distribution required to minimise costs Less of case for free liners where participation expected to be very high Consider as a “tool” Compostable vs biodegradable
 provision; c £2-3 hh/yr 2.Limited supply then residents buy own 3.Residents purchasing own from local retailers; £11- £32 hh/yr Liners do seem to raise participation and satisfaction Careful distribution required to minimise costs Less of case for free liners where participation expected to be very high Consider as a tool Compostable vs biodegradable")
24
Key factors influencing cost/efficiency Set outs Round size Number of households that can be served/day - –productivity and size of crew –skill levels, loading time, use of slave bins Travel time to IVC/AD plant Vehicle capital and running costs Supply of liners

25
Food only collection costs - breakdown

26
Balance of time: Food trials

27
Summary - comparison of options Difficult to directly compare options Food only collections achieve much higher capture than mixed schemes Mixed schemes cheaper to collect but unlikely to divert large quantities of food For mixed schemes also consider cost of treating garden waste and reprocessing implications Frequency of collection very important Important to evaluate £/hh as well as £/tonne Need to factor avoided disposal costs into evaluations

28
Thank You Local Government Services WRAP T: 01295 819661 lgs@wrap.org.uk Chris.Mills@wrap.org.uk Food Waste Trials Report available at www.wrap.org.uk/la

Similar presentations


 Regulations 2009>")


 are installed in nearly 50 out of 120 of Her Majesty’s prisons. The.>")


