Download presentation
Presentation is loading. Please wait.

1
Economic Indicators Business Cycle –“Real” GDP versus “Nominal” –GDP Deflator –C+I+G+NX –6 month contraction = Recession Unemployment Rate –4 Types –Calculation Inflation –CPI/GDP Deflator –Cost of Living Adjustment –“Real” Income

2
Causes cancer Why entering Chinese waters? REI Black Friday closing Republican poll leader University removed state flag

3
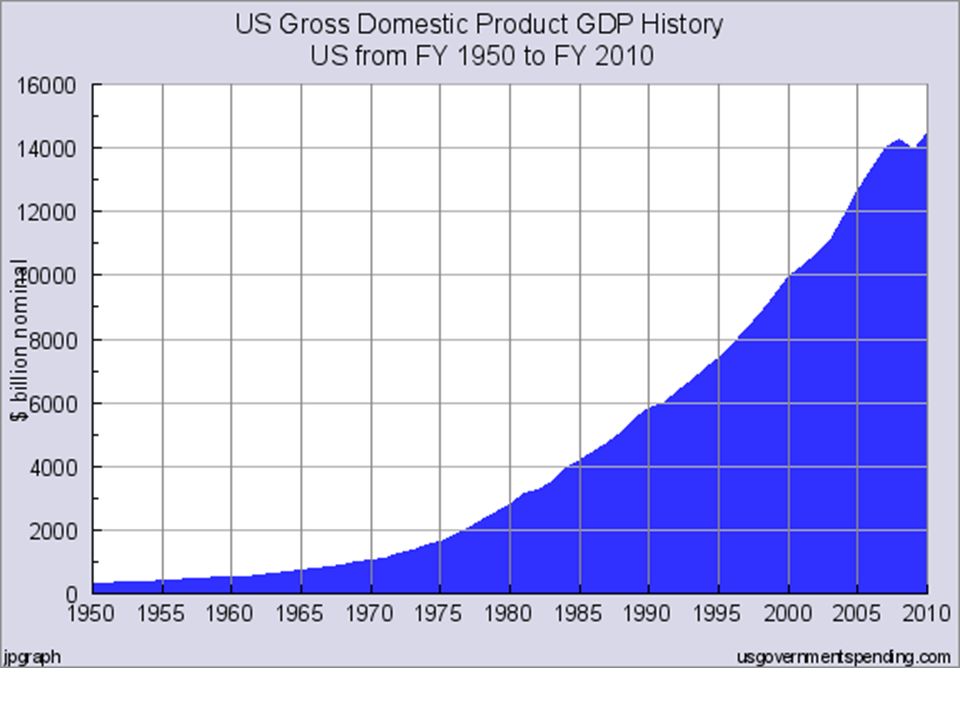
GDP Total value of all final goods and services produced within a country within a given year. C+ I+ G+ NX

4
Gross Domestic Product C- Consumer Spending I- Business Investment and Inventory G- Government Spending NX- Net Exports (Exports minus Imports)
")
5
GDP C + I + G + NX Don’t Count –Used –Transfers –Non-market –Intermediate goods*

7
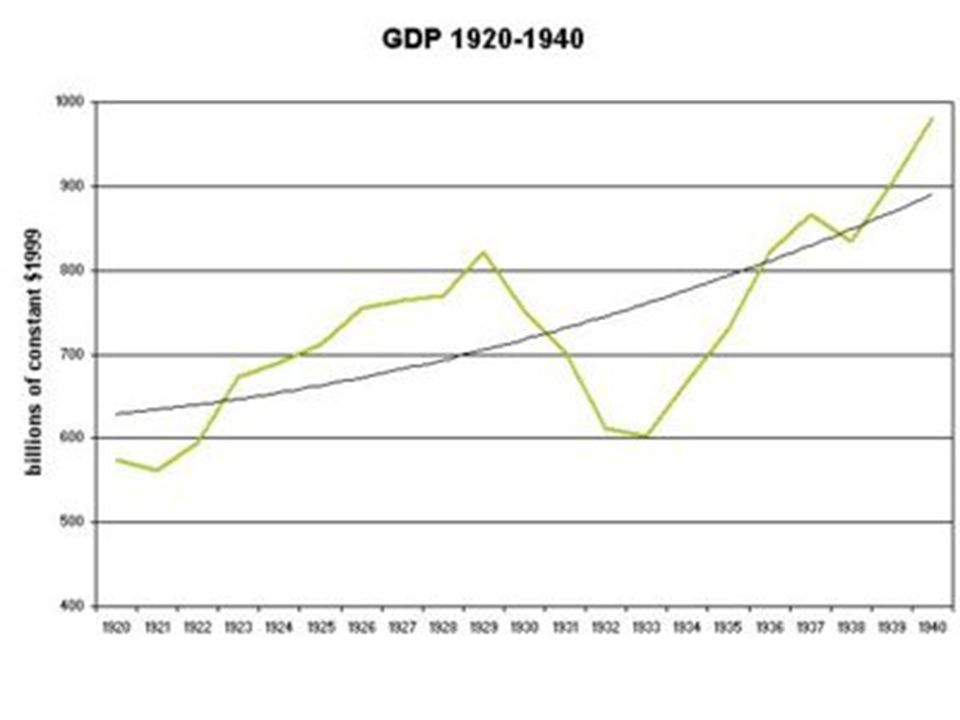
Business Cycle Recession- real GDP goes down for at least 6 months. REALGDPREALGDP

10
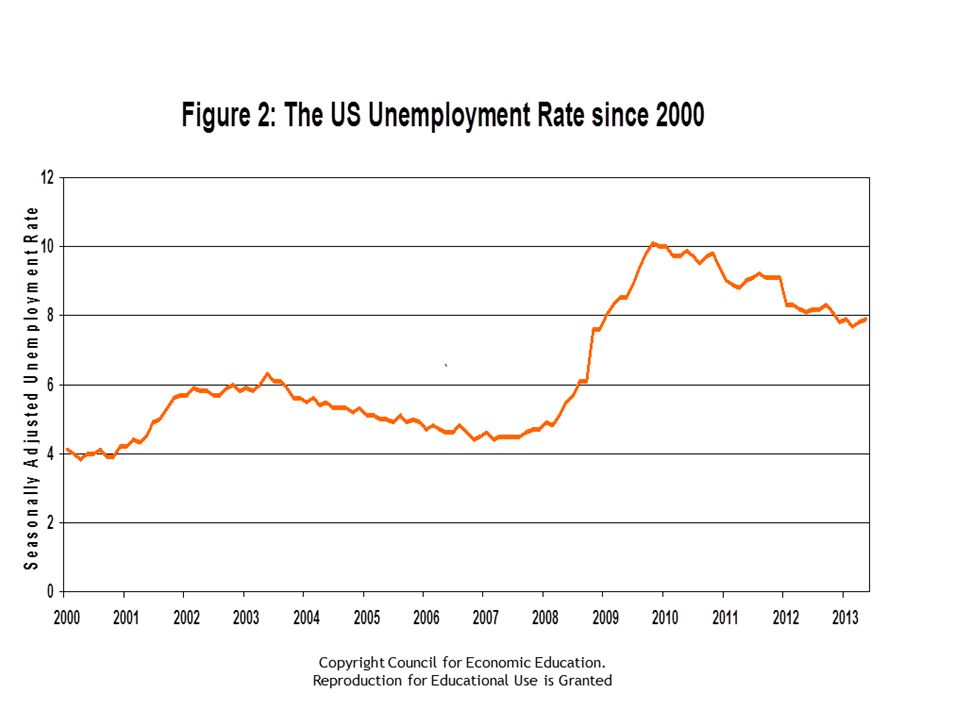
Unemployment Unemployment Rate= Unemployed Persons/Total Labor Force X 100 Labor Force= all civilians 16+ who are working or looking for a job Unemployed Persons= 16+ civilians who are looking for a job but do not have one

11
All Stats are for People 16 or Older Population = 1000 Pop. with jobs = 600 Pop. Without jobs = 400 Pop. Actively seeking employment in past month = 190 Pop. from previous category who currently have a job = 40

12
Unemployment (National)
")
13
Types of Unemployment Frictional- temporary while searching Structural-lack of skills/lack of need for skills/replacement by technology/replacement by merger or streamlining Cyclical- related to health of overall economy Seasonal- seasonal Not

16
Not Unemployed If… Under 16 Have a Job Are not actively seeking a job Are not currently available to work

17
Poor _________ Extra Credit Write a story about a person who experiences all 4 types of unemployment in a given year and then drops out of the labor force. 1 page double spaced 6 points

18
Unemployment Formula Unemployment Rate= Unemployed Persons/Total Labor Force X 100 Labor Force= all civilians 16+ who are working or looking for a job Unemployed Persons= 16+ civilians who are looking for a job but do not have one

19
Frictional Structural Cyclical Seasonal Not

20
Hit the debt ceiling, government slashes spending, GDP tanks Frictional Structural Cyclical Seasonal Not

21
You can’t stand this class anymore, drop out, and start looking for work Frictional Structural Cyclical Seasonal Not

22
A former switchboard operator is having trouble finding a skilled position Frictional Structural Cyclical Seasonal Not

23
New Jersey surf instructor in January Frictional Structural Cyclical Seasonal Not

24
Mr. Parish this summer. Frictional Structural Cyclical Seasonal Not

25
Calculate Population = 14,000 Population 16-64 = 10,000 Employed Persons = 6,000 Unemployed Persons = 215 --------------------------------------------------------- Labor Force = ____________ Unemployment Rate = ______________ Labor Force Participation Rate = _______

26
Unemployment (National)
")
27
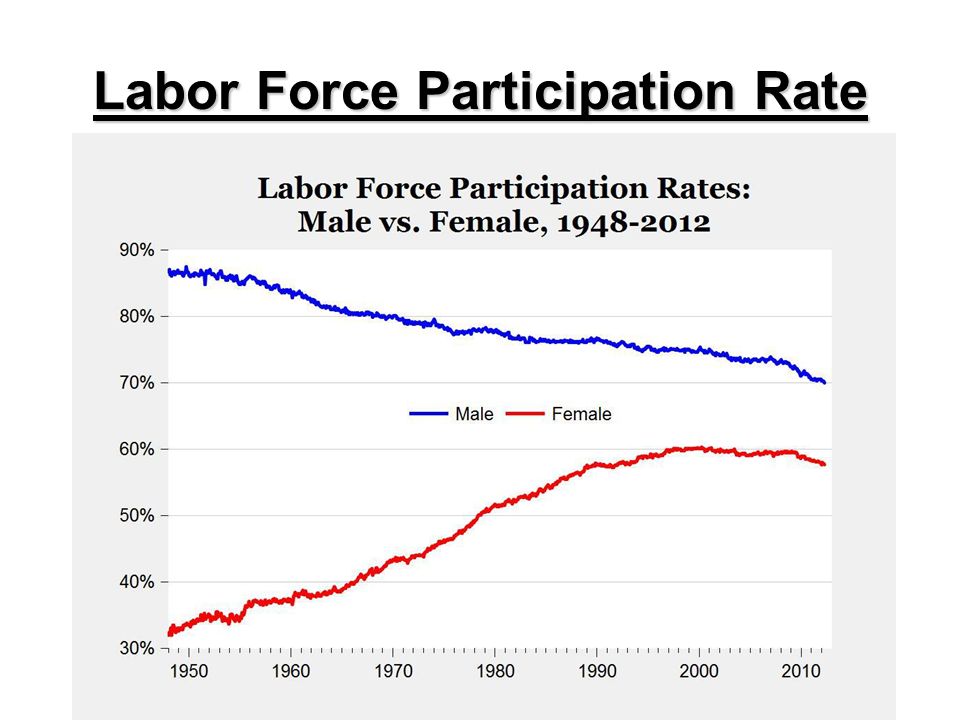
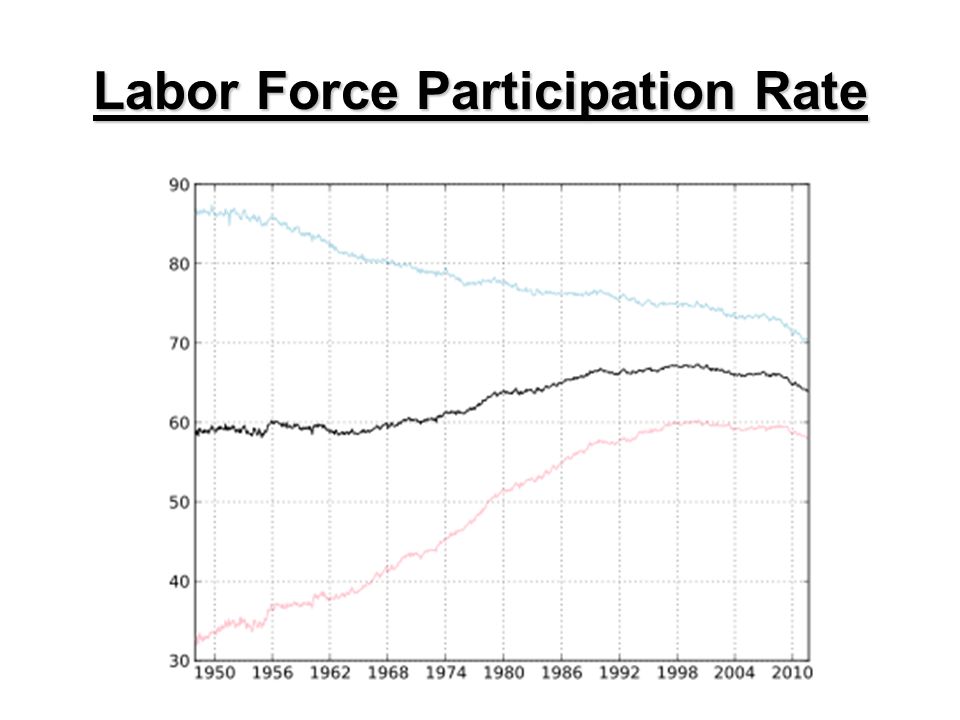
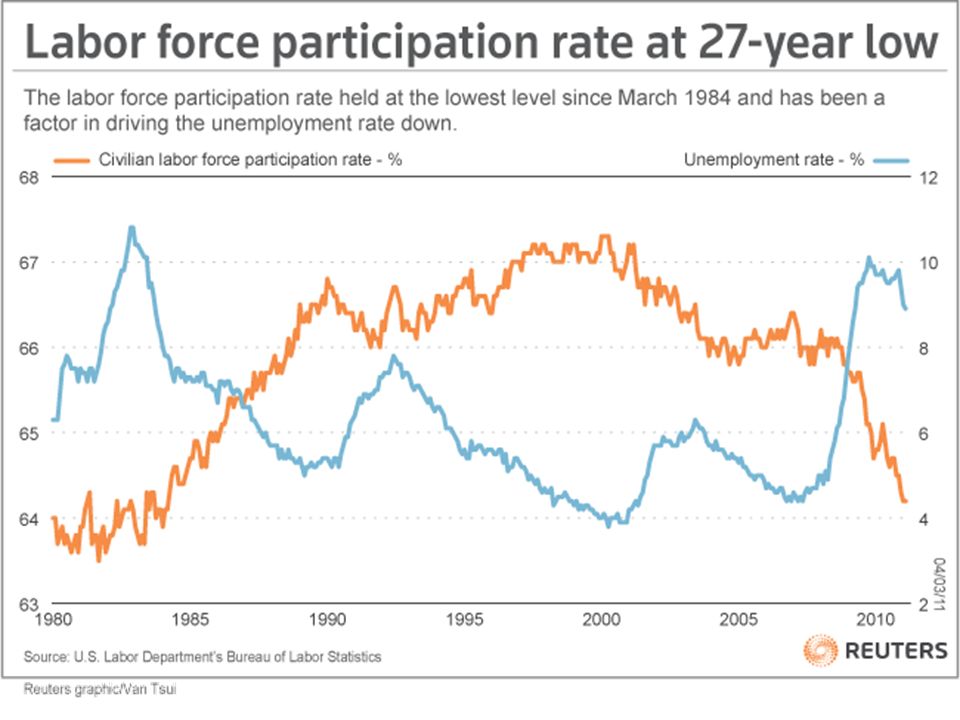
Labor Force Participation Rate

31
% of working age people who are –Working –Looking for a Job Working Age –16-64

32
Calculate Population = 14,000 Population 16-64 = 10,000 Employed Persons = 6,000 Unemployed Persons = 215 --------------------------------------------------------- Labor Force = ____________ Unemployment Rate = ______________ Labor Force Participation Rate = _______

33
Labor Force Participation Rate % of working age people who are –Working –Looking for a Job % working age population in the labor force Working Age –16-64

34
Calculate Population = 10,000 Population 16-64 = 8,000 Employed Persons = 5,000 Unemployed Persons = 350 --------------------------------------------------------- Labor Force = 5,350 Unemployment Rate = 6.54% Labor Force Participation Rate = 66.88%

35
Agenda Debate and House News –Goodbye Mr. Weeper! GDP Review and Unemployment by State Measures of Inflation –CPI versus GDP Deflator 10 minutes to finish classwork (otherwise HW)
.")
36
Economic Indicators Business Cycle –“Real” GDP versus “Nominal” –GDP Deflator –C+I+G+NX –6 month contraction = Recession Unemployment Rate –4 Types –Calculation –Labor Force Participation Inflation –CPI/GDP Deflator –Cost of Living Adjustment –“Real” Income Stock Indices

37
2015 US GDP: C+I+G+NX Sale of a Delorean

38
2015 US GDP: C+I+G+NX Purchase of $10,000 of Disney stock

39
2015 US GDP: C+I+G+NX 10,000 unsold Ford f-150 pickups

40
2015 US GDP: C+I+G+NX Tires purchased by Ford Motor Company

41
2015 US GDP: C+I+G+NX Machines purchased by Ford Motor Company

42
2015 US GDP: C+I+G+NX East Penn Schools purchases an iPad for every student

43
2015 US GDP: C+I+G+NX I just purchased a Man in the Yellow Hat costume

44
2015 US GDP: C+I+G+NX A bottle of delicious Canadian maple syrup Eh?

45
2015 US GDP: C+I+G+NX Largest Component by far?

46
2015 US GDP: C+I+G+NX Component that would shrink if a Republican is elected and keeps his/her promise

47
Inflation Prices go Value of the dollar goes

48
Inflation Prices go UP Value of the dollar goes DOWN

50
Inflation TWO CAUSES?

51
Demand-Pull Inflation

52
Cost-Push Inflation

53
Stagflation

54
Measures of Inflation GDP Deflator Consumer Price Index (CPI)
")
55
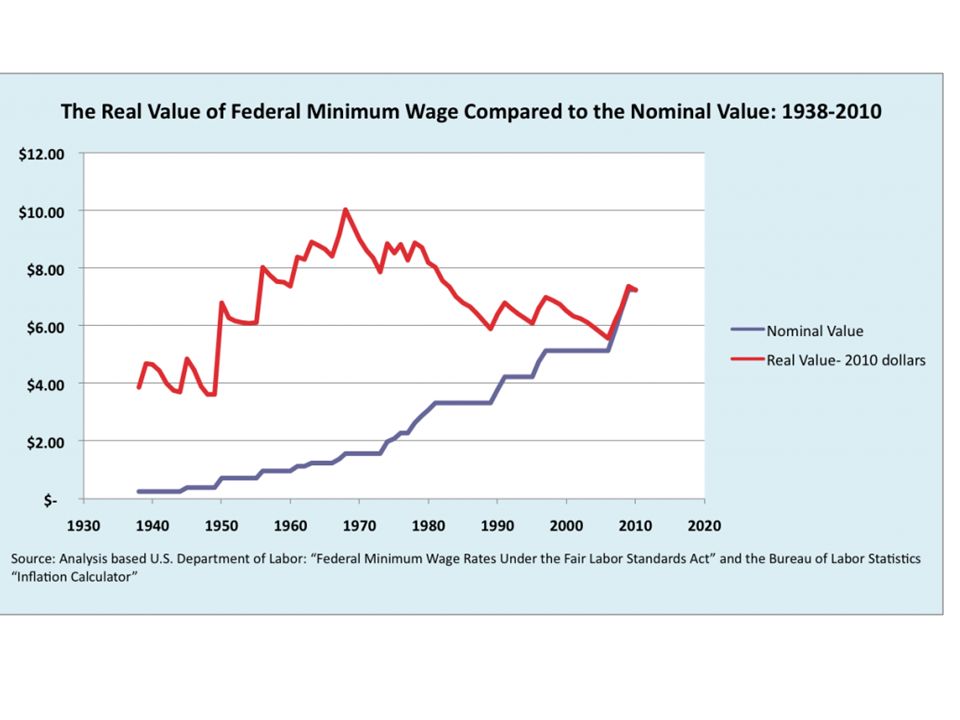
Inflation Terms Nominal- unadjusted dollar amounts Real- adjusted for inflation

56
Using the GDP Deflator Nominal $$$$/GDP deflator x 100= Real $$$ Real $$$ = Adjusted for Inflation Base Year Deflator = 100

57
Consumer Price Index Measures change in price level of a “fixed basket of goods” Used for Social Security “cost of living” adjustments (COLA)
")
58
Consumer Price Index Herbert Hoover= $75,000 President Obama = $400,000

59
Consumer Price Index Babe Ruth’s Salary –1931= $80,000 Average Player Today= $2,272,620

61
Consumer Price Index

62
GDP Deflator

63
GDP Deflator versus CPI GDP Deflator –variable basket –Best for real GDP CPI –fixed basket –Best for COLA (ex. Social security)
.")
64
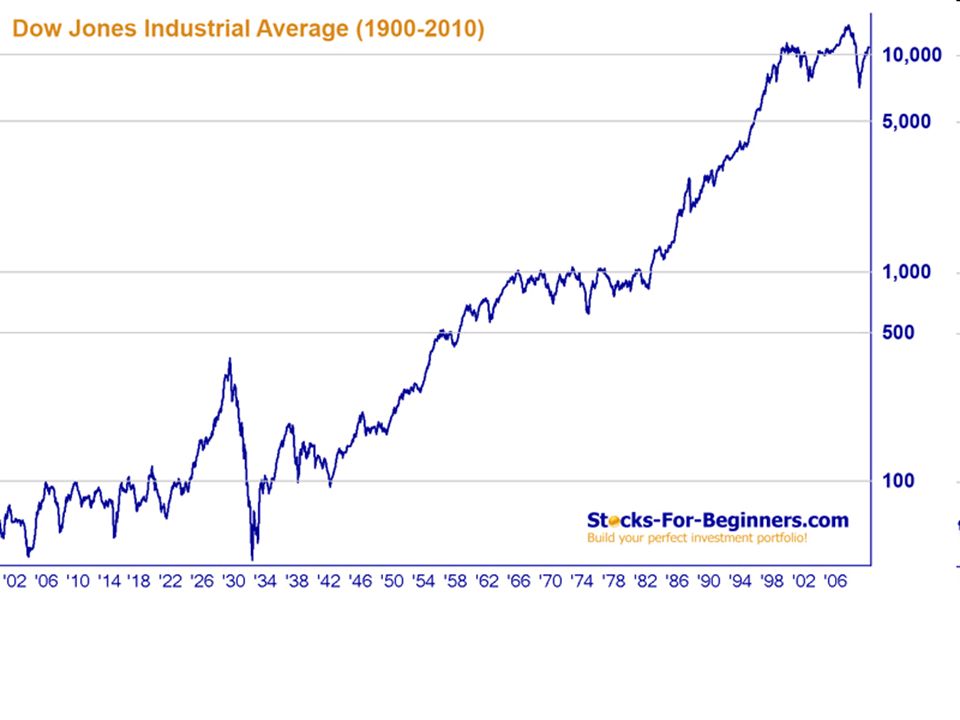
Stock Indexes (Indices) measure the performance of a segment of the stock market Dow Jones Industrial Average –30 Large Companies S&P 500 500 companies of various industries NASDAQ –3,000 companies –Technology/growth companies (ex- Google)
 measure the performance of a segment of the stock market Dow Jones Industrial Average –30 Large Companies S&P companies of various industries NASDAQ –3,000 companies –Technology/growth companies (ex- Google)")
66
Stock Indexes (Indices) measure the performance of a segment of the stock market Dow Jones Industrial Average –30 Large Companies S&P 500 500 companies of various industries NASDAQ –3,000 companies –Technology/growth companies (ex- Google)
 measure the performance of a segment of the stock market Dow Jones Industrial Average –30 Large Companies S&P companies of various industries NASDAQ –3,000 companies –Technology/growth companies (ex- Google)")
68
Stock Indexes (Indices) measure the performance of a segment of the stock market Dow Jones Industrial Average –30 Large Companies S&P 500 500 companies of various industries NASDAQ –3,000 companies –Technology/growth companies (ex- Google)
 measure the performance of a segment of the stock market Dow Jones Industrial Average –30 Large Companies S&P companies of various industries NASDAQ –3,000 companies –Technology/growth companies (ex- Google)")
69
NASDAQ

70
Stock Terms Ticker- company abbreviation Share- a single “piece” of a company “pie” Portfolio- a collection of investments Index- measures performance of a segment of the stock market

71
Economic Indicators Business Cycle –*GDP = 18.1 Trillion –GDP Growth = 2% (3.22% average since 1948) Unemployment Rate –*5.1% Inflation –CPI Stock Indices
 Unemployment Rate –*5.1% Inflation –CPI Stock Indices")
72
Externalities Consequence of economic activity affecting an uninvolved party Positive or Negative Production or Consumption

Similar presentations


 & the 4 components Unemployment.>")


. Unemployment Formula Unemployment Rate= Unemployed Persons/Total Labor Force X 100 Labor Force= all civilians 16+ who are working.>")


 What is Gross Domestic Product and how we measure it? Why is this measure important? What are the definitions of the major.>")
