Download presentation
Presentation is loading. Please wait.

1
NOTE: To change the image on this slide, select the picture and delete it. Then click the Pictures icon in the placeholder to insert your own image. Broad Market Indicators

2
LIBOR London InterBank Offered Rate of LIBOR is the benchmark interest rate which one bank charges the another for short term loans.

3
Fed Funds Rate Interest rate at which one bank lends funds to another bank overnight.

4
Fed Funds Rate vs. LIBOR LIBOR is market determined Fed Funds might not be market determined LIBOR mainly concerns with the Eurodollars whereas the Fed Funds deals with only dollars

5
Fed Funds Rate vs. LIBOR

6
Predicting Fed Funds Rate Fed Funds Futures: Future contracts that represents the market opinion of the average daily fed funds effective rate The probability of an interest rate hike is given by:

7
Probability of Rate Hike (December 2015) As of 1 st December 2015:
 As of 1 st December 2015:")
8
Probability of Rate Hike as of Today

9
Predicting Fed Funds Rate

10
Yield Curve

11
Yield Curve (continued)
")
12
Yield Curve as of Today

13
Yield Curve: December 2015 vs Today

14
Effect of Interest rate on Different Asset Classes Stock Market Fixed Income Market Real Estate Currency market

15
Effect of interest rate on stock market An interest rate hike means that there is a good chance that the stock market will decline Interest rate hike means that borrowing is more costly

16
S&P 500 after the December 2015 Rate hike Interest Rate hike

17
S&P 500 after the June 2004 Rate hike Interest Rate Hike

18
Effect of Interest Rate on Bond Markets An interest rate hike means that the bond in your portfolio will lose value. Long term bonds have a greater impact as compared to the short term bond.

19
3-Month Treasury Bill Rate: Post 2004 Rate Hike Interest Rate Hike

20
10 Year Treasury Bill Rate: Post 2004 Rate Hike Interest Rate Hike

21
3-Month US Treasury Bill: Post 2015 Rate Hike

22
30 – Year US Treasury Bill: Post 2015 Rate Hike

23
Effect of Interest Rate on Real Estate Interest Rate Hike implies that borrowing is costlier which will drive down the prices of houses.

24
Effect of Interest Rate on Local Currency An interest rate hike implies that the lender will have an incentive to lend more. Interest rate hike in the local economy will incentivize foreign investors to provide more funds to the local economy. This will lead to an appreciation of local currency.

25
U.S. Dollar Index Interest Rate Hike

26
Effect of U.S. Dollar on Different Asset Classes Stock Market Bond Market Commodities Market- Gold & Oil

27
Effect of U.S. Dollar on Stock Market Large cap vs Mid & Small Cap Export Based industries vs. Import based Industries

28
Large Cap Market Index

29
Electronic Computer Industry(Import Based)
")
30
Pharmaceuticals Index(Export Based)
")
31
Effect of U.S. Dollar on Treasury Market Generally, an appreciation in U.S. Dollar will lead to a fall in demand of U.S. Treasury Bills The biggest buyer of U.S. Treasuries are China(~$1.2 trillion) and Japan(~$1.1 trillion) However, this usually doesn’t applies when there is a financial crisis.
 and Japan(~$1.1 trillion) However, this usually doesn’t applies when there is a financial crisis..")
32
U.S. Dollar Index & 2-Year Treasury Maturity Rate

33
Effect of U.S. Dollar on Gold and Oil Prices Both, Gold and Oil are traded in terms of U.S. Dollars Naturally, an appreciation of U.S. Dollars will lead to a fall in demand of Gold and Oil.

34
Effect of U.S. Dollar on Gold prices

35
Effect of U.S. Dollar on Oil Prices

36
NOTE: To change the image on this slide, select the picture and delete it. Then click the Pictures icon in the placeholder to insert your own image. Bubbles & Analysis of the current economy

37
How To Spot A Bubble? Rapid Increase in the prices Nasdaq rising 120% during the dot-com bubble Value of houses rising about 50% in just two years Prices break sharply from an asset's underlying value Seeing the P/E Ratios During 2015 Chinese Stock Market crash, P/E ratios of stocks was around 26.

38
NASDAQ Composite Index

39
Household Leverage Ratio

40
How do Bubbles occur in the market? Exciting and potential unexplored stuff which the investors are generally unaware of Bad Macroeconomic Policies

41
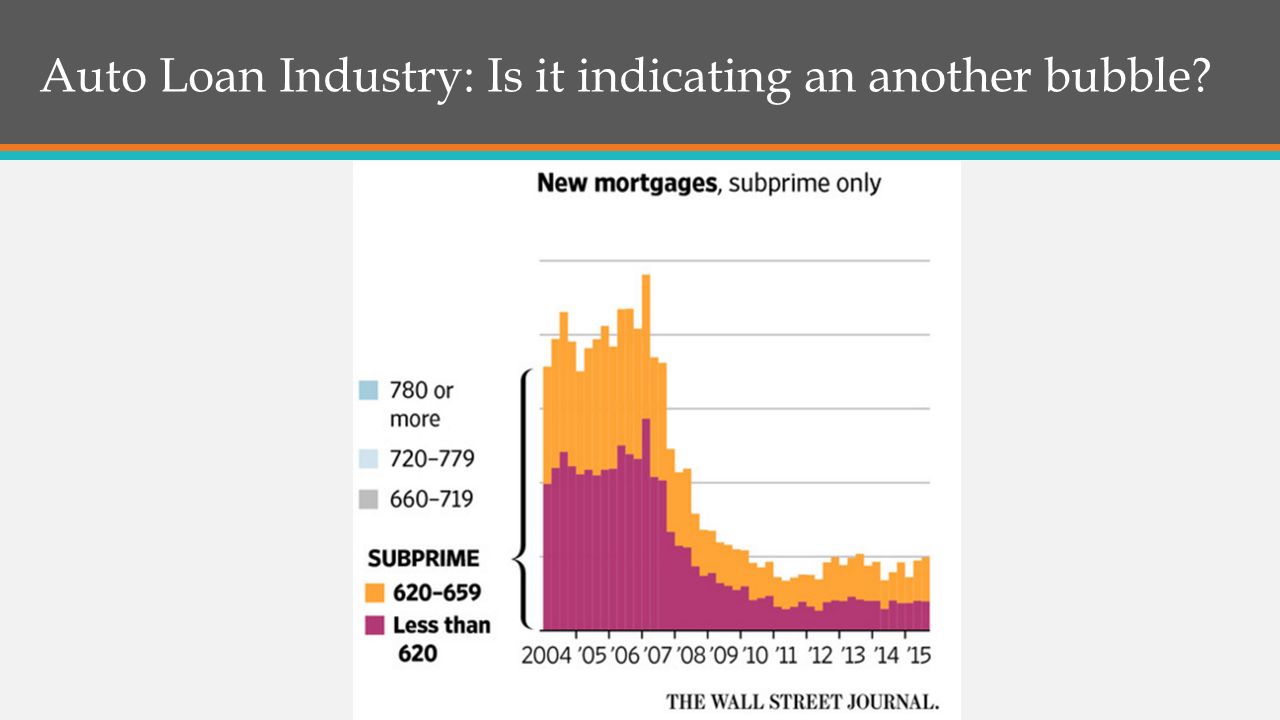
Auto Loan Industry: Is it indicating an another bubble?

44
Delinquency rates are over 5% Over 20% of the new automobile loans are subprime.

45
Low Oil Prices: What does it mean to an average investor?

46
Low Oil Prices: Background Increasing Oil Production OPEC countries refusing to cut down production U.S. starting to produce more oil Iran entering the market after the international sanctions are lifted Appreciating U.S. Dollar El Nino Warm weather which has reduced the demand for oil

47
Low Oil Prices: What does it mean to an average investor?

48
Slowdown for major oil exporting countries: Middle Eastern Countries Russia & Canada Boon for oil importing countries: Asian countries like China, India & Japan U.S.A?

49
Low Oil Prices: Investment Schemes Stock Market Emerging economies Currency Market Hedge

Similar presentations


>")


