Download presentation
Presentation is loading. Please wait.

1
Climate Networks A short journey of complex systems science in climate studies Potsdam-Institut für Klimafolgenforschung Institut für Physik, Humboldt-Universität zu Berlin RAS Inst. Applied Physics, Nizhny Novgorod juergen.kurths@pik-potsdam.de Jürgen Kurths

2
Contents Introduction Fractals & Deterministic chaos – utopistic expectations and applications to climate (70ies, 80ies) Structure formation in coupled climate sub- systems (90ies) Complex networks and climate (1998 - ?) Conclusions & Open Problems (2016 - ?)
 Structure formation in coupled climate sub- systems (90ies) Complex networks and climate ( ) Conclusions & Open Problems ( )")
3
Nonlinear Sciences Start in 1665 by Christiaan Huygens: Discovery of phase synchronization, called sympathy

4
Pendulum Clocks Christiaan Huygens: Pendelum clocks hanging at the same wooden beam (half-timber house) It is quite worth noting that when we suspended two clocks so constructed from two hooks imbedded in the same wooden beam, the motions of each pendulum in opposite swings were so much in agreement that they never receded the last bit from each other...Further, if this agreement was disturbed by some interference, it reastablished itself in a short time...after a careful examination I finally found that the cause of this is due to the motion of the beam, even though this is hardly perceptible (Huygens, 1673)
 It is quite worth noting that when we suspended two clocks so constructed from two hooks imbedded in the same wooden beam, the motions of each pendulum in opposite swings were so much in agreement that they never receded the last bit from each other...Further, if this agreement was disturbed by some interference, it reastablished itself in a short time...after a careful examination I finally found that the cause of this is due to the motion of the beam, even though this is hardly perceptible (Huygens, 1673)")
5
Basic feature of a complex system ability for self-organization non-trivial (some times unexpected) structure formation (here synchronization due to almost hidden coupling)
 structure formation (here synchronization due to almost hidden coupling)")
6
If we knew exactly the laws of nature and the situation of the universe at the initial moment, we could predict exactly the situation of that same universe at the succeeding moment. but even if it were the case that the natural laws had no longer any secret for us, we could still only know the initial situation approximately. If that enabled us to predict the succeeding situation with the same approximation, that is all we require, and we should say that the phenomenon had been predicted, that it is governed by laws. But it is not always so; it may happen that small differences in the initial conditions produce very great ones in the final phenomena. A small error in the former will produce an enormous error in the latter. Prediction becomes impossible, and we have the fortuitous phenomenon. Concept of Weak Causality (Poincare`, 1903)
.")
7
Achievements of Nonlinear Science/ Complex Systems Science Potentials & Limits

8
Basic Approaches 1) Fractals
 Fractals")
9
Mathematical Monsters: Koch Curve (Snowflake) - 1904 5. Iteration
 Iteration")
10
Problem in traditional Understanding Length n-th Iteration: U(n) = (4 / 3)ⁿ Limit: U(n) → ∞ für n → ∞ infinitely long But: Area finite (bounded) Fractal – Fractal Dimension (Felix Hausdorff, 1919)
 = (4 / 3)ⁿ Limit: U(n) → ∞ für n → ∞ infinitely long But: Area finite (bounded) Fractal – Fractal Dimension (Felix Hausdorff, 1919)")
11
Fractals (B.B. Mandelbrot) (70ies, 80ies) New kind of connection between Complexity and Infinity New Paradigm: Self-Similarity
 (70ies, 80ies) New kind of connection between Complexity and Infinity New Paradigm: Self-Similarity.")
12
Coastline South Norway D = 1.x

13
2) Deterministic Chaos Chaos (Yorke, 1975) Deterministic Chaos (Schuster, 1984) Originally: Henri Poincare´ (1854 – 1912)
 Deterministic Chaos Chaos (Yorke, 1975) Deterministic Chaos (Schuster, 1984) Originally: Henri Poincare´ (1854 – 1912)")
14
Simple map generates huge variety of dynamics (in dependence on parameter r) x n+1 = r x n ( 1 – x n )
 x n+1 = r x n ( 1 – x n )")
15
CHAOS: Sensitivity to initial conditions r = 3.8, x(0) = 0.4, x(0) + Δ = 0.41 strong growth of initial error Exponential growth – Lyapunov Exponent λ > 0 Deterministic Chaos r = 4 λ = 1 (fully developed chaos)
 = 0.4, x(0) + Δ = 0.41 strong growth of initial error Exponential growth – Lyapunov Exponent λ > 0 Deterministic Chaos r = 4 λ = 1 (fully developed chaos)")
16
Periodic windows, inner crisis, intermittency

17
Intermittency alternation of laminar and bursting regimes (chaos „partly visible“ in periodic phase)
")
18
Techniques of nonlinear time series analysis developed Estimates of fractal dimensions (Grassberger/Procaccia, 1983) and max Lyapunov exponents (Wolf, 1984) Successful applications to lab experiments (laser, fluid dynamics) (utopistic) expectation (hype): dynamics of many real-world systems is low-dimensional chaos (2 numbers!!!)
 and max Lyapunov exponents (Wolf, 1984) Successful applications to lab experiments (laser, fluid dynamics) (utopistic) expectation (hype): dynamics of many real-world systems is low-dimensional chaos (2 numbers!!!)")
19
„Hunting“ for a low-dimensional climatic attractor Climate D = 3.1 Nicolis… Nature 1984 D= 4.4 – 4.8 Fraedrich 1986 Weather D = 5 - 6 Essex, Nature 1987 7.3 Tsonis/Elsner, Nature 1988 7 – 8 Keppene 1989

20
All these „results“ are artifacts of the method (intrinsic correlations) No statistical evidence for a low- dimensional climatic attractor Climate cannot be described by a few ordinary differential equations Grassberger,… late 80ies, early 90ies
 No statistical evidence for a low- dimensional climatic attractor Climate cannot be described by a few ordinary differential equations Grassberger,… late 80ies, early 90ies")
21
Depression time (short) after too strong promises
 after too strong promises")
22
New Phenomena and Techniques (golden 90ies and later) Synchronization of chaotic systems (complete, generalized, phase; cluster) Amplitude/ Oscillation Death, Chimera Control of Chaos Communication with chaos (carrier; secure, efficient) Noise-induced order (stochastic resonance, coherence resonance, synchronization…)
 Synchronization of chaotic systems (complete, generalized, phase; cluster) Amplitude/ Oscillation Death, Chimera Control of Chaos Communication with chaos (carrier; secure, efficient) Noise-induced order (stochastic resonance, coherence resonance, synchronization…)")
23
Applications of complex synchronization lasers, circuits, engineering, chemical oscillators Physiology: mostly two coupled: heart and breathing rhythms Neuroscience: pairwise brain regions… Climate: ENSO vs. Indian Monsoon

24
El Niño vs. Indian Monsoon

25
Wavelet Analysis Thick black curve – statistically significant Thin black curve – not-correct statistical significance region GRL 2005, 2011 (with D. Smirnov and I. Mokhov)
.")
27
Next big step (1998 - ) Networks with complex topology approaching real-world much better
 Networks with complex topology approaching real-world much better")
28
Erdös-Renyi Graphs – Random Networks Distribution of degrees - Poisson

29
Small-world Networks Nearest neighbour and a few long-range connections k nearest neighbour connections Regular Complex Topology

30
Evolving Networks

31
Network of Networks Interconnected Networks Interdependent Networks Multiplex Networks Multilayer Networks…

32
Basic Studies

33
Fields of applications Spreading of diseases (humans, computers…) Spreading of information - Opinion formation (social networks) Structure formation in socio-economic networks Cascading failure (transport systems) Functioning of the brain Stability of power grids
 Spreading of information - Opinion formation (social networks) Structure formation in socio-economic networks Cascading failure (transport systems) Functioning of the brain Stability of power grids")
34
System Earth

35
Increasing CO 2 -Concentration IPCC 2007 2014: 400 ppm

36
Is there a break of global warming? Source NASA GISS

37
No weakening of global warming

38
Complex Network Approach to Climate

39
Network Reconstruction from a continuous dynamic system (structure vs. functionality) New (inverse) problems arise! Is there a backbone underlying the climate system?
 New (inverse) problems arise. Is there a backbone underlying the climate system .")
40
Basic Idea: Use of rich instrumentarium of complex network (graph) theory for system Earth and sustainability Hope: Deepened understanding of system Earth (with other techniques NOT possible)
 theory for system Earth and sustainability Hope: Deepened understanding of system Earth (with other techniques NOT possible)")
41
Climate Networks Observation sites Earth system Time series Climate network Network analysis

42
Infer long-range connections – Teleconnections

43
Artifacts and Interpretation of (Climate) Network Approach
 Network Approach")
44
Reconstructing causality from data ? Artefacts due to - Common drivers - Indirect links Achievements 1.Causal algorithm to efficiently detect linear and nonlinear links (Phys. Rev. Lett. 2012) 2.Quantifying causal strength with Momentary Information Transfer (Phys. Rev. E 2012) 3.Reconstructing Walker Circulation from data (J. Climate 2014, )
 2.Quantifying causal strength with Momentary Information Transfer (Phys. Rev. E 2012) 3.Reconstructing Walker Circulation from data (J. Climate 2014, ).")
45
Reconstructing causality from data Classic techniquesAdvanced method Correlation/regressionconditional independencies

46
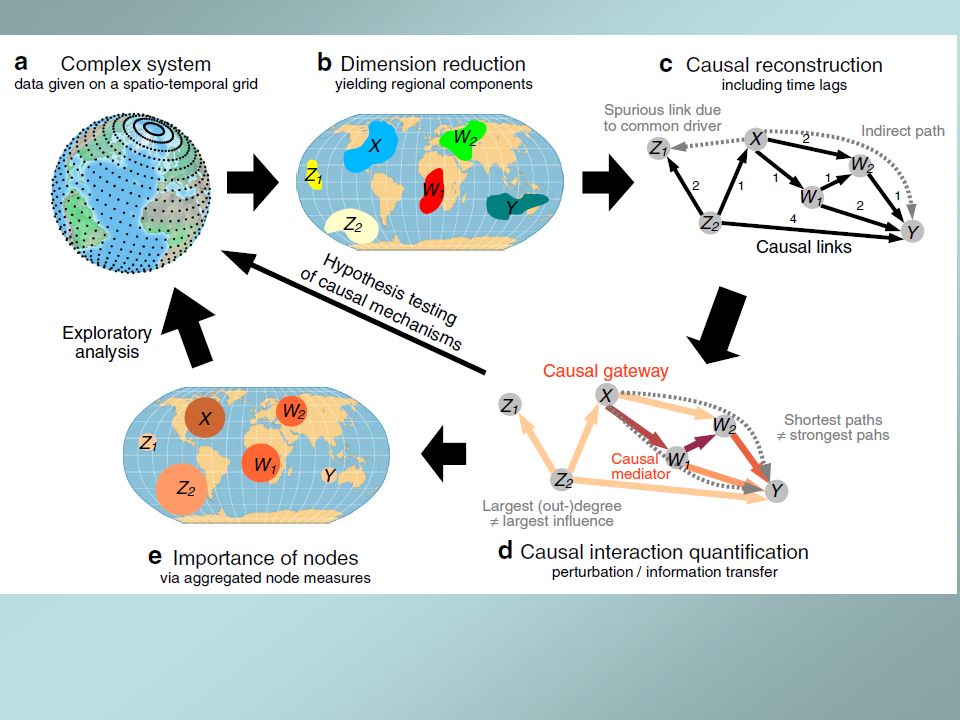
Identifying causal gateways and mediators in complex spatio-temporal systems Step 1: Dimension reduction via VARIMAX (principal components, rotation, significance) Step 2: Causal reconstruction: identify causalities based on conditional dependencies (different time lags) Step 3: Causal interaction quantification: identify strongest paths Step 4: Hypothesis testing of causal mechanisms Nature Commun, 6, 8502 (2015)
 Step 2: Causal reconstruction: identify causalities based on conditional dependencies (different time lags) Step 3: Causal interaction quantification: identify strongest paths Step 4: Hypothesis testing of causal mechanisms Nature Commun, 6, 8502 (2015)")
47
Each node corresponds to a lagged subprocess and owing to stationarity links for t imply links for all t-1, t-2,.... Process (black node) has two parents (gray nodes, connected via incoming links from the past) and one neighbor (hatched node, connected with an undirected contemporaneous link). In the case of a linear model, each multivariate regression coefficient a, b, and c can be attributed to a link. Parents
 has two parents (gray nodes, connected via incoming links from the past) and one neighbor (hatched node, connected with an undirected contemporaneous link). In the case of a linear model, each multivariate regression coefficient a, b, and c can be attributed to a link. Parents.")
49
Atmospheric data Reanalysis data – NCEP/NCAR (Boulder) surface pressure 1948 – 2012 Spatial resolution: 2.5º → 10,512 grid points Weekly data: each node time series of 3,339 points Big data
 surface pressure 1948 – 2012 Spatial resolution: 2.5º → 10,512 grid points Weekly data: each node time series of 3,339 points Big data")
50
60 strongest VARIMAX components refer to main climatic patterns ENSO: “0” – western uplift, “1” – eastern downdraft limbs Monsoon: “33” Arabian Sea high-surface-pressure sector, “26” tropical Atlantic West African Monsoon system

51
Identification of causal pathways Effects of sea level pressure anomalies in ENSO region to pressure variability in the Arabic Sea via the Indonesian Archipelago

52
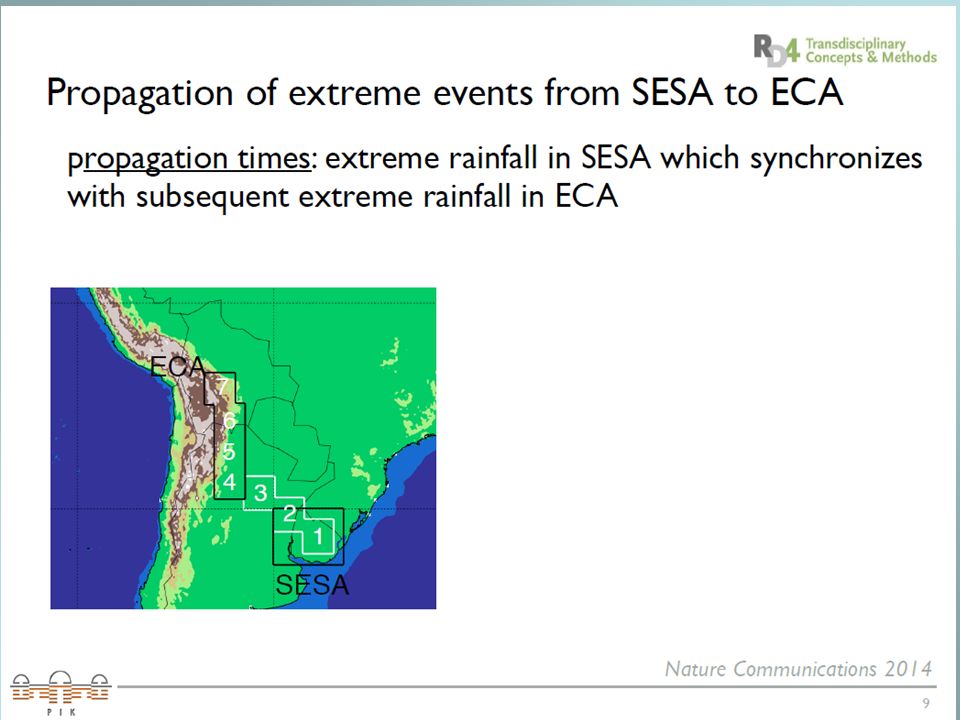
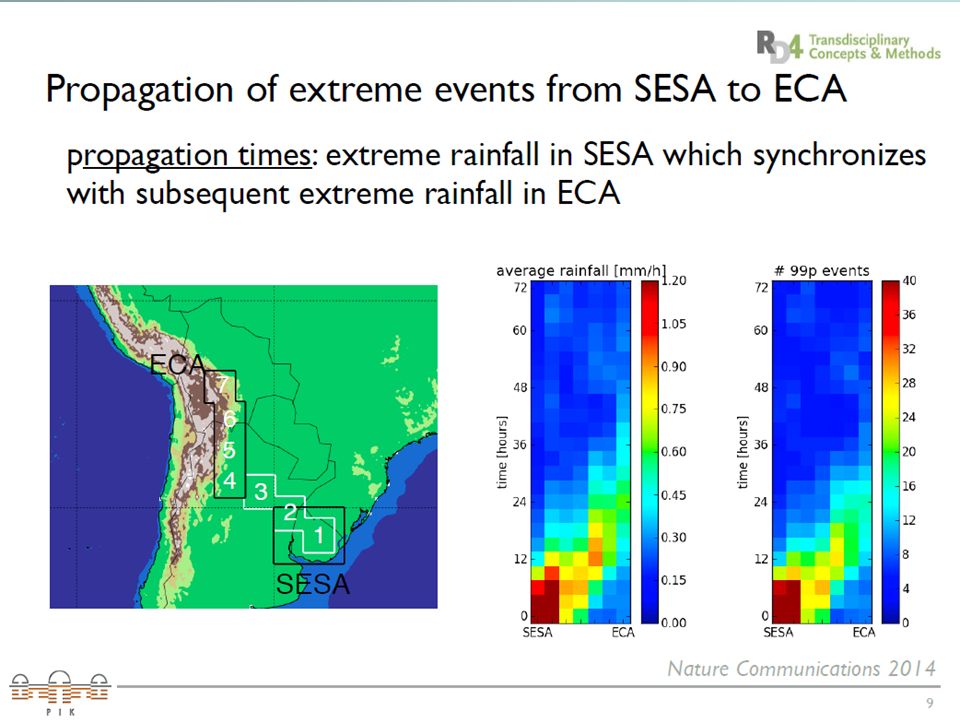
Extreme Events Strong Rainfall during Monsoon Challenge: Predictability

53
Motivation: the predictability of the Indian monsoon remains a problem of vital importance Objectives: to reveal spatial structures in network of extreme events over the Indian subcontinent and their seasonal evolution during the year.

54
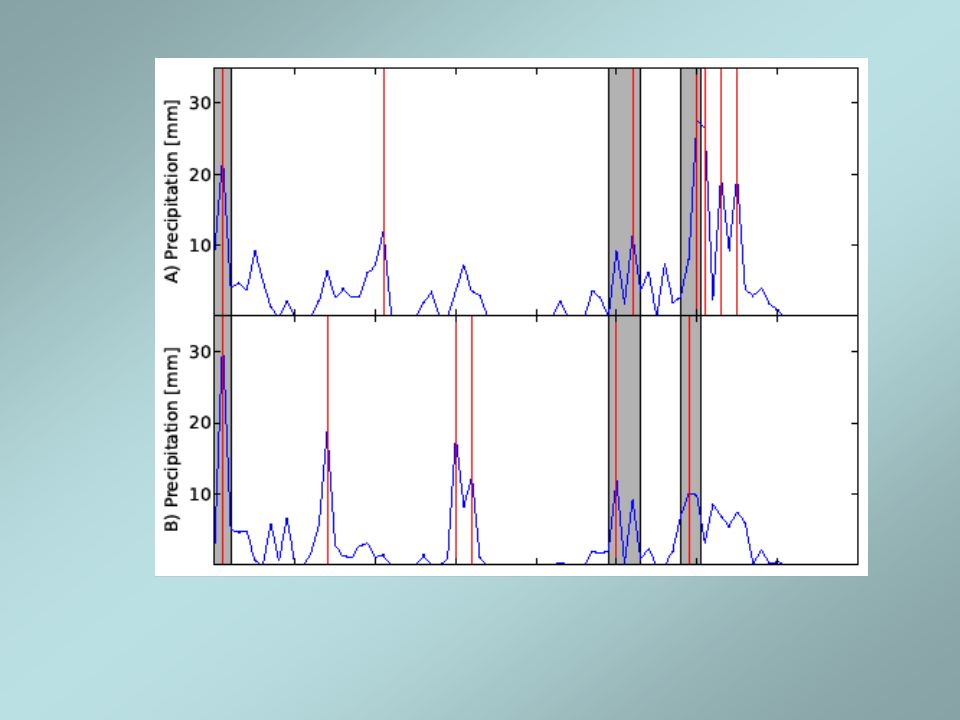
New Technique: Event Synchronization

59
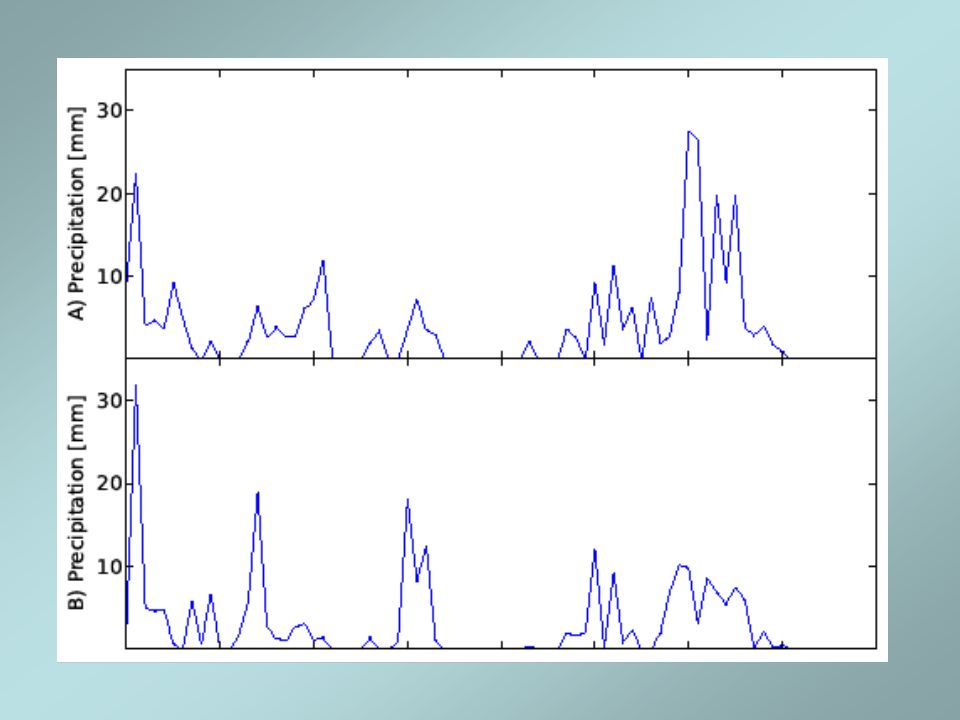
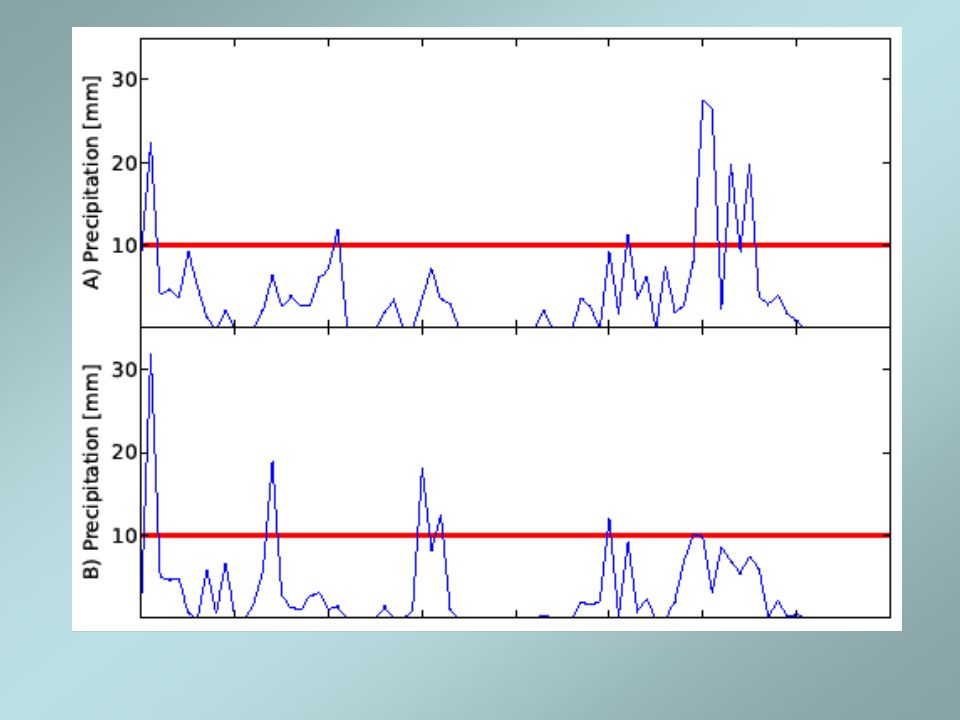
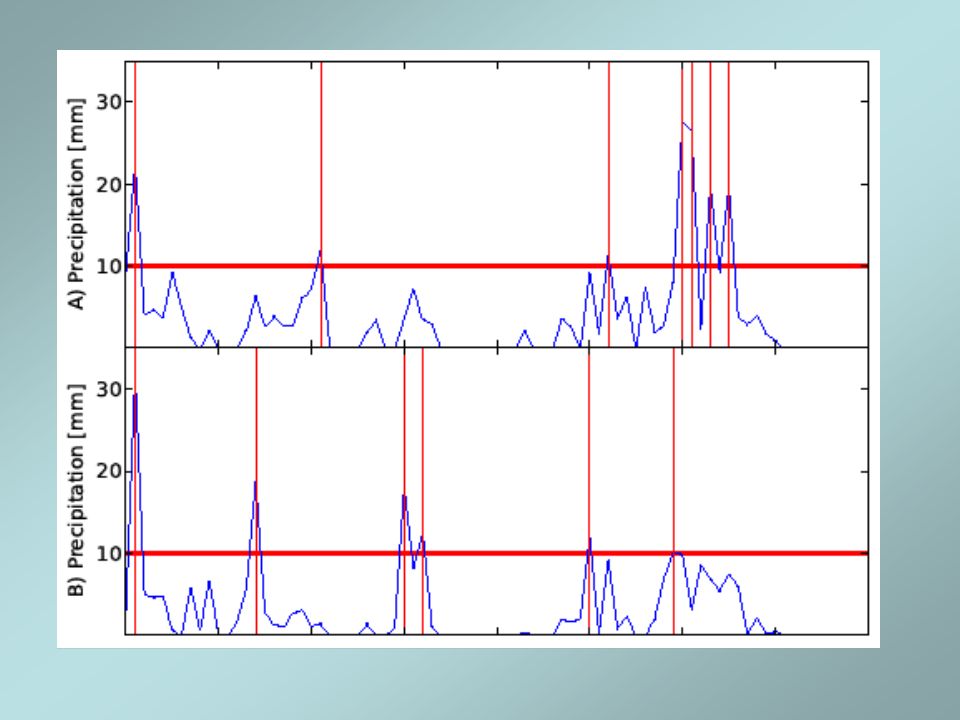
59 METHOD Network Nodes: geographical locations Links: synchronization of extreme rainfall events between nodes 1. Network approach Network measures degree betweenness Average link lengths Step 2. Event synchronization – use time lags to compare individual events between two grid points Step 1. Apply a threashold to time series of each grid point to obtain event series Step 3. Construct the network by creating links between points with the highest synchronization values 2. Event synchronization Rainfall amount (mm/day) Time (days) Quiroga et.al. 2002 Malik et.al. 2011 Boers et.al. 2013
 Time (days) Quiroga et.al Malik et.al Boers et.al")
60
Extreme Rainfall Events of the South American Monsoon System TRMM 3B42 V7 daily satellite data Measured: Jan 1, 1998 – March 31, 2012 Spatial resolution: 0.25 x 0.25 Spatial coverage: Method: event synchronization Extreme event: > 99 % percentile Dec-Feb (DJF) – summer monsoon months
 – summer monsoon months")
61
Non-symmetric Adjacency Matrix (in – out) > 0 – sink: extreme events here preceded by those at another location < 0 – source: extreme events follow at another location
 > 0 – sink: extreme events here preceded by those at another location < 0 – source: extreme events follow at another location")
66
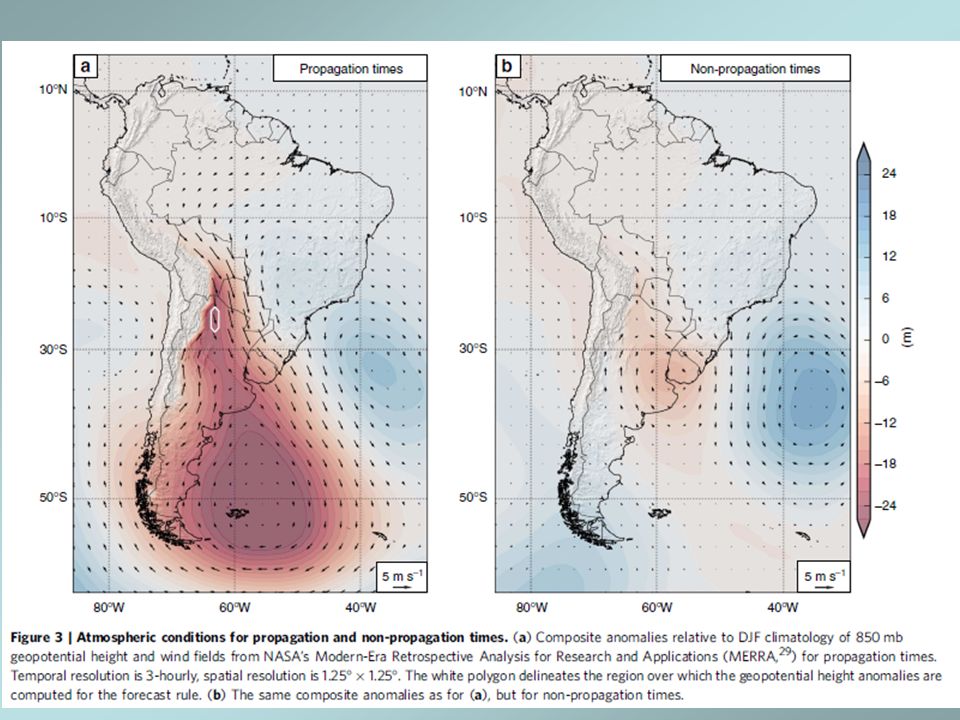
> 60 % (90 % during El Nino conditions) of extreme rainfall events in Eastern Central Andes (ECA) are preceded by those in Southeastern South America (SESA) Low pressure anomaly from Rossby- wave activity propagates northwards (cold front) and low-level wind channel from Amazon Nature Communication (2014), GRL (2014), J. Clim. (2014), Clim. Dyn. (2015)
, Clim. Dyn. (2015).")
67
Analysis of Simulation (Model) Data Case Study: Atlantic Meridional Overturning Circulation (MOC) With Henk Dijkstra & group GRL 40, 4386 (2013)
 Data Case Study: Atlantic Meridional Overturning Circulation (MOC) With Henk Dijkstra & group GRL 40, 4386 (2013)")
68
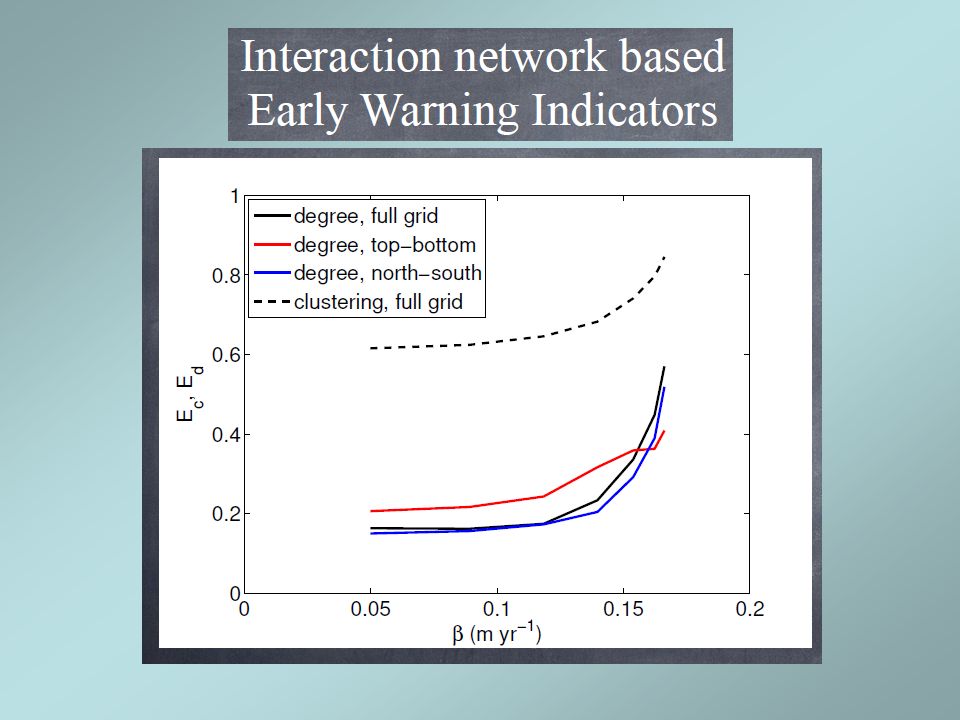
How stable is the conveyor belt? Changing parameter: anomalous fresh water flux (from North Atlantic)
.")
69
2D meridional depth model of the Atlantic MOC (Den Toom, Dijkstra, Wubs, 2011) 32x16 (x,z) spatial grid Network reconstruction
 32x16 (x,z) spatial grid Network reconstruction")
72
Our papers on climate networks Europhys. Lett. 87, 48007 (2009) Phys. Rev. E 81, 015101R (2010) Climate Dynamics 39, 971 (2012) PNAS 108, 20422 (2011) Phys. Rev. Lett. 106, 258701 (2012) Europhys. Lett. 97, 40009 (2012) Climate Past 8, 1765 (2012) Geophys. Res. Lett. 40, 2714 (2013) Climate Dynamics 41, 3 (2013) J. Climate 27, 720 (2014) Nature Scientific Reports 4, 4119 (2014) Climate Dynamics (2014) Geophys. Res. Lett. 41, 7397 (2014) Nature Commun. 5, 5199 (2014) Climate Dynamics 44,1567 (2015) J. Climate 28, 1031 (2015) Climate Past 11, 709 (2015) Climate Dynamics (online 2015) Nature Commun. 6, 8502 (2015)
 Climate Dynamics 39, 971 (2012) PNAS 108, (2011) Phys. Rev. Lett. 106, (2012) Europhys. Lett. 97, (2012) Climate Past 8, 1765 (2012) Geophys. Res. Lett. 40, 2714 (2013) Climate Dynamics 41, 3 (2013) J. Climate 27, 720 (2014) Nature Scientific Reports 4, 4119 (2014) Climate Dynamics (2014) Geophys. Res. Lett. 41, 7397 (2014) Nature Commun. 5, 5199 (2014) Climate Dynamics 44,1567 (2015) J. Climate 28, 1031 (2015) Climate Past 11, 709 (2015) Climate Dynamics (online 2015) Nature Commun. 6, 8502 (2015).")
73
Codes available Unified functional network and nonlinear time series analysis for complex systems science: The pyunicorn software package, CHAOS 25, 113101 (2015) https://github.com/pik-copan/pyunicorn Causal network identification: Python software script by J. Runge http://tocsy.pik-potsdam.de/tigramite.php

74
Complex systems science promising approach in climate science, mitigation and adaptation But in its infancy – many open problems large room for new research - new basic phenomena - new techniques - challenging application Summary

Similar presentations


 General interests What about Chaos interests you the most?>")


