Download presentation
Presentation is loading. Please wait.

1
Interacting Climate Networks Potsdam Institute for Climate Impact Research & Institut of Physics, Humboldt-Universität zu Berlin & King‘s College, University of Aberdeen juergen.kurths@pik-potsdam.de Jürgen Kurths http://www.pik-potsdam.de/members/kurths/

2
System Earth

3
System Earth Subsystem: Climate

4
Network Reconstruction from a continuous dynamic system (structure vs. functionality) New (inverse) problems arise! Is there a backbone underlying the climate system?
 New (inverse) problems arise. Is there a backbone underlying the climate system .")
5
1st Step 2D: Analysis of Earth´s Surface - Temperature Data

6
Climate Networks Observation sites Earth system Time series Climate network Network analysis

7
Infer long-range connections – Teleconnections

8
Earth is 3D 2nd Step: Include Different Layers of the Atmosphere

9
Analysing the vertical dynamical structure of the Earth´s atmosphere Data: pressure data at 17 different geopotential heights Challenge: how to describe such interacting networks? – Network of Networks (EPJ B 2011)
.")
11
Network of networks -Links inside a subnetwork - Links between different subnetworks -New measures: cross-degree, cross- clustering, cross- pathways…

12
Modified Measures Cross-average path length L ij – average length of shortest paths between two subnetworks G i and G j Cross-degree centrality k v ij – number of neighbours a node v, which is in G i, has in G j

13
Cross-clustering coefficient C v ij – frequency that two randomly drawn neighbours in G j of node v, which is in G i, are also neighbours

16
Network analysis to identify large scale atmospheric motions and as a visualisation tool

17
Asian Summer Monsoon Influence Indian Summer Monsoon (ISM) on Eastasian Summer Monsoon (EASM) Clim. Dynamics (2012)
.")
19
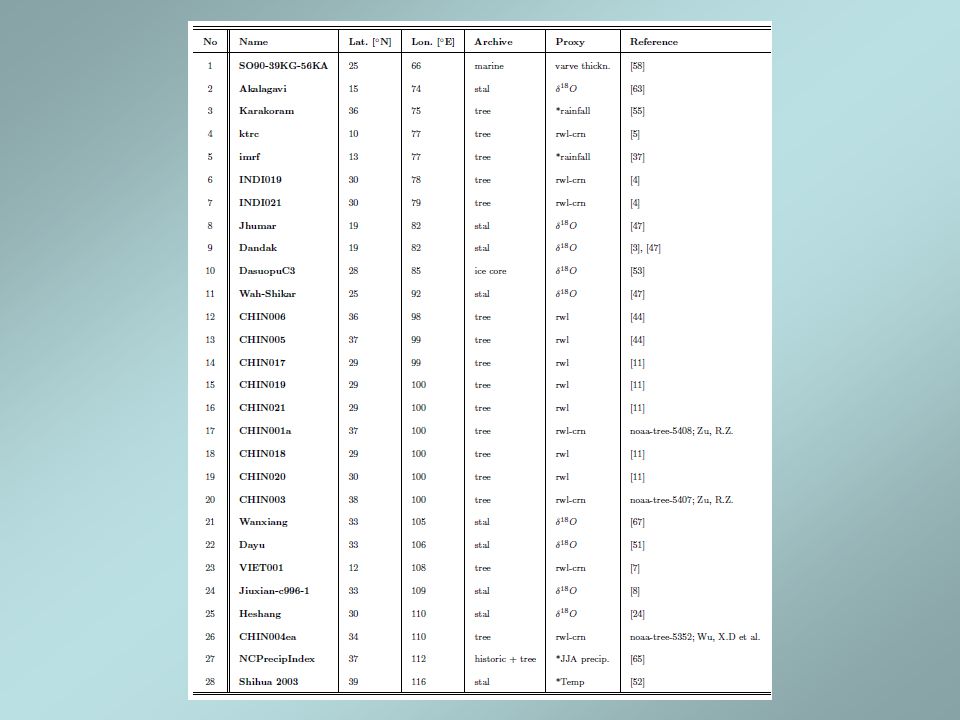
Little Ice Age -ISM weaker -Weaker influence on EASM -Many short connections (inside China) Data White – Stalagmites Orange – Tree rings Pink – Ice core
 Data White – Stalagmites Orange – Tree rings Pink – Ice core")
20
Recent Warm Period -Few short connections -Strong influence of ISM on EASM

21
Recent Monsoonal Rainfall over South Asia Strongest daily local events Method: Event Synchronization and Complex Networks Clim. Dynamics (2011), Europhys. Lett. (2012)
, Europhys. Lett. (2012).")
22
Data Asian Rainfall highly resolved observational data integration towards the evaluation of water resources (APHRODITE) 1951-2007 Resolution: 55 km Daily data Summer period (JJAS – June - September)
 Resolution: 55 km Daily data Summer period (JJAS – June - September)")
23
Daily rainfall amount for threshold 90% (1951-2007) strong events orographic barriers (Himalaya)
 strong events orographic barriers (Himalaya)")
24
Network construction Event synchronization – m-th strong event occurs at grid positions i and j at time t(m,i) and t(m,j) number of times an event occurs at i after it appears in j strength of event synchronization
 and t(m,j) number of times an event occurs at i after it appears in j strength of event synchronization")
25
Network construction Adjacency matrix

27
Distribution of degree centrality

28
Spatial distribution of the different „components“ of P(k)
")
29
Local clustering coefficient Implies Predictability

30
Conclusions Complex network of networks approach gives (new) insights into the spatio- (temporal) organization of a complex system as climate Helpful vizualization tool but also enables us to identify critical (vulnerable) regions, anomalous behaviour (Monsoon years), to uncover major transport (of moisture), to evaluate predictability of strong events Many open problems from methodological and applied viewpoints
 insights into the spatio- (temporal) organization of a complex system as climate Helpful vizualization tool but also enables us to identify critical (vulnerable) regions, anomalous behaviour (Monsoon years), to uncover major transport (of moisture), to evaluate predictability of strong events Many open problems from methodological and applied viewpoints")
31
Our papers on climate networks Europ. Phys. J. Special Topics,174, 157-179 (2009) Europhys. Lett. 87, 48007 (2009) Phys. Lett. A 373, 4246 (2009) Phys. Rev. E 81, 015101R (2010) New J. Phys. 12, 033025 (2010) Phys. Rev. Lett. 104, 038701 (2010) Geoph. Res. Lett. 38, L00F04 (2011) PNAS 108, 202422 (2011) Europ. Phys. J. B 10797-8 (2011) Climate Dynamics 39, 971 (2012) Europhys. Lett. 97, 40009 (2012) Phys. Rev. Lett. 108, 258701 (2012) Climate Dynamics DOI 10.1007/s00382-012 (2012) Climate Past (in press, 2012)
 Phys. Lett. A 373, 4246 (2009) Phys. Rev. E 81, R (2010) New J. Phys. 12, (2010) Phys. Rev. Lett. 104, (2010) Geoph. Res. Lett. 38, L00F04 (2011) PNAS 108, (2011) Europ. Phys. J. B (2011) Climate Dynamics 39, 971 (2012) Europhys. Lett. 97, (2012) Phys. Rev. Lett. 108, (2012) Climate Dynamics DOI /s (2012) Climate Past (in press, 2012).")
Similar presentations


, Brian Hoskins.>")


 R. Pastor-Satorras (Barcelona, Spain) A.>")

 spatial inference = prediction temporal inference.>")

 tell us – What are trends in the current observational.>")


