Download presentation
Presentation is loading. Please wait.

1
MODELING OF LINEAR AND NONLINEAR PROPERTIES OF NIGHT-TIME HEART RATE VARIABILITY Mateusz Soliński, Jan Gierałtowski, Jan Żebrowski Faculty of Physics, Warsaw University of Technology, Warsaw, Poland

2
INTRODUCTION heart rate variability (HRV) is a nontrivial signal with a wide spectrum of frequencies and complex fluctuations we can find some interesting models of HRV in the literature proposed by Ivanov et al. (2001), Lin (2002), McSharry et al. (2002) or Kantelhard et al. (2003) the vagal contribution and the sympathetic nervous system, operate on the heart rate in the high frequency (HF) and low frequency (LF) ranges (Parati et al. 2006, Mainardi 2009) however, the majority (ca. 95%) of the signal total power is determined by very low frequency (VLF) and ultra-low frequency (ULF) components HF LF VLF
, Lin (2002), McSharry et al. (2002) or Kantelhard et al. (2003) the vagal contribution and the sympathetic nervous system, operate on the heart rate in the high frequency (HF) and low frequency (LF) ranges (Parati et al. 2006, Mainardi 2009) however, the majority (ca. 95%) of the signal total power is determined by very low frequency (VLF) and ultra-low frequency (ULF) components HF LF VLF.")
3
HYPOTHESES the dominating component of heart rate variability is random

4
HYPOTHESES the dominating component of heart rate variability is random random component is combined with other non-stochastic components e.g., the interaction with breathing

5
HYPOTHESES the dominating component of heart rate variability is random random component is combined with other non-stochastic components e.g., the interaction with breathing sleep architecture has a significant effect on HRV (Kantelhardt et al. 2003)
.")
6
DATA HRV database*: 34 night-time RR time interval series from healthy adults: 6 females, 28 males mean age: 34y (16-54y), Sample frequency: 128 Hz, less than 5% of ectopic beats in each recording Hypnogram-EEG database**: 30 hypnograms derived from complete electroencephalogram (EEG) recordings from healthy adults: 4 female, 26 males mean age: 40.8 y (23-57y) specific sleep phases were identified by a qualified neurologist in 5-min windows with a 20-s offset. * anonymous Holter electrocardiogram (ECG) database of the Institute of Cardiology (Warsaw, Poland) ** database of the Faculty of Psychiatry, Warsaw University of Medicine (Warsaw, Poland)
 database of the Institute of Cardiology (Warsaw, Poland) ** database of the Faculty of Psychiatry, Warsaw University of Medicine (Warsaw, Poland).")
7
REFERENCE MODEL Main features: -generating RR time series using the inverse Fourier transform obtained from a bimodal power spectrum that is a sum of two Gaussian distributions -mechanism switching between the states of sleep and wake P. E. McSharry, G. Clifford, L. Tarassenko, and L. A. Smith, “Method for generating an artificial RR tachogram of a typical healthy human over 24-h,” Comput. Cardiol. 29, 225–228 (2002). with update: P. E. McSharry and G. Clifford, “A statistical model of the sleep-wake dynamics of the cardiac rhythm,” Comput. Cardiol. 32, 591–594 (2005). (for comparison analysis)
. with update: P. E. McSharry and G. Clifford, A statistical model of the sleep-wake dynamics of the cardiac rhythm, Comput. Cardiol. 32, 591–594 (2005). (for comparison analysis).")
8
MODEL DESCRIPTION

9
I. STARTING POINT: MODEL OF HEART RATE VARIABILITY FOR THE DIFFERENT SLEEP STAGES Features: stochastic properties focused on transient correlations, i.e., correlations in the finite segments of the signal in which change occurs gradually or abruptly according to physiological function simulate HRV in different sleep stages

10
I. STARTING POINT: MODEL OF HEART RATE VARIABILITY FOR THE DIFFERENT SLEEP STAGES Main equation: µ - constantk j, y i, - random variables (different distrinution in each sleep stage) baseline periodic component (cardio-respiratory coupling) stochastic compontent Symbols:
 baseline periodic component (cardio-respiratory coupling) stochastic compontent Symbols:.")
11
I. STARTING POINT: MODEL OF HEART RATE VARIABILITY FOR THE DIFFERENT SLEEP STAGES FIG. 1. Hypnogram consisting of cyclic sets of sleep stages as suggested by Kantelhardt et al. (a) and the synthetic RR time series obtained from this concept (b). ab
 and the synthetic RR time series obtained from this concept (b). ab.")
12
II. SYNTHETIC HYPNOGRAM Two features: 1.probabilities of the transitions between all possible pairs of phases 2.probability distribution of phase durations I half of sleep – matrix of probability Sleep stage occurrence [%] Sleep stage LDREMWEXC L -0,4780,0490,0520,422 59,3 D 0,752-0,0000,0170,221 27,6 REM 0,7600,000-0,1190,121 4,9 W 0,0490,0000,89-0,060 5,4 Exc 0,4840,0380,3010,177- 2,7 II half of sleep – matrix of probability Sleep stage occurrence [%] Sleep stage LDREMWEXC L -0,2220,0920,1130,57366,5 D 0,776-0,0200,0410,16310,8 REM 0,6910,003-0,1820,12407,6 W 0,0870,0000,803-0,11012,1 Exc 0,3860,0000,3640,250-3,0 Gamma distribution: light sllep (L), deep sleep (D), REM. Exponential distribution: wake stage (W) Exercise episodes: 30 samlpes per event TABLE I. Probability matrices of transitions between all possible pairs of sleep stages, together with the percent of occurrence of the sleep stages in the complete time series. (based on own ideas)
, deep sleep (D), REM. Exponential distribution: wake stage (W) Exercise episodes: 30 samlpes per event TABLE I. Probability matrices of transitions between all possible pairs of sleep stages, together with the percent of occurrence of the sleep stages in the complete time series. (based on own ideas).")
13
II. SYNTHETIC HYPNOGRAM Two features: 1.probabilities of the transitions between all possible pairs of phases 2.Probability distribution of phase durations Gamma distribution: light sllep (L), deep sleep (D), REM. Exponential distribution: wake stage (W) Exercise episodes: 30 samlpes per event FIG. 2. Real hypnogram obtained from a healthy person (a) and a synthetic hypnogram generated using our model (b). (based on own ideas)
, deep sleep (D), REM. Exponential distribution: wake stage (W) Exercise episodes: 30 samlpes per event FIG. 2. Real hypnogram obtained from a healthy person (a) and a synthetic hypnogram generated using our model (b). (based on own ideas).")
14
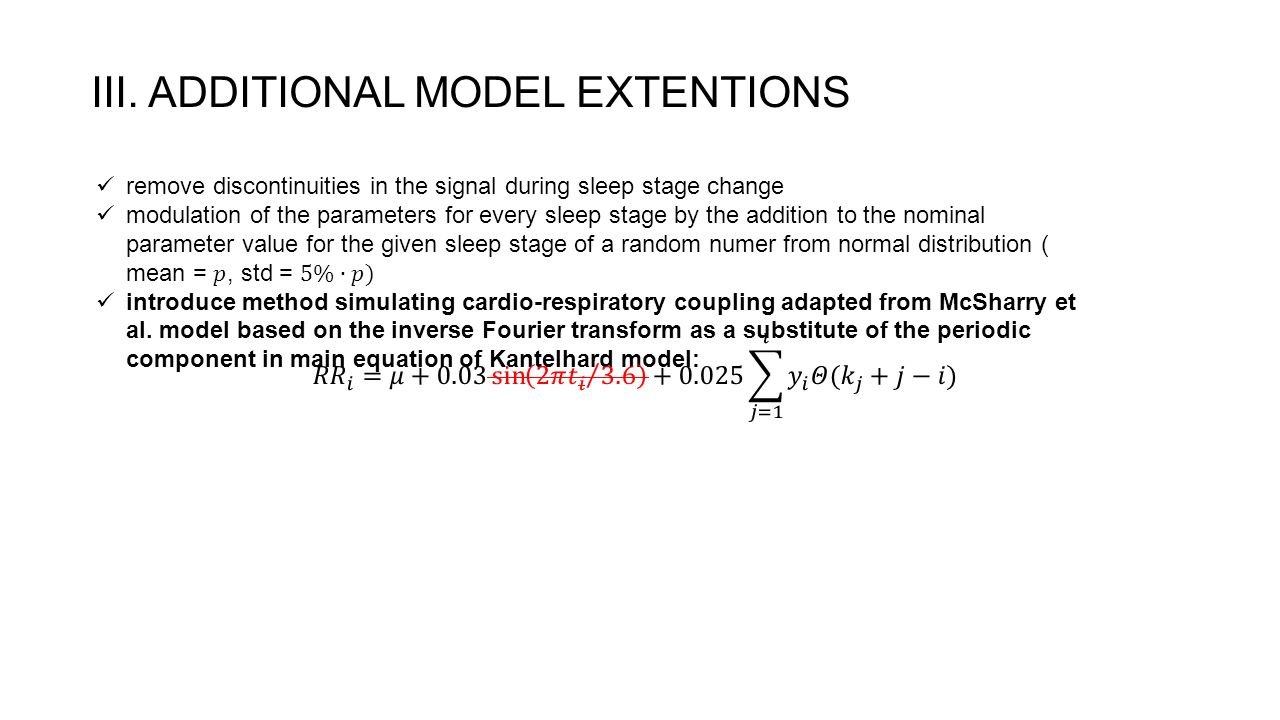
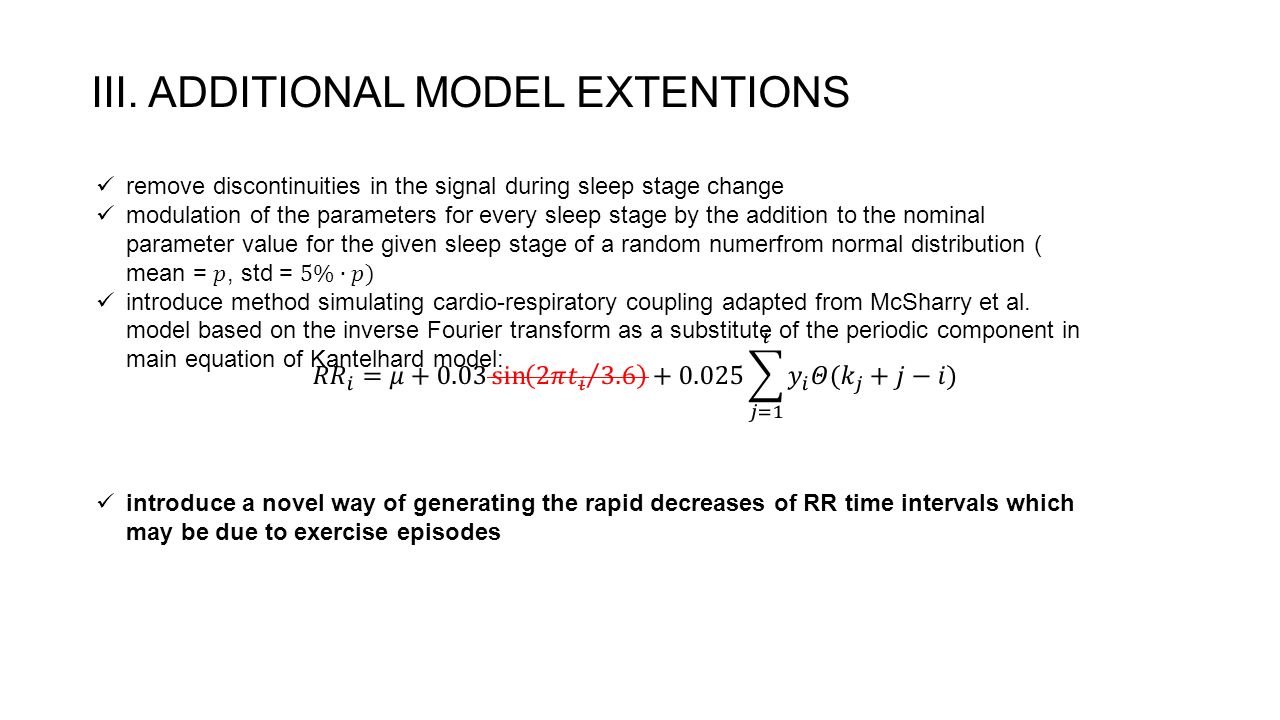
III. ADDITIONAL MODEL EXTENTIONS remove discontinuities in the signal during sleep stage change

15
III. ADDITIONAL MODEL EXTENTIONS

18
introduce of a novel way of generating the rapid decreases of RR time interval lengths which may be due to exercise episodes FIG3. Comparison between the characteristic rapid decreases of the RR intervals observed in real data (a-b) and their synthetic equivalent (c-d).
 and their synthetic equivalent (c-d)..")
19
RESULTS

20
I. TACHOGRAMS FIG4. Tachograms obtained for the real data (a), the RR interval time series from McSharry model (b) and from our model (c). a b c
, the RR interval time series from McSharry model (b) and from our model (c). a b c.")
21
II. STANDARD ANALYSIS Our Model McSharryReal data Mean [ms] 926±10 1138±4 979±87 SD [ms] 99±4 78±2 93±24 RMSSD [ms] 44,9±0,3 51,0±0,9 53±21 pNN50 [%] 12,3±0,2 15,8±0,2 12,0±8 LF/HF 1.7±0.2 1.2±0.1 2.2±1.7 TAB2. Results of standard linear analysis methods in the time domain and LF/HF ratio averaged over 34 RR interval time series generated by our model, the McSharry model and over the set of real RR interval recordings.

22
III. PERIODOGRAMS FIG5. Power spectrum obtained from real data (a), the McSharry model (b) and the synthetic signals generated using our model (c). a b c
, the McSharry model (b) and the synthetic signals generated using our model (c). a b c.")
23
IV. POINCARÉ PLOTS FIG6. Poincaré plots of signals from real data (a), McSharry et al. model (b) and our model (c). a b c
 and our model (c). a b c.")
24
V. AUTOCORRELATION FUNCTION FIG7. Autocorrelation functions calculated for the real dataset (a), McSharry et al. model (b) and our model (c). a b c
, McSharry et al. model (b) and our model (c). a b c.")
25
VI. MULTIFRACTAL MULTISCALE ANALYSIS FIG8. Mean h(q,s) surfaces obtained using the MMA method and calculated from datasets of the real data (a), McSharry et. al (b) and our model (c). 76% surfaces meet MMA criteria 4% surfaces meet MMA criteria
 surfaces obtained using the MMA method and calculated from datasets of the real data (a), McSharry et. al (b) and our model (c). 76% surfaces meet MMA criteria 4% surfaces meet MMA criteria.")
26
DISCUSSION the properties of nighttime RR interval time series are not homogenous but depend strongly on the sleep stage (see also Solinski et al. 2014, Kantelhardt et al. 2002) the autonomic nervous system during sleep exhibits sleep stage specific activity (see also Kantelhardt et al. 2002) manipulating some properties of our model, we were able to control the multifractal properties of the generated signals
 the autonomic nervous system during sleep exhibits sleep stage specific activity (see also Kantelhardt et al. 2002) manipulating some properties of our model, we were able to control the multifractal properties of the generated signals.")
27
DISCUSSION manipulating some properties of our model, we were able to control the multifractal properties of the generated signals FIG. 9. Hurst surfaces for an RR interval time series obtained from our model - all based on the same hypnogram but differing in certain modifications of the model properties. without any modifications effect of breathing variability on HRV is removed exercise episodes are removed

28
SUMMARY We simulate hypnograms one of the strengths of our model is the easy to interpret parameters that define the sleep architecture (i.e., the probability of transitions between the sleep phases) we present a method for simulating healthy human HRV depending on sleep architecture o http://physionet.org/physiotools/mhrv/ http://physionet.org/physiotools/mhrv/ Rapid, short decreases of RR intervals! variation of parameters allows to simulate cases of sleep disorders (e.g., sleep apnea and insomnia) and even impossible or rare structures of sleep architecture, e.g., sleep without REM or deep stage, sleep with many transitions to wake stage, etc., as well model should help in separating the effect of the sleep architecture from the other factors acting on heart rate variability properties
 and even impossible or rare structures of sleep architecture, e.g., sleep without REM or deep stage, sleep with many transitions to wake stage, etc., as well model should help in separating the effect of the sleep architecture from the other factors acting on heart rate variability properties.")
29
THANK YOU FOR ATTENTION!

Similar presentations


,>")
 multidimensional decision function spike output Y(t) x1x1 x2x2 x3x3 f1f1 f2f2 f3f3 Functional models of.>")


