Download presentation
Presentation is loading. Please wait.

1
Building Healthy Communities for Active Aging Kathy Sykes Senior Advisor, U.S. EPA Aging Initiative APHA Annual Meeting November 6, 2007

2
2 Built Environment The built environment, where we live, work, shop and play, has direct and indirect effects on the natural environment and human health.

3
3 Healthy Communities The National Research Council “Identify the collective properties of social and physical environments influence health and disease outcomes”

4
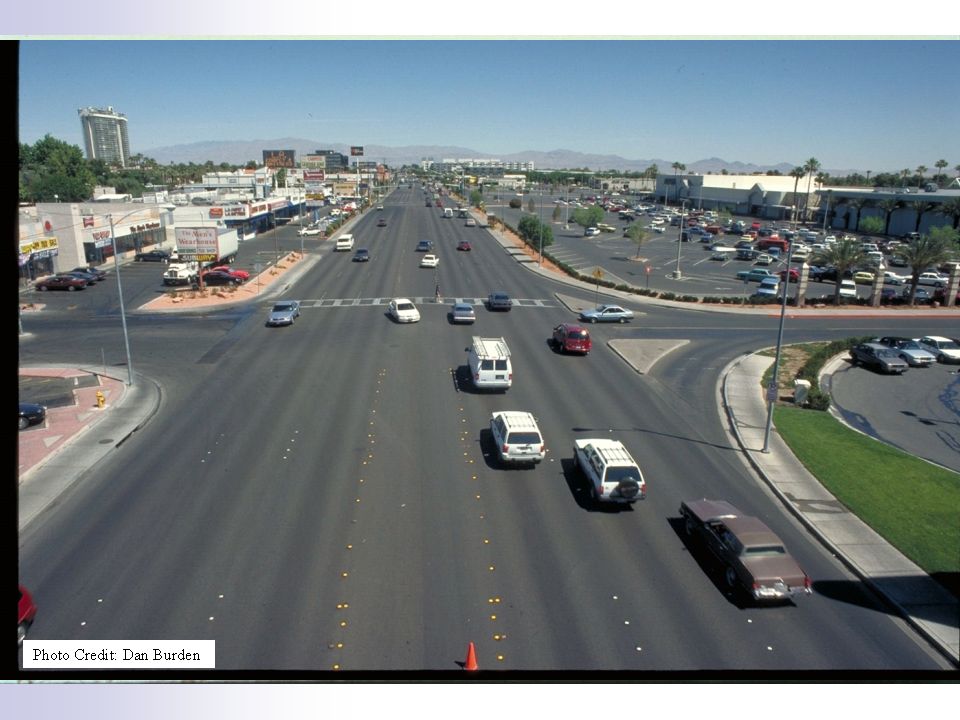
4 Consequences of Sprawl Development patterns can lead to environmental degradation. Impervious surfaces cause storm water runoff to bypass filtration by soil, potentially harming drinking water sources.

5
5 Consequences of Sprawl Increased travel distances from home to work or medical appointments contribute to greater air pollution. 40% of worst emissions in urban areas are from mobile sources. Transportation sector is the fastest growing contributor of CO 2.

6
6

7
7 Impacts of Growth Patterns Since 1980, the number of miles Americans drive has grown 3 times faster than the population. Spread-out development is the key factor in that rate of growth

8
8 If Sprawling Development continues The projected 59% increase in total miles driven between 2005 and 2030 will overwhelm expected gains from vehicle efficiency and low-carbon fuels.

10
10 Traffic Injuries and Fatalities In 2005, 12% of the total US population were people age 65 and older That year, older adults accounted for 15% of all traffic fatalities and 20% of all pedestrian fatalities. Source:NHSTA

11
11 What is Smart Growth? Characterized by development patterns that create attractive, distinctive, walkable communities that give people of varying age, wealth, and physical ability a range of safe, affordable, convenient choices in where they live and how they get around.

12
12 Smart Growth Principles Mix land uses Take advantage of compact building design Create a range of housing opportunities and choices Create walkable neighborhoods Foster distinctive, attractive communities with a strong sense of place Preserve open space, farmland, natural beauty, and critical environmental areas Strengthen and direct development towards existing communities Provide a variety of transportation choices Make development decisions predictable, fair, and cost effective Encourage community and stakeholder collaboration in development decisions

13
13 Smart Growth Growing smart also ensures that existing resources are used efficiently and that lands and buildings that shape communities are preserved.

14
14 Changing Households With kidsW/out kidsSingle 1960 48%52% 13% 2000 33%67% 26% 2030 27%73% 29% Source: New Partners in Smart Growth meeting in February 2007, a leading expert in the field of smart growth, Arthur Nelson, Co- Director of the Metropolitan Institute, Virginia Tech,

15
15

16
16 QUESTION What can a government and private sector partnership do to encourage healthy communities for older adults?

17
17 Building Healthy Communities for Active Aging

18
18 Building Healthy Communities for Active Aging Raise awareness in communities about the importance of Smart Growth and active lifestyle for older adults. Communities will have the opportunity to assess themselves.

19
19 Supporters of BHCAA AARP Active for Life America Walks Administration on Aging American Medical Association American Public Health Association Atlanta Regional Commission American Society on Aging Council of State and Territorial Epidemiologists Generations United Gerontological Society of America Healthy Aging Network International City/County Management Association International Council of Active on Active Living Local Government Commission Milton H. Erickson Foundation, Inc National Association of Area Agencies on Aging National Blueprint Initiative National Council on Aging National Indian Council on Aging National Recreation and Park Association

20
20 Active Aging Older adults regularly participate in structured and unstructured physical activities. –Activities emphasize increasing endurance, strength, flexibility and balance

21
21 Communities can Promote Active Aging– Taking it to another level Implement a diverse array of physical activity programs Help by making self directed programs more accessible Self-directed programs include walking, biking, fitness trails, etc

22
22

23
23 Indicator 30 - Prescription Drugs

24
24 Aging and Health 88% of persons over 65 yrs of age have at least one chronic health condition. 21% of over 65 have chronic disabilities. In 2006, 34% of person 65+ lived in a county with poor air quality. Sources Bullets 1 and 2: NIA 2000 Bullet 3 : Federal Interagency Forum on Aging Related Statistics 2004

25
25 Economic Burden of Chronic Diseases Heart disease, stroke & chronic lung diseases are exacerbated by air pollution. In 2002, the US spent $250 billion on direct medical costs for these conditions and $9 billion on lost productivity. Source: Morbidity & Mortality: 2002 Chart Book on Cardiovascular Lung & Blood Diseases, NIH,NHLBI, May 2002

26
26 Chronic Diseases Are the leading causes of death and disability in the United States. Account for 70% of all U.S. deaths (1.7 million each year) Are among the most common and costly health problems, they are also among the most preventable. Source: CDC
 Are among the most common and costly health problems, they are also among the most preventable. Source: CDC.")
27
27

28
28 % 65+ Engaging in Physical Activity 2003-2004 22% of population 65+ reported engaging in regular physical activity Physical activity drops off at older ages 30.5% 45-64 27.5% 65-74 19.4% 75-84 8.6% 85+ Source: NHIS- (civilian non-institutionalized pop.) Federal Interagency Forum on Aging Related Statistics. Older Americans 2006: Key Indicators of Well-Being. Washington, DC:

29
29 Costs of Inactivity In 2000, the estimated cost of inactivity: $77 M 38% of Americans age 55 + are sedentary 50% of women age 75+ engage in no physical activity Source: CDC

30
30 Engineering Walking Back into our Lives Walking and jogging trails most important amenity for older adults when buying a home Source: National Association of Homebuilders

31
31 Smart Growth can Build Healthy Communities that promote Active Aging Provide environmental benefits – Less air pollution – Less water pollution – Less sprawl – Less traffic – More open space Promote physical activity – More opportunities to walk – More bike lanes – Better access to parks, trails, and recreational areas

32
32 Building Healthy Communities for Active Aging 1.Our community has defined goals or a mission for advancing or applying *smart growth principles. Not at all Partially Completed Fully Completed

33
33 Building Healthy Communities for Active Aging 2. Our community’s governing body has conducted or commissioned a *community assessment for applying *smart growth principles. Not at all Partially Completed Fully Completed

34
34 Building Healthy Communities for Active Aging 3. Our community has defined goals or a mission for increasing older adult participation in *active aging/physical activity. Not at all Partially Completed Fully Completed

35
35 Building Healthy Communities for Active Aging 7. Our community is actively engaged in formulating plans and strategies for specifically linking smart growth initiatives with programs, amenities or opportunities that include active aging/physical activity for older adults

36
36 Building Healthy Communities for Active Aging 10. Our community has created pilot programs, or has existing programs for active aging/ physical activity for older adults which take advantage of the resources and environments created by local smart growth activities such as safe walking area, biking amenities, age- sensitive exercise trails, safe parks, etc.

37
37 Building Healthy Communities for Active Aging 20. Our community has an existing model program integrating active aging/physical activity and smart growth for older adults and we can provide technical assistance and a contact person to share information with other communities.

38
38

39
39

40
40 Assessing Walkability www.walkscore.com Calculates score for address based on availability of goods and services (grocery stores, pharmacies, libraries, restaurants) www.feetfirst.org Walking audits
 Walking audits")
41
41 Other Resources Global Age-friendly Cities: A Guide WHO, Oct. 2007 http://www.who.int/ageing/publications/Glob al_age_friendly_cities_Guide_English.pdfhttp://www.who.int/ageing/publications/Glob al_age_friendly_cities_Guide_English.pdf Growing Cooler: Evidence on Urban Development and Climate Change http://sgusa.convio.net/site/DocServer/Executive _Summary.pdf?docID=4021 http://sgusa.convio.net/site/DocServer/Executive _Summary.pdf?docID=4021

42
42 Aging Initiative Resources & Monthly List Serve EPA Aging Initiative www.epa.gov/aging Building Healthy Communities for Active Aging www.epa.gov/aging/bhc/awards/

Similar presentations