Download presentation
Presentation is loading. Please wait.

1
Ecosystem Unit

2
Objectives Describe an ecosystem and its components Illustrate the E flow through a system Identify biotic and abiotic things Distinguish between the different biomes Create a food chain and web Understand earth cycles (C, N, etc.) Explain what a keystone spp is and its job
 Explain what a keystone spp is and its job")
3
Words to know Ecosystem Biotic Abiotic Biome Food chian Keystone spp

4
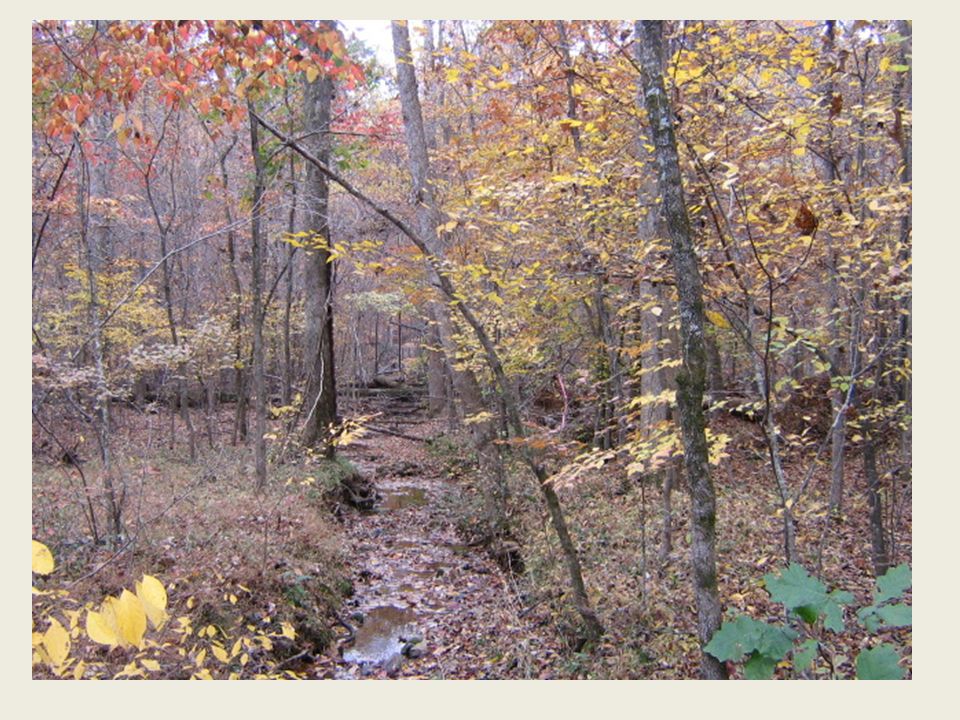
Ecosystems Ecosystem: An area containing an interaction of living and non-living factors in an area/region Example ecosystems: – Porcupine Mts. in MI – Forests of WI – Outer banks coastal water ecosystem – Sand Lake ecosystem

5
Ecosystem

8
Gaia Hypothesis

9
What is in an Ecosystem? Abiotic Factors: The non-living parts of an ecosystem – Rocks, soil, temperature, gases in the air, light Biotic Factors: The living parts of an ecosystem – Plants, animals, bacteria, fungus Producers: use light to make their own energy Consumers: eat other organisms to obtain energy Decomposers: break down dead organisms for energy

10
Biotic Humans Bacteria Fungus Plants Insects Amphibians Reptiles Mammals Birds Abiotic Water Soil Wind or Air Gases – oxygen, carbon dioxide, nitrogen Temperature Sunlight pH – Acid or base

11
Abiotic or Biotic? Biotic (plant) Abiotic (rainwater)
 Abiotic (rainwater)")
12
Abiotic or Biotic? The air temperature is 45 degrees F = The soil is made of rocks and minerals = A bird lays eggs = Bacteria break down dead organisms = The pH or the water is 2 (acidic) =abiotic abiotic abiotic biotic biotic
 =abiotic abiotic abiotic biotic biotic.")
13
Which of the following is a relationship between abiotic and biotic factors? A) The rain on an open field washes away soil B) A hawk hunts a mouse and swoops down into the forest for the kill C) A lake has very acidic water which causes many fish populations to die D) A deer grazes in a field of grasses Abiotic Biotic
 The rain on an open field washes away soil B) A hawk hunts a mouse and swoops down into the forest for the kill C) A lake has very acidic water which causes many fish populations to die D) A deer grazes in a field of grasses Abiotic Biotic.")
14
Ecosystems Biodiversity Change

15
Members of an Ecosystem Producer- all autotrophs (plants), they trap energy from the sun Bottom of the food chain 6CO 2 + 6 H 2 O + solar E → C 6 H 12 O 6 + 6O 2
, they trap energy from the sun Bottom of the food chain 6CO H 2 O + solar E → C 6 H 12 O 6 + 6O 2")
16
Members of an Ecosystem Consumer- all heterotrophs: they ingest food containing the sun’s energy Herbivores Carnivores (2° and 3 °) Omnivores Decomposers Detritus feeders
 Omnivores Decomposers Detritus feeders")
17
Members of an Ecosystem Herbivores – Eat plants Primary consumers Prey animals

18
Members of an Ecosystem Carnivores -eat meat -Predators – Hunt prey animals for food Secondary consumers

19
Members of an Ecosystem Carnivores - eat meat Scavengers – Feed on carrion, dead animals tertiary consumers

20
Members of an Ecosystem Consumer- Omnivores -eat both plants and animals

21
Members of an Ecosystem Consumer- Decomposers Breakdown the complex compounds of dead and decaying plants and animals into simpler molecules that can be absorbed

22
Members of an Ecosystem Detritus feeders Earthworms, some insects, vultures Little waste Aerobic respiration

23
Main Structural Components of an Ecosystem (E, chem, organisms) Chemical nutrients (CO 2, O, N, minerals) Solar E Producers (plants) Decomposers (bacteria, fungi) Consumers (plant eaters, meat eaters) Heat
 Chemical nutrients (CO 2, O, N, minerals) Solar E Producers (plants) Decomposers (bacteria, fungi) Consumers (plant eaters, meat eaters) Heat")
24
Abiotic or Biotic? Biotic Abiotic

25
Feeding Relationships There are 3 main types of feeding relationships 1. Producer- Consumer 2. Predator- Prey 3. Parasite- Host

26
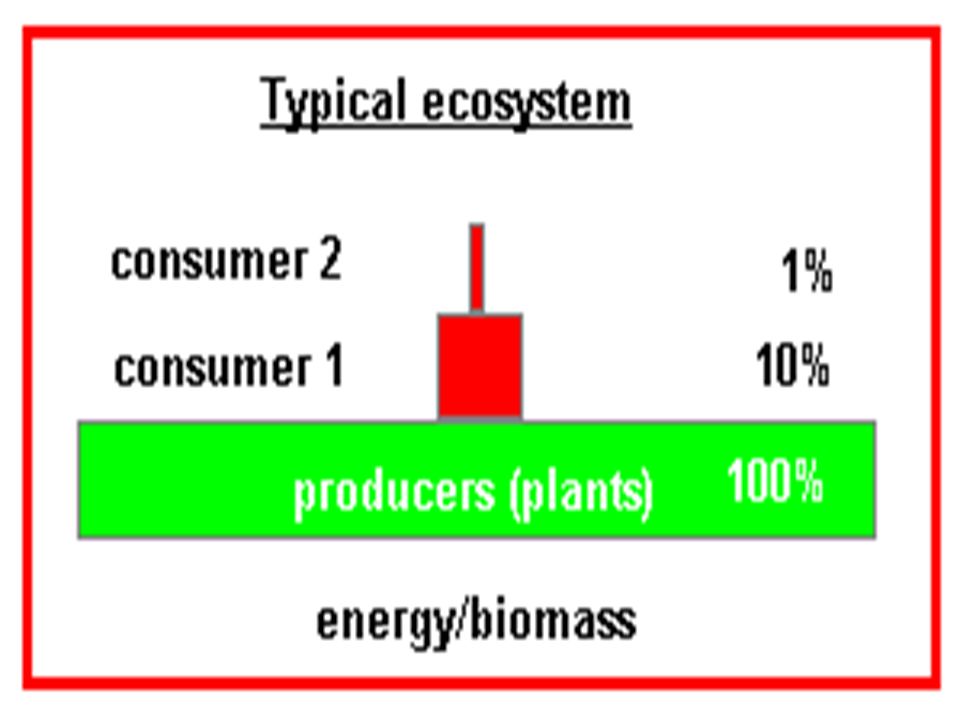
Trophic Levels Each link in a food chain is known as a trophic level. Trophic levels represent a feeding step in the transfer of energy and matter in an ecosystem.

27
Trophic Levels Biomass- the amount of organic matter comprising a group of organisms in a habitat. As you move up a food chain, both available energy and biomass decrease. Energy is transferred upwards but is diminished with each transfer.

28
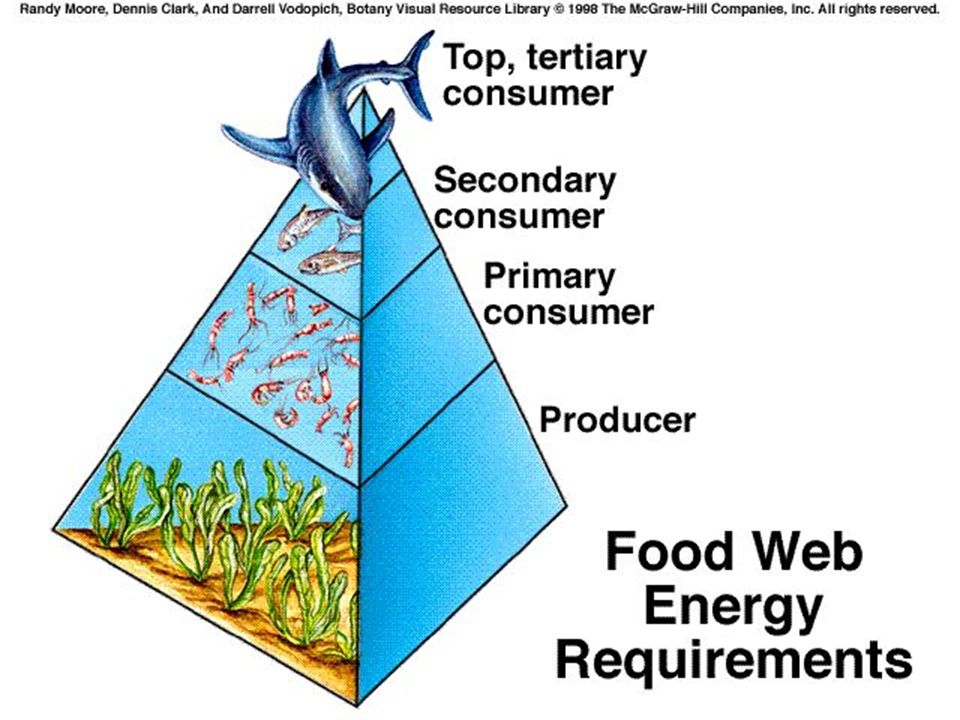
Trophic Levels Producers- Autotrophs Primary consumers- Herbivores Secondary consumers- small carnivores Tertiary consumers- top carnivores ENERGYENERGY

29
Why is a vegetarian diet more E efficient than a meat-based diet? E is lost Higher up= less E Eat a lower trophic level??

32
Trophic Levels Food chain- simple model that shows how matter and energy move through an ecosystem

34
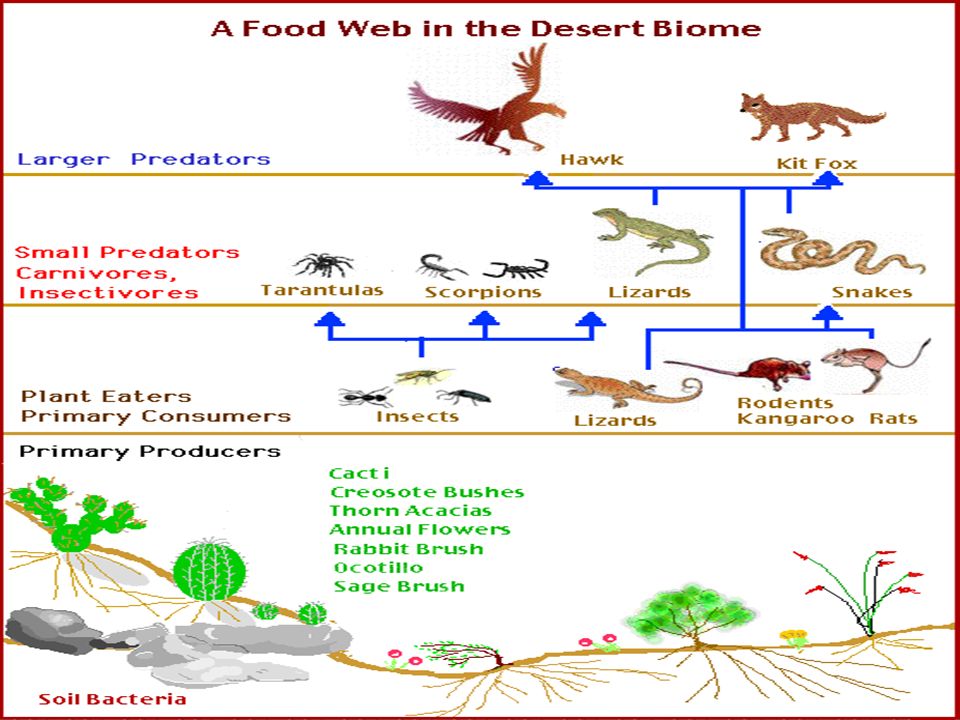
Trophic Levels Food web- shows all possible feeding relationships in a community at each trophic level Represents a network of interconnected food chains

35
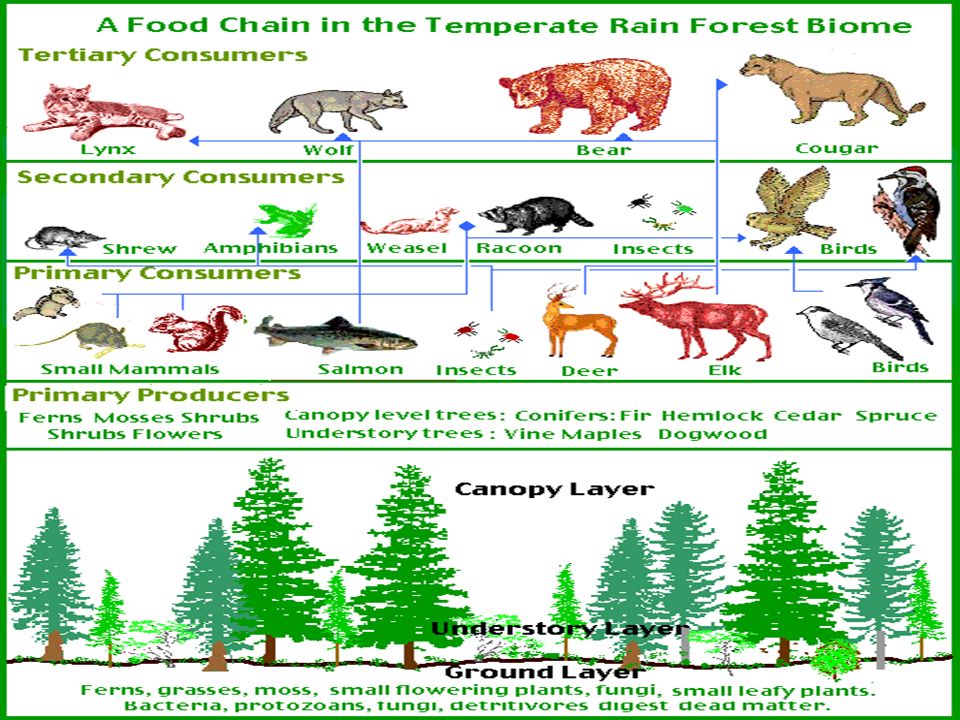
FOOD CHAINS AND FOOD WEBS - illustrate the flow of energy in an ecosystem *Note the direction of the arrows, they indicate where the energy is going when one organism consumes another. Each step in a chain or web is called a TROPHIC LEVEL

36
Identify: Primary Consumers Secondary Consumers Tertiary Consumers Find the Omnivore.

37
Ecological Pyramids (fig 3-9) Energy Pyramid Biomass Pyramid Pyramid of Numbers
 Energy Pyramid Biomass Pyramid Pyramid of Numbers")
38
Food chainFood web (just 1 path of energy) (all possible energy paths)
 (all possible energy paths)")
43
Nutrient Cycles Cycling maintains homeostasis (balance) in the environment. 3 cycles to investigate: 1. Water cycle 2. Carbon cycle 3. Nitrogen cycle 4. Phosphorus 5. Sulfur

44
Water cycle- Evaporation, transpiration, condensation, precipitation

45
Water cycle-

46
Carbon cycle- Photosynthesis and respiration cycle carbon and oxygen through the environment.

47
Carbon cycle-

48
Nitrogen cycle- Atmospheric nitrogen (N 2 ) makes up nearly 78%-80% of air. Organisms can not use it in that form. Lightning and bacteria convert nitrogen into usable forms.

49
Nitrogen cycle- Only in certain bacteria and industrial technologies can fix nitrogen. Nitrogen fixation-convert atmospheric nitrogen (N 2 ) into ammonium (NH 4 + ) which can be used to make organic compounds like amino acids. N 2 NH 4 +
 into ammonium (NH 4 + ) which can be used to make organic compounds like amino acids. N 2 NH 4 +.")
50
Nitrogen cycle- Nitrogen-fixing bacteria: Some live in a symbiotic relationship with plants of the legume family (e.g., soybeans, clover, peanuts).
.")
51
Nitrogen cycle- Some nitrogen-fixing bacteria live free in the soil. Nitrogen-fixing cyanobacteria are essential to maintaining the fertility of semi-aquatic environments like rice paddies.

53
Atmospheric nitrogen Lightning Nitrogen fixing bacteria Ammonium Nitrification by bacteria NitritesNitrates Denitrification by bacteria Plants Animals Decomposers Nitrogen Cycle

54
P Cycle

55
S cycle

56
Toxins in food chains- While energy decreases as it moves up the food chain, toxins increase in potency. This is called biological magnification Ex: DDT & Bald Eagles

57
Ecosystem - the community plus the physical factors in an area (rain, light, soil..) Examples: Rotting Log Koi Pond Lake Clump of Dirt A field An old maple tree
 Examples: Rotting Log Koi Pond Lake Clump of Dirt A field An old maple tree")
58
Biomes 6 major biomes – Tropical – Grassland – Desert – Temperate – Taiga – Tundra

59
Tropical Tropical rain forest – Warm temp, adundant rainfall – Lush vegetaion – Animals within thick cover, vocal

60
Grassland Tropical Grassland Warm throughout year Dry and rainy season Tall grass, scattered trees Gazelles, herbivores Temperate Grassland Dry and warm summer, snow winter Short and tall grasses Animals below ground (dry, windy)
")
61
Desert Dry Cacti nocturnal

62
Temperate Temperate deciduous forest Hot summer cold winter Precip all year Broadleaf forest, deciduous trees lose leaves Temperate rain forest One long wet season, dry summer Evergreen conifers Migration

63
Taiga Long cold winter, short warm humid summer Coniferous Fur coats

64
Tundra Subzero Little precip Permanently frozen, mosses low animal diversity

65
Biome - large area that has a particular climate, and particular species of plants and animals that live there (tundra)
")
66
Biosphere - the part of the earth that supports life

67
Ecological methods - how do we study it? Observing Experimenting Modeling Models are created by humans to make predictions.

68
Sometimes, you must be cautious in how a model interprets data.... Imagine graphing a person's height as they age. One could predict that by the time they were age 30, they would be 22 feet tall. However, the model would need to account for the slowing of growth after adolescence.

Similar presentations


 What is ecology? What are we studying so far in your poster project? 2) What is a producer? What trophic level would you find it.>")


 will grow during succession? First lichens and grasses, then small shrubs and.>")
