Download presentation
Presentation is loading. Please wait.

2
Graphing If a picture is worth a thousand words, a graph is worth a thousand pictures.

3
Pie Charts In a pie chart, the “pie” represents the whole. The pie is divided into different parts based on a characteristic. They usually represent percentages of the whole.

7
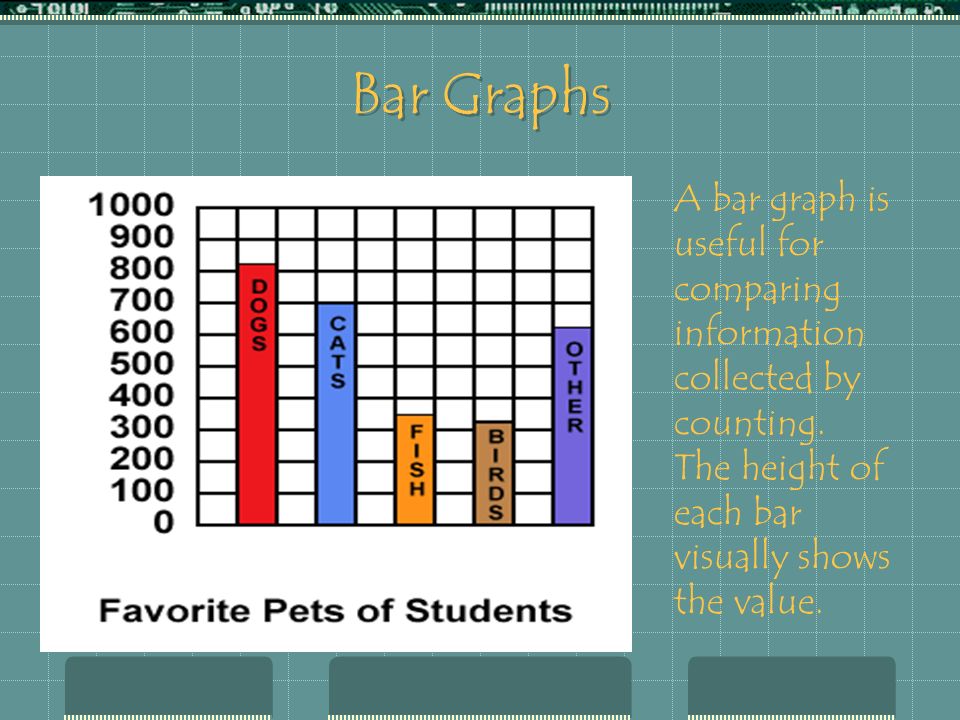
Bar Graphs A bar graph is useful for comparing information collected by counting. The height of each bar visually shows the value.

8
A bar graph can be created sideways or..

10
show negative values

11
or more than one value..

12
or show data in 3 dimensions.

13
Line Graphs Line graphs are used to show trends or changes over time.

14
Independent Variable The independent variable is the factor that the scientist changes or adjusts. It is displayed on the x axis. Often it is time.

15
Dependent Variable The dependent variable is the factor that changes because of the changes in the independent variable. It is shown on the y axis.

16
More than one line can be placed on the same graph for comparison.

19
Pictographs A pictograph is basically a bar graph that uses eye catching symbols.

Similar presentations


 Represents the passage of time and the numerical value of behavior. The Independent.>")


 The Independent Variable. A change in this variable affects the y variable. >")


