Download presentation
Presentation is loading. Please wait.

1
FASD Barnsley Oct 11 Dr Raja Mukherjee
Consultant Psychiatrist / Honorary Senior Lecturer Lead Clinician FASD Behavioural Clinic Surrey and Borders Partnership NHS trust/ St George's university of London

2
1.Fetal Alcohol Syndrome : Confirmed alcohol exposure :
Facial pattern of Short palpebral fissures < / = 10 percentile, Thin upper lip vermillion, Smooth philtrum Evidence of pre / postnatal growth retardation Evidence of Neurocognitive deficits 2Fetal Alcohol Syndrome: No confirmed alcohol exposure As above but no alcohol exposure found 3Partial Fetal Alcohol syndrome: Confirmed Alcohol Exposure Not all of the above features are present but neurocognitive and some facial features needed 4Alcohol Related Birth Defect (ARBD) Confirmed maternal alcohol consumption as well as some but not all of the facial features are present however the behavioural features or structural abnormalities are more pronounced. 5Alcohol Related Neurodevelopmental Disorder (ARND) Confirmed maternal alcohol consumption with the absence of growth retardation or facial features and with the neurocognitive features being prominent. 6 Fetal Alcohol Spectrum Disorders Umbrella term. Not a diagnostic term Other Terms to be discussed later Diagnostic Terms Summary of diagnostic categies and methods. (Stratton 1996 Hoyme 2005).
 Confirmed maternal alcohol consumption as well as some but not all of the facial features are present however the behavioural features or structural abnormalities are more pronounced. 5Alcohol Related Neurodevelopmental Disorder (ARND) Confirmed maternal alcohol consumption with the absence of growth retardation or facial features and with the neurocognitive features being prominent. 6 Fetal Alcohol Spectrum Disorders. Umbrella term. Not a diagnostic term. Other Terms to be discussed later. Diagnostic Terms. Summary of diagnostic categies and methods. (Stratton 1996 Hoyme 2005).")
3
Alcohol as a Teratogen

4
How genetics works Genes Amino - Acids Proteins Organs

5
Amino – Acids coded incorrectly Incorrect Proteins
Abnormal genetics Genes Faulty Amino – Acids coded incorrectly Incorrect Proteins Organs Malformed

6
How a Teratogen has effect
Genes Amino - Acids Teratogen e.g. Alcohol Abnormal Proteins

7
Epigenetics The study of heritable changes in gene function not controlled by changes in the DNA sequence. Epigenetic phenomena play a significant role in development and evolution, and include histone modifications and DNA methylation

8
Example of epigenetic in action in genetically identical mice using the 'agouti viable yellow', or Avy Avy gene has little or no methylation, then it is active in all cells, and the mouse is yellow Avy is highly methylated, it switches off throughout the entire body. This means the mouse is a sooty-brown colour In between these two extremes, Avy can be methylated to varying degrees

9
Incidence and risk

10
Examples of recent prevalence studies using the same methodology
Prevalence Rates /1000 population FAS PFAS FASD S Africa Western cape 2002 59.2 78.6 Italy 2006 6.2 28.0 35.2 Croatia 2010 6.4 34.3 40.8

11
Rates Figure as high as 3.5 % has been quoted in research (may 2006)
We don’t know what is the UK figure Percentage drinking during pregnancy 61% DOH 57% IFS

12
Rates International prevalence This figure is changing
1/1000 FAS 9.1 / 1000 FASD (O’Leary 2003) 1-2 / 100 FASD ( University of Washington 2004) This figure is changing Figure as high as 3.5 % has been quoted in research (may 2006) We don’t know what is the UK figure Percentage drinking during pregnancy 61% DOH 57% IFS
 1-2 / 100 FASD ( University of Washington 2004) This figure is changing. Figure as high as 3.5 % has been quoted in research (may 2006) We don’t know what is the UK figure. Percentage drinking during pregnancy. 61% DOH. 57% IFS.")
13
Note of caution this is assumption and not known
Risk by drinking group Level of Alcohol Consumption Number of Women in group (Millions) Is this true level What should we expect? Note of caution this is assumption and not known Nil 3.1 Low occasional 14.2 Few not as many as figures quoted Above recommend levels 2.6 Possible more but probably not at levels quoted Binge 1.9 Unknown but regular binge drinking high risk and probably higher than figures quoted Moderate – heavy 2.5 Probably higher than figures quoted Heavy 0.6 Higher than figures quoted Totals 24.9 FASD Risk 1/ 100 or FAS 1./1000
 Is this true level What should we expect Note of caution this is assumption and not known. Nil Low occasional Few not as many as figures quoted. Above recommend levels Possible more but probably not at levels quoted. Binge Unknown but regular binge drinking high risk and probably higher than figures quoted. Moderate – heavy Probably higher than figures quoted. Heavy Higher than figures quoted. Totals FASD Risk 1/ 100 or FAS 1./1000.")
14
Relationships Full FAS ARND No identifiable Problem

15
Mukherjee et al JRSM 2006 Gray and Mukherjee JMHLD 2007
How it presents Mukherjee et al JRSM 2006 Gray and Mukherjee JMHLD 2007

16
Reasons for referral Growth problems Behavioural issues
Learning issues Physical problems

17
What do people know Mukherjee, Wray, Hollins, Curfs

18
Themes Lack of knowledge Need for consistent guidance/ Cynicism
Need for education Lack of support services

19
Professional Attitudes
Do you feel you have been generally provided with enough information to acquire knowledge for yourself? (N = 427) N Valid % Yes 176 41.2% No/ Don’t know 251 58.8%
 N. Valid % Yes % No/ Don’t know %")
20
Professional Attitudes
Do you feel you have been generally provided with enough information to advise pregnant mothers safely? (N = 417) N Valid % Yes 115 27.6% No/ Don’t know 302 72.4%
 N. Valid % Yes % No/ Don’t know %")
21
Diagnosis

22
Facial features

23
Comparison: Child with FAS and mouse fetus with fetal alcohol exposure
Mouse fetuses Small head Short palpebral fissures Small nose Small midface Long philtrum; Thin upper lip * alcohol-exposed normal

24
Critical periods and facial features
Normal Alc–Day 7 Alc–Day 8 Fetus Neonate Modified from Sulik et al. Slides Courtesy of Professor E Riley University of San Diego

26
Methods of Diagnosis of facial abnormalities: note all of these require careful history taking and evidence of growth retardation to make the diagnosis (Chudley 2005) Gestalt: Facial pattern recognition requires experience and clear history. Issues of accuracy and inconsistency often found D Score method: computational method for facial pattern based on careful measurements of abnormalities: requires a high degree of training and skill restricting practice to a few. 4 Digit scoring method and Facial photographic recognition software: applies areas of history and facial recognition to four 4-point likhert scales to establish diagnosis. Requires minimal training and can be used easily by all in clinical settings.

27
Comparison between diagnostic Tools
CDC IOM revised Canadian 4 Digit Face 10th percentile PFL and rank 4/5 on lip philtrum 10th percentile PFL and rank 4/5 on lip philtrum 3rd percentile PFL and rank 4/5 on lip philtrum Growth Pre / post natal growth below 10th percentile Neurological 1 out of several brain parameters including OFC <10 %, CNS deficits 1 out of l brain parameters including OFC <10 %, CNS deficits Or abnormal structure 3+ soft hard neurological signs 1 out of several brain parameters including OFC <3 %, CNS deficits Alcohol Confirmed or unknown Confirmed to be excessive or unknown

28
Screening tool Designed and used by Raja Mukherjee

29
Tools to help identify drinking behaviours
First Things First Ethical considerations History and rapport Screening tools MAST Audit-C TACE TWEAK Biomarkers Meconium FFA Hair Sample / Urine analysis Blood Test

30
4 Digit Diagnostic Code Astley and Clarren 96,00,02 4 broad categories
Growth Facial features Brain Alcohol exposure Based on defined criteria giving score each areas and then diagnosis 26 Categories Static encephalopathy A,B,C,E,F, (G,H) relate to FASD diagnoses Caution (requires modification of Alcohol scoring)
 relate to FASD diagnoses. Caution (requires modification of Alcohol scoring)")
31
4- Digit Score and Photographic Software
She hates me for This!!! Forgave me after getting some flowers!

32
4- Digit Score and Photographic Software
Known marker for pixel length Allows Calculation of perameters

33
4- Digit Score and Photographic Software
Known marker for pixel length Allows Calculation of perameters More objective way of discrimination

34
4- Digit Score and Photographic Software
Lip Philtrum Guide from 4 Digit Score Schedule : Astley and Clarren University of Seattle

35
4- Digit Score and Photographic Software
Known marker for pixel length Allows Calculation of perameters More objective way of discrimination Still some subjectivity Gives a range of Scores Combined with other parameters leads to overall score My Wife’s Score : 1212 : P No Physical or CNS abnormalities

36
FAS Child 12

37
ARND Child 15

38
FAS or not? Case 1

39
FAS or not? Case 2 ? Who was exposed to more alcohol case 1 or 2

40
Cause or Effect?

41
Top Down: Phemomenology
Top down or bottom up ? Top Down: Phemomenology Symptoms / Function Bottom Up: Aetiology

42
Cluster of Symptoms Inattention Poor social understanding
Poor Planning Receptive language deficits obsessionality Hyperactivity Cognitive flexibility problems Expressive language deficits Poor imagination Tics Impulsivity Working Memory deficits

43
Cluster of Symptoms: ADHD
Inattention Hyperactivity Impulsivity Poor Planning Tics Cognitive flexibility problems Receptive language deficits Expressive language deficits Poor social understanding Poor imagination obsessionality Working Memory deficits

44
Cluster of Symptoms: ASD
Poor Planning Inattention Cognitive flexibility problems Hyperactivity Impulsivity obsessionality Tics Receptive language deficits Expressive language deficits Poor social understanding Working Memory deficits Poor imagination

45
Cluster of Symptoms: ASD / ADHD
Poor Planning Cognitive flexibility problems Inattention Hyperactivity Impulsivity obsessionality Tics Receptive language deficits Expressive language deficits Poor social understanding Working Memory deficits Poor imagination

46
Cluster of Symptoms: FASD
Working Memory deficits Poor Planning obsessionality Receptive language deficits Inattention Poor social understanding Hyperactivity Cognitive flexibility problems Poor imagination Impulsivity Expressive language deficits Tics

47
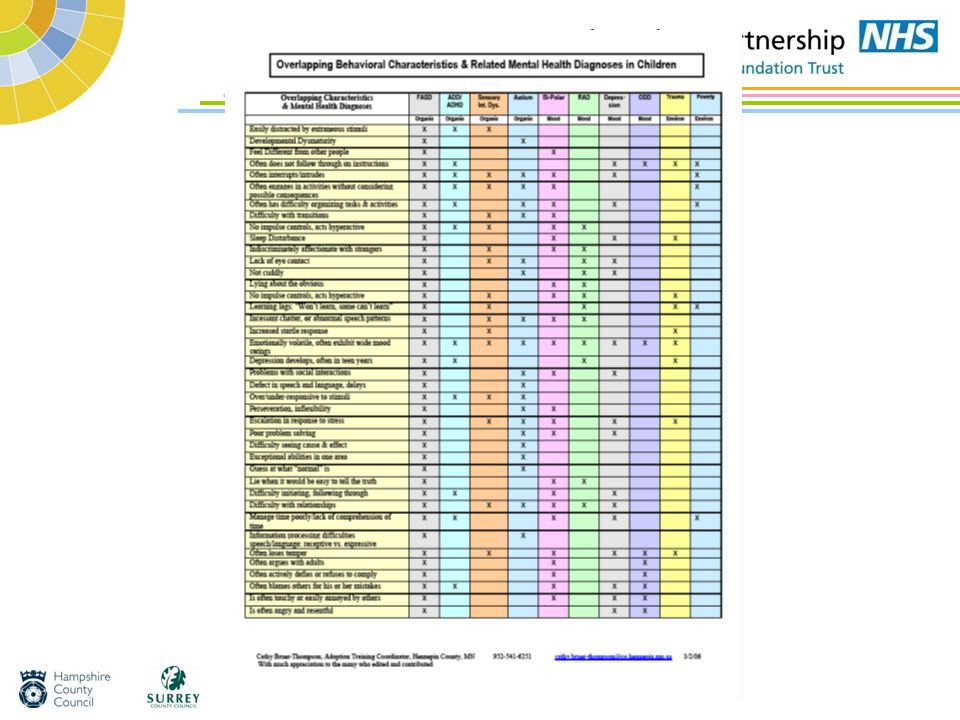
Characteristic vs. Discriminating symptoms 3 Disorders with overlapping symptoms
C = Characteristic: D= Discriminating

49
What is so important about an S?
Fetal alcohol spectrum Disorder Unitary diagnosis Separate from others Fetal Alcohol Spectrum disorders : note the S!! An umbrella term Donates the range of conditions that can be encompassed by the effects of alcohol in utero Becomes a teratogenic aetiological factor causing phenomenological outcomes Not mutually exclusive from current diagnostic criteria

50
Aetiology Vs Phenomenology
Poor social understanding Receptive language deficits Expressive language deficits Poor imagination FASD Fragile X Noonans Downs

51
Common Ground Downs obsessionality Pre Frontal Cortex Inattention
Damage Inattention Hyperactivity Poor social understanding Impulsivity obsessionality Tics Poor Planning Cognitive flexibility problems Poor imagination Noonans Fragile X FASD

52
Relationships ADHD ASD Mental health problems No identifiable Problem
Full FAS ARND

53
DC- LD A Developmental disorders B Psychiatric illness
Developed Faculty of Learning Disability Psychiatry 2001 Multiaxial 1Severity of LD 2Cause of LD 3Psychiatric Disorders A Developmental disorders B Psychiatric illness C Personality Disorders D Problem Behaviours E Other Disorders

54
Multi axial way of thinking!
Level of Functioning Aetiology e.g. FASD Symptoms e .g. Autism Depression

55
F84.0 = 76.2% No ASD = 19.0

56
Type of Social Impairment :From DISCO scoring
Bishop et al: FASD group more likely to initiate social contact Possible correlation with IQ level p=0.005 56 56 56

57
What does it all mean to me?
Management approaches based on pulling all what has been learnt together What does it all mean to me?

58
Impulsivity / Distractibility

59
No Clear statistical link with the
Small numbers between Diagnosis Age IQ Sex

60
Ranking of most difficult behaviours with score of 1.5 Mean on DBC
DBC Parameter Mean Score Easily Distracted 1.95 Over excited 1.86 Impulsive 1.81 Problems with feelings 1.77 Poor sense of danger 1.76 Easily Led 1.75 Poor attention span 1.71 Temper Tantrums 1.70 Impatient 1.65 Irritable 1.61 Tells Lies 1.52 Does not mix with own peer group 1.50 Attention seeking

61
Single item analysis of ADHD diagnostic criteria: inattentive symptoms
Percentage of Group meeting Criteria (n) Total in group (21) Not pay attention 81 (17) Fail to stick at task 76.2 (16) Not listen when spoken to Fail to Finish an instruction 95.2 (20) Difficulties planning 90.5 (19) Avoid areas find difficult Loose things needed for task 85.7 (18) Easily distracted 100 (21) Forgetful
 Total in group (21) Not pay attention. 81 (17) Fail to stick at task (16) Not listen when spoken to. Fail to Finish an instruction (20) Difficulties planning (19) Avoid areas find difficult. Loose things needed for task (18) Easily distracted. 100 (21) Forgetful.")
62
Lobe Analysis * Volume Lobe Frontal Temporal Parietal Occipital
30000 60000 90000 120000 150000 Volume Lobe Controls FAS p = .0003 = .018 = .030 = .0002 * Slides Courtesy of Professor E Riley University of San Diego 62 62

63
Change in cerebellum size
75 80 85 90 95 100 NDFASD FAS < p 0.001 Mattson et al., 1994 Cerebrum Background The image on the left is a normal midsaggital MRI scan of the human brain with the cerebrum and cerebellum pointed out. The data on the right show the reduction in size of the these two areas in children with FAS and PEA. PEA stands for Prenatal Exposure to Alcohol, and includes children with known histories of heavy prenatal alcohol exposure, but who lack the features necessary for a diagnosis of FAS. As can be seen, the extent of reduction in the volume of both the cerebrum and cerebellum is significant. While the PEA group shows a reduction in volume, with these sample sizes, this is not a significant difference. Other brain imaging studies indicate disproportionate size reductions in the basal ganglia, cerebellum, and corpus callosum. The data are presented as percent of normal matched controls. References Mattson, S. N., Jernigan, T. L., & Riley, E. P. (1994a). MRI and prenatal alcohol exposure. Alcohol Health & Research World, 18(1), Archibald, S.L., Fennema-Notestine, C., Gamst, A., Riley, E.P., Mattson, S.N., and Jernigan, T.L. (submitted, 2000). Brain dysmorphology in individuals with severe prenatal alcohol exposure. Cerebellum Corpus Callosum * Slides Courtesy of Professor E Riley University of San Diego 63 63
. MRI and prenatal alcohol exposure. Alcohol Health & Research World, 18(1), Archibald, S.L., Fennema-Notestine, C., Gamst, A., Riley, E.P., Mattson, S.N., and Jernigan, T.L. (submitted, 2000). Brain dysmorphology in individuals with severe prenatal alcohol exposure. Cerebellum. Corpus Callosum. * Slides Courtesy of Professor E Riley University of San Diego")
64
Summary of other research in this area
People with FASD is worse in the visual modality than the auditory. Coles 2002 Executive function in deficit in people with FASD Rasmussen 2005 Not simply related to IQ Not related to dysmorphology Relationship between frontal brain size and maternal alcohol consumption Wass et al 2001, Persutte 2000 Executive functioning not reflective of IQ Connor 2000

65
Executive control of Schemas
Hungry Activating Impulse Orange Action Peel Orange Schema Peel orange schema Supervisory Attention System = EC Norman and Shallice 86

66
Executive control of Schemas
Not Hungry Activating Impulse Orange Action Peel Orange Schema Peel orange schema Norman and Shallice 86

67
Executive control of Schemas
Not Hungry Activating Impulse Orange Action Peel Orange Schema Peel orange schema Norman and Shallice 86

68
Decision making

69
Ranking of most difficult behaviours with score of 1.5 Mean on DBC
DBC Parameter Mean Score Easily Distracted 1.95 Over excited 1.86 Impulsive 1.81 Problems with feelings 1.77 Poor sense of danger 1.76 Easily Led 1.75 Poor attention span 1.71 Temper Tantrums 1.70 Impatient 1.65 Irritable 1.61 Tells Lies 1.52 Does not mix with own peer group 1.50 Attention seeking

70
Active Memory Model Central Executive Long term memory store
Visual spatial Active memory Stored visual spatial information Semantic active memory Stored semantic information Phonological Active memory Stored phonological information

71
Model of relationship between Working memory, Consolidation system and long term memory
Memory Store Working Memory Consolidation system

72
Hippocampal Circuit Entorhinal Cortex -> Dentate Gyrus ->
Subiculum -> Fimbria -> Fornix

73
Examples of other research in this area
Immediate memory worse than long term memory Mattson 2002 Working memory and effects on attention affected by alcohol Burden 2005 GABAa receptors affected by alcohol more likely to be linked to deficits with memory Gibbs 2005 Linked to Executive deficits already shown

74
The frontal lobes, making logical decisions
Frontal Cortex Striatum (caudate & putamen) Globus Pallidus (part of lenticular nucleus) Thalamus Caudate * Accumbens * 70 75 80 85 90 95 100 NDFASD FAS *** * Concordant with animal data Slides Courtesy of Professor E Riley University of San Diego
 Globus Pallidus. (part of lenticular nucleus) Thalamus. Caudate * Accumbens * NDFASD. FAS. *** * Concordant with animal data. Slides Courtesy of Professor E Riley University of San Diego.")
75
White versus gray matter
What is Myelin? Clinically delayed myelination it has been observed Riikonen et al., 1999 alcohol-induced delayed myelination are due to the delayed expression of myelin basic protein (MBP) and transferrin Ozer et al., 2000 Slides Courtesy of Professor E Riley University of San Diego
 and transferrin. Ozer et al., Slides Courtesy of Professor E Riley University of San Diego.")
76
Summary of other research in this area
Prenatal alcohol linked to slower processing speed Burden 2005b Trade off between speed and accuracy Sampson 1997 Problems passing information between hemispheres Roebuck 2002

77
A possible model of Executive function integration
Motor Response Stepping on Brake initiated, Stepping on accelerator inhibited Posterior Association Areas Time 2 Child Crossing Anterior Cingulate Initiating and focusing attention Dorsolateral Pre frontal Cortex Selecting And Monitoring Directory schemas Motivating Reward behaviour Medial Inhibiting Unwanted behaviour Lateral Time 1 Green light Knowledge and action Schemas Orbito Frontal Cortex

78
How the brain organises information
C D E

79
How the brain organises information
C D E Executive Control monitors locates and plans activities

80
How the brain organises information
D A B C E Executive Control monitors locates and plans activities

81
How the brain organises information
Pedestrian crossing How to cross a road C Cars can kill Executive Control monitors locates and plans activities

82
Source Monitoring

83
Individual learns where something is and stores information how items linked
B

84
When asked to recall information the source of the learning is muddled
B

85
How the brain organises information : External Support
Pedestrian crossing C Cars can kill How to cross a road Executive Control monitors locates and plans activities

86
Ways of overcoming memory deficts
Structure and routine Repetition Not expecting people to learn quickly and changing your not their experiences Concrete tasks avoiding ambiguity

87
Mental Health

88
Rates of Autism in other conditions

89
Type of Social Impairment :From DISCO scoring
Bishop et al: FASD group more likely to initiate social contact Possible correlation with IQ level p=0.005 89 89 89

90
Vineland adaptive behaviour schedule: adaptive age scores (n=19) (2 not returned)
Domain Minimum Maximum Average Age 6.10 16.00 9.93 (95%CI) Receptive language 1.1 5.6 3.12 ( ) Expressive language 2.2 13.0 5.23 ( ) Written Language 4.5 14.0 8.73(7.37 – 10.09) Personal Daily living Skills 2.3 8.6 5.62 ( ) Domestic Daily living skills 11 5.61( ) Community skills 3.6 10.6 6.27 (5.30 – 7.24) Interpersonal skills 0.11 10.0 4.2 ( ) Play/ leisure socialisation 1.0 8.0 4.56 (3.56 – 5.56) Coping 1.6 9.6 3.99 ( )
 Receptive language ( ) Expressive language ( ) Written Language (7.37 – 10.09) Personal Daily living Skills ( ) Domestic Daily living skills ( ) Community skills (5.30 – 7.24) Interpersonal skills ( ) Play/ leisure socialisation (3.56 – 5.56) Coping ( )")
91
Secondary Disabilities
Disability % Psychiatric problem 90 Disrupted School experience 60 Trouble with the law Confinement 50 Inappropriate sexual behaviour Alcohol /Drug problems 30 Streissguth et al 1996, 2000

92
Frequency as a % of Psychiatric Diagnoses seen in cohorts of people with FASD
Famy 1997 (n=23) Barr 2006 (n=136?) Total 92 Alcohol / Drug Dependence 60 53.5 Major Depression 44 47.9 Psychotic Disorder 40 1.4 Bipolar 1 20 2.8 Anxiety disorder 33.8 Eating Disorder 16 4.2 PD 48
 Barr 2006 (n=136 ) Total. 92. Alcohol / Drug Dependence Major Depression Psychotic Disorder Bipolar Anxiety disorder Eating Disorder PD. 48.")
93
Where can I go for help?

94
Referral pathways Clinical Genetics (diagnosis only)
FASD Specialist (very few around) Paediatrician Child psychiatry Child Psychology Adult Psychiatry LD Psychiatry Often need to Specify suspected diagnosis
 Paediatrician. Child psychiatry. Child Psychology. Adult Psychiatry. LD Psychiatry. Often need to. Specify. suspected. diagnosis.")
95
FASD Clinic Information leaflets and referral process available
SPECIALST FETAL ALCOHOL SPECTRUM DISORDER CLINIC Information leaflets and referral process available

96
Second European Conference on FASD Fetal Alcohol Spectrum Disorder: Clinical and Biochemical Diagnosis, Screening and Follow-up Barcelona October 2012 Venue: Barcelona Biomedical Research Park, PRBB Av. Dr. Aiguader 88, Barcelona, SPAIN

97
Questions SAVE THE DATE – 13th & 14th October 2011
Launch of UK Professionals Forum on FASD (Foetal Alcohol Spectrum Disorders) Practical guide for those who want to know what to do
 Practical guide for those who want to know what to do.")
Similar presentations


 EUROPEAN PARLIAMENT STRASBOURGH, TUESDAY SEPTEMBER 4 TH 2007 Dr. Kieran D. O’ Malley MB,BAO,BCH, DABPN Consultant.>")


>")
