Download presentation
Presentation is loading. Please wait.

1
Maps of the Mind Memory and Cognition Lecture 9
Recognise this? A realistic map of something that does not physically exist, Tolkien’s middle earth. Something to bear in mind for today, a realistic looking map doesn’t necessarily depict reality. Maps of the Mind Memory and Cognition Lecture 9

2
Cognitive Neuroscience Methods…
Electrophysiological Haemodynamic of seeing inside the box of tricks…

3
Psychophysiology Aim is to develop mind reading technologies
We are most interested in the PPY of Perception and Cognition. In other words, Cognitive Neuroscience Can we tell what a person is thinking or experiencing just by looking at their brain activity?

5
Phrenology Was Odd… There is no known mechanism that would sculpt the contours of the skull according to underlying brain shape i.e. there is no correlation between local contours of the skull and the underlying size or shape of the brain Their psychological ‘model’ was based on common sense constructs of personality I.e. Looking in the wrong place for the wrong thing!

6
But not entirely wrong…
The idea of functional localisation has survived, but in a different form Localisation does not respect character traits, like honesty, peevishness Localisation may respect, for example, sensory modality, ‘cognitive systems’ (e.g. LTM), along with other psychological mechanisms yet to be elucidated
, along with other psychological mechanisms yet to be elucidated.")
7
Acceptable ‘modern’ principles of functional neuroanatomy
Functional Segregation Discrete cognitive functions are localised to specific parts/circuits of the brain (complex tasks are ‘divided and conquered’) Functional Integration Coordinated interactions between functionally specialised areas (e.g. during retrieval from episodic memory, reading, perceptual binding etc)
 Functional Integration. Coordinated interactions between functionally specialised areas (e.g. during retrieval from episodic memory, reading, perceptual binding etc)")
8
Where We At? We want to read a person’s mind from the activity of their brain Their mind is composed of lots of interacting cognitive processes Each distinct process is carried out by networks of brain regions, each region is probably performing specific functions, but they all work together So we need a device or a technique that can detect changes in brain activity specific to any cognitive process

9
So What Do We Need? In an experiment we (think we) engage different functions in different conditions. For every condition we Detect rapid changes in neuronal activity (requires a temporal resolution of milliseconds, 1/100ths of a second) Locate activity within brain structures that are engaged (may require an anatomical (spatial) resolution of millimeters or better) Currently no such technique exists. Instead we rely on converging data from many techniques
 Locate activity within brain structures that are engaged (may require an anatomical (spatial) resolution of millimeters or better) Currently no such technique exists. Instead we rely on converging data from many techniques.")
10
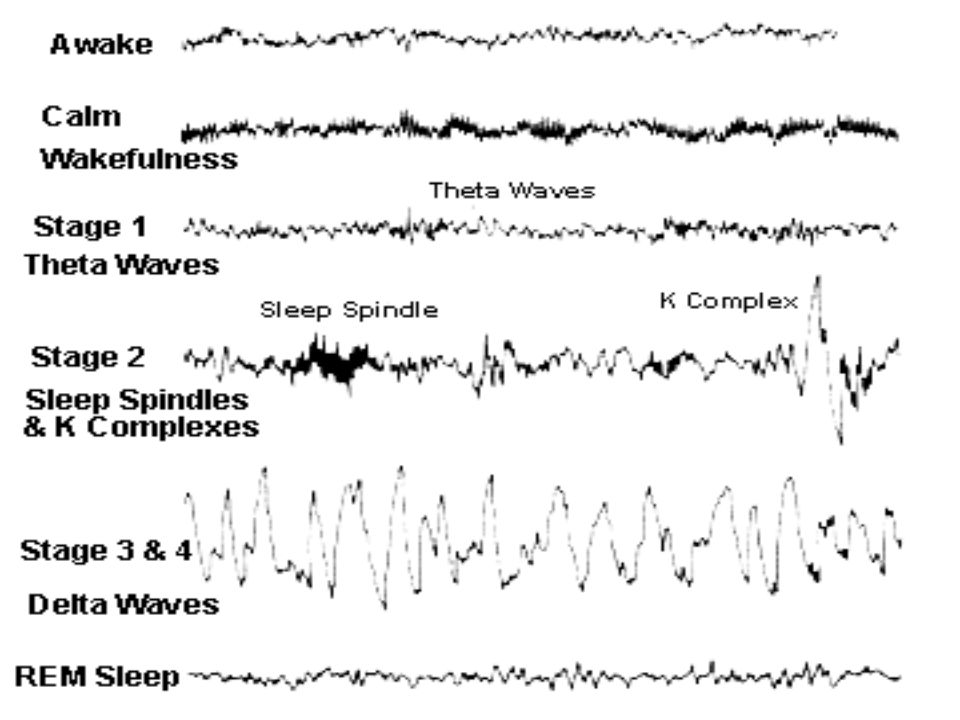
Electrophysiological Techniques
EEG non-invasive recordings from an array of scalp electrodes

12
Averaging EEG produces ERPs
DOG 10uV + - TIME (sec) 2 1 Portions of the EEG time-locked to an event are averaged together, extracting the neural signature for the ‘event’. SHOE AIR Here you can see several individual traces of EEG, associated with a specific class of events, such as the subject reading a series of words. Although there is no specific pattern of brain activity visible in the individual traces, the process of averaging the traces together allows you to see any activity that is consistently present in the resulting ERP for AN EVENT OF THAT TYPE In contrast any random activity that isn’t associated with the event, such as background activity, will be averaged out. Okay, thats how you get an ERP, but what does this tell you about the neural basis for processing? AVERAGE
 Portions of the EEG time-locked to an event are averaged together, extracting the neural signature for the ‘event’. SHOE. AIR. Here you can see several individual traces of EEG, associated with a specific class of events, such as the subject reading a series of words. Although there is no specific pattern of brain activity visible in the individual traces, the process of averaging the traces together allows you to see any activity that is consistently present in the resulting ERP for AN EVENT OF THAT TYPE. In contrast any random activity that isn’t associated with the event, such as background activity, will be averaged out. Okay, thats how you get an ERP, but what does this tell you about the neural basis for processing AVERAGE.")
13
What do ERP waveforms tell us?
CONDITION A + 5uV - CONDITION B INFORMATION ABOUT THE NEURAL BASIS OF PROCESSING IS PROVIDED BY THE DIFFERENCE IN ACTIVITY ONSET OF EVENT What kind of information do ERPs provide? Well, here you can see two hypothetical ERPs recorded from 1 scalp electrode The y axis shows change in voltage. The x axis shows time, with 0 being the point at which each event begins. As you can see, the voltage changes over the time course of the recording, but the waveforms for the 2 conditions only differ in voltage from about half a second after the onset of the event. At around this time the ERP for condition ‘A’ becomes more positive going. This DIFFERENCE in brain activity reflects the difference in processing between the two conditions What this should make clear is that ERPs provide a high level of temporal resolution about processing, as brain activity is measured every few milliseconds. This level of temporal information about the time course of processing, is simply not provided by other neuroimaging techniques. Secondly, if you imagine that the ERPs are recorded from electrodes all over the scalp, it should be clear that ERPs also provide information about the scalp distribution of any differences in brain activity - something I’ll show you later. 1 2 TIME (seconds)
")
14
Functional Inferences Based Upon Electrophysiology
Early Topography Timing Upper limit on time it takes for neural processing to differ Time course of a process (onset, duration, offset) Level at which a process is engaged Engagement of multiple processes at different times or in different conditions Late Topography
 Level at which a process is engaged. Engagement of multiple processes at different times or in different conditions. Late Topography.")
Similar presentations


 = The best functional Account of memory there is… The End (of lecture.>")


 Embedded in the EEG signal is the small electrical response due to specific events such as stimulus or task onsets, motor.>")
 History 2)>")


