Download presentation
Presentation is loading. Please wait.

1
Hotel Industry Analytical Foundations
The SHARE Center Supporting Hotel-related Academic Research and Education

2
Table of Contents Who are the players? Categorizations
Affiliations, Additional Companies Categorizations Geographic, Non-geographic Industry Impact and Issues Benchmarking Comp sets, Reporting Copyright 2011 Smith Travel Research

3
Who are the Players in the Hotel Industry? – Various Hotel Affiliations
Copyright 2011 Smith Travel Research

4
Multiple Affiliations for a Single Hotel
Chain Parent Company Operation: Corporate, Franchise, or Independent Management Company Owner Asset Management Company Membership or Marketing Groups Copyright 2011 Smith Travel Research

5
Chain The Chain represents the hotel brand
This brand is clearly displayed to the public on the building and in all interactions with the customer There are 23 chains in the US with 50,000 rooms or more. WW chains are also available. In some cases, companies organize their hotels by different brands that may not be obvious to the consumer/traveler, i.e.: Hampton Inn vs. Hampton Inn & Suites, Best Western vs. Best Western Plus Copyright 2011 Smith Travel Research

6
Top 23 Chains in the US (by number of rooms)
Properties Rooms Holiday Inn Express 1,733 146,966 Days Inn 1,667 129,092 Marriott 323 127,793 Holiday Inn 660 117,275 Hampton Inn 1,192 113,054 Courtyard 801 112,543 Super 8 1,851 111,300 Comfort Inn 1,419 111,124 Hilton 256 104,517 Best Western* 1,272 97,337 Motel 6 998 97,141 Quality Inn 1,013 88,363 La Quinta Inns & Suites 802 81,690 Residence Inn 597 72,075 Sheraton 185 68,556 Hilton Garden Inn 486 65,844 Best Western Plus 706 63,906 Hampton Inn Suites 591 60,399 Fairfield Inn 665 60,166 Americas Best Value Inn 905 56,067 Doubletree 214 55,572 Hyatt 105 52,612 Ramada 469 51,589 US chains w/ 50,000 rooms or more, * STR identifies Best Western as a Parent Company consisting of 3 chains: Best Western, Best Western Plus, and Best Western Premier Copyright 2011 Smith Travel Research

7
Top 24 Chains in the World (by number of rooms)
Properties Rooms Holiday Inn 1,200 218,887 Best Western 2,917 206,947 Holiday Inn Express 2,130 198,622 Hilton 551 192,046 Marriott 492 177,274 Sheraton 416 145,666 Super 8 2,264 143,428 Days Inn 1,794 140,225 Courtyard 917 135,308 Comfort Inn 1,713 128,216 Hampton Inn 1,231 117,768 Hotel ibis 920 112,183 Crowne Plaza 396 108,481 Quality Inn 1,198 104,495 Motel 6 1,033 99,790 Ramada 757 92,420 Home Inn 785 90,005 Mercure 717 86,750 Best Western Plus 937 83,934 La Quinta Inns & Suites 820 83,329 Residence Inn 619 75,112 Novotel 405 74,691 Hyatt 172 74,443 Hilton Garden Inn 540 74,394 WW Chains with 74,000 rooms or more, notice different chains and different order Copyright 2011 Smith Travel Research

8
Parent Company Parent companies consist of multiple chains
Often the parent company will have a variety of different types of chains A parent company may have a range of high-end, middle, and low-end chains; or they may concentrate in one area There are 20 parent companies in the US with 10,000 rooms or more Copyright 2011 Smith Travel Research

9
Top 20 Parent Companies in the US (by number of rooms)
Parent Company Properties Rooms Hilton Worldwide 3,270 491,621 Marriott Corp 3,035 486,678 Wyndham Worldwide 5,885 455,300 Choice Hotels Intl 5,020 394,680 InterContinental Hotels Group 3,097 374,385 Best Western International 1,989 162,496 Starwood Hotels & Resorts Worldwide 471 148,520 ACCOR 1,070 107,227 Hyatt Hotels Corp 340 90,793 La Quinta Inns 803 81,881 Extended Stay Hotels 682 75,764 Carlson Hospitality 576 64,939 Vantage Hospitality 924 58,481 Westmont Hospitality Group 348 36,215 Americas Best Franchising 268 18,052 Intown Suites Management 138 17,974 Preferred Hotels & Resorts 67 17,346 Drury Hotels 114 16,605 Omni Hotels 39 14,629 AmericInn International 206 11,378 US Parent Companies with 10,000 rooms or more, notice size differences (Starwood vs. Best Western) Copyright 2011 Smith Travel Research
 Copyright 2011 Smith Travel Research.")
10
Top 21 Parent Companies in the World (by number of rooms)
Parent Company Properties Rooms InterContinental Hotels Group 4,485 649,460 Hilton Worldwide 3,816 626,372 Marriott International Inc 3,552 616,758 Wyndham Worldwide 7,219 615,963 ACCOR 4,229 511,301 Choice Hotels Intl 6,139 494,226 Starwood Hotels & Resorts Worldwide Inc 1,065 314,590 Best Western International 4,000 307,922 Carlson Hospitality 1,077 165,129 Hyatt Hotels Corp 244 102,398 La Quinta Inns Inc 821 83,520 Extended Stay Hotels 685 76,264 Vantage Hospitality 968 61,276 NH Hoteles SA 374 55,712 Melia Hotels International 149 47,765 Whitbread PLC 595 45,808 Campanile Nederland BV 589 39,092 Westmont Hospitality Group 369 38,253 Fairmont Raffles Hotels International 99 37,373 Barcelo Gestion Hotelera S.L. 97 30,809 Shangri-La International Hotel Management Ltd 71 30,573 WW Parent Companies with 30,000 rooms or more, notice differences Copyright 2011 Smith Travel Research

11
US Parent Companies and Chains – Hilton and Marriott
Parent Company Chain Scale Properties Rooms Hilton Worldwide Conrad Luxury 3 860 Waldorf Astoria Hotels&Resorts 13 7,172 Embassy Suites Upper Upscale 204 49,579 Hilton 256 104,517 Doubletree Upscale 214 55,572 Hilton Garden Inn 486 65,844 Homewood Suites 298 32,821 Doubletree Club Upper Midscale 8 1,276 Hampton Inn 1,192 113,054 Hampton Inn Suites 591 60,399 Home2 Suites by Hilton 5 527 Marriott Corp JW Marriott 21 12,096 Ritz-Carlton 38 11,346 Autograph Collection 17 5,239 Marriott 323 127,793 Marriott Conference Center 10 3,127 Renaissance 79 28,707 Courtyard 801 112,543 Residence Inn 597 72,075 Springhill Suites 284 33,376 Fairfield Inn 665 60,166 TownePlace Suites 198 19,880 A list of WW Parent Companies and Chains is available Copyright 2011 Smith Travel Research

12
US Parent Companies and Chains – Wyndham and Choice
Parent Company Chain Scale Properties Rooms Wyndham Worldwide Wyndham Hotels Upper Upscale 52 14,681 Ramada Plaza Upper Midscale 33 7,765 Wyndham Garden Hotel 19 3,676 Baymont Inns & Suites Midscale 259 21,701 Hawthorn Suites by Wyndham 73 6,939 Howard Johnson 90 9,868 Ramada 469 51,589 Wingate By Wyndham 162 14,771 Days Inn Economy 1,667 129,092 Howard Johnson Express 219 16,312 Knights Inn 336 21,021 Microtel Inn 302 21,402 Super 8 1,851 111,300 Travelodge 349 24,467 Choice Hotels Intl Ascend Collection Upscale 47 4,252 Cambria Suites 2,215 Clarion 191 27,895 Comfort Inn 1,419 111,124 Comfort Suites 617 47,473 Mainstay Suites 40 3,079 Quality Inn 1,013 88,363 Quality Suites 35 3,398 Sleep Inn 393 28,499 Econo Lodge 798 49,597 Rodeway Inn 388 21,580 Suburban Extended Stay Hotels 60 7,205 Some of these Parent Companies have additional WW Chains Copyright 2011 Smith Travel Research

13
through Midscale, Starwood – Luxury though Upscale)
US Parent Companies and Chains – Intercontinental, Best Western and Starwood Parent Company Chain Scale Properties Rooms InterContinental Hotels Group InterContinental Luxury 24 9,766 Crowne Plaza Upscale 161 45,874 Hotel Indigo 30 3,652 Staybridge Suites 180 19,685 Holiday Inn Upper Midscale 660 117,275 Holiday Inn Express Hotel 1,733 146,966 Holiday Inn Select 8 1,810 Candlewood Suites Midscale 300 29,260 Best Western International Best Western Plus 706 63,906 Best Western Premier 11 1,253 Best Western 1,272 97,337 Starwood Hotels & Resorts Luxury Collection 13 3,920 St Regis 9 2,061 W Hotel 26 8,371 Le Meridien Upper Upscale 7 1,959 Sheraton Hotel 185 68,556 Westin 96 42,740 aloft Hotels 42 6,096 element 1,432 Four Points 84 13,385 Notice scale stratification: IHG – Luxury through Midscale, BW – Upscale through Midscale, Starwood – Luxury though Upscale) Copyright 2011 Smith Travel Research
 Copyright 2011 Smith Travel Research.")
14
US Parent Companies and Chains – Accor, Hyatt, La Quinta, Extended Stay and Carlson
Parent Company Chain Scale Properties Rooms ACCOR Sofitel Luxury Hotels Luxury 8 2,635 Motel 6 Economy 998 97,141 Studio 6 63 6,971 Hyatt Hotels Corp Andaz 4 834 Grand Hyatt 11 8,211 Park Hyatt 933 Hyatt Upper Upscale 105 52,612 Hotel Sierra Upscale 17 2,572 Hyatt Place 161 20,382 Hyatt Summerfield Suites 38 5,249 La Quinta Inns Inc La Quinta Inns & Suites Midscale 802 81,690 Extended Stay Hotels Crossland Suites 34 4,401 Extended Stay America 366 40,535 Extended Stay Deluxe 10,549 Homestead 131 16,728 Studio Plus 46 3,551 Carlson Hospitality Radisson 111 26,494 Park Inn Upper Midscale 9 1,919 Country Inn & Suites 455 36,317 Copyright 2011 Smith Travel Research

15
Operation: Corporate, Franchise or Independent
A corporate hotel is a chain hotel owned/managed by the chain/parent company A franchise hotel is a chain hotel run by a third party where the chain receives some sort of franchise fee An independent hotel is not affiliated with a chain or parent company Operation Properties Rooms Chain – Corporate 4,541 896,550 Chain - Franchise 25,520 2,469,127 Independent 21,893 1,494,662 The Census database includes an Operation field with three codes: 1=Corporate, 2=Franchise, 3=Independent Copyright 2011 Smith Travel Research

16
Top US 20 Parent Companies with Number of Corporate and Franchise Properties
Parent Company Corporate Franchise Hilton Worldwide 285 2,985 Marriott Corp 713 2,322 Wyndham Worldwide 28 5,857 Choice Hotels Intl 5,020 InterContinental Hotels Group 181 2,916 Best Western International 1,989 Starwood Hotels & Resorts Worldwide 137 334 ACCOR 619 451 Hyatt Hotels Corp 203 La Quinta Inns 386 417 Extended Stay Hotels 682 Carlson Hospitality 20 556 Vantage Hospitality 17 907 Westmont Hospitality Group 145 Americas Best Franchising 11 257 Intown Suites Management 138 Preferred Hotels & Resorts 67 Drury Hotels 114 Omni Hotels 37 2 AmericInn International 15 191 Notice some Parent Companies have a high percentage of either Corporate or Franchise hotels (Hyatt vs. Choice) Copyright 2011 Smith Travel Research
 Copyright 2011 Smith Travel Research.")
17
Chain Hotels versus Independents in US & WW Percentages based on Number of Rooms
US vs. Non-US - almost opposite! 2011 Smith Travel Research, Inc. WW percentage (40/60) is based on hotels in STR database, much harder to find WW independents, probably closer to 30/70 or 20/80
 is based on hotels in STR database, much. harder to find WW independents, probably closer to 30/70 or 20/80.")
18
Independent Hotels There are nearly 22,000 independent hotels in the US which consist of nearly 1.5 million rooms. (There are nearly 92,000 independent hotels in the world in the STR database with over 6.7 million rooms.) Independent hotels vary considerably in size, price level, location, amenities and other attributes Independent hotels can be managed or owned by companies listed on preceding pages. They may also be members of various marketing groups Copyright 2011 Smith Travel Research
 Independent hotels vary considerably in size, price level, location, amenities and other attributes. Independent hotels can be managed or owned by companies listed on preceding pages. They may also be members of various marketing groups. Copyright 2011 Smith Travel Research.")
19
Independent Hotels in US – Drill Down
Class (Price Level) Properties Economy 13,901 Midscale 2,781 Upper Midscale 1,834 Upscale 1,589 Upper Upscale 1,259 Luxury 780 Number of Rooms Properties 25 or less 6,158 26-50 8,090 51-75 3,021 76-100 1,622 988 625 375 297 320 171 200 176 Greater than 800 101 Location Properties Urban 2,190 Suburban 5,083 Airport 404 Resort 2,525 Interstate 2,290 Small Town 9,652 Copyright 2011 Smith Travel Research High percentage of independents in Economy Scale, Small Town Location, and in 50 rooms or less Size group
 Properties. Economy. 13,901. Midscale. 2,781. Upper Midscale. 1,834. Upscale. 1,589. Upper Upscale. 1,259. Luxury Number of Rooms. Properties. 25 or less. 6, , , , Greater than Location. Properties. Urban. 2,190. Suburban. 5,083. Airport Resort. 2,525. Interstate. 2,290. Small Town. 9,652. Copyright 2011 Smith Travel Research. High percentage of independents in Economy Scale, Small Town Location, and in 50 rooms or less Size group.")
20
Sample US Independent Hotels
Name City ST Location Rooms Hotel Del Coronado Coronado CA Resort 757 The Broadmoor Hotel Colorado Springs CO 744 The Sebastian Vail Vail 100 Hay Adams Hotel Washington DC Urban 145 Turnberry Isle Miami Aventura FL 408 Fontainebleau Miami Beach Miami Beach 1,504 Delano Hotel 194 The Setai 135 The Breakers Palm Beach 540 The Sea Island Sea Island GA 198 Halekulani Honolulu - Oahu HI 453 Coeur D Alene Resort Coeur D Alene ID 338 Windsor Court New Orleans LA 316 Grove Park Inn Resort Asheville NC 512 The Sagamore Bolton Landing NY 384 The New York Helmsley Hotel New York 773 The Pierre 189 The Mark 147 Hotel Plaza Athenee 142 The Rittenhouse Hotel Philadelphia PA 98 The Peabody Memphis Memphis TN 464 The Greenbrier White Sulphur Springs WV 682 Copyright 2011 Smith Travel Research Random sample of independents in “Luxury Class” group, WW examples are available

21
Management Company A management company operates a hotel for another party The company has a management contract where it receives payment and/or some portion of profits There are 26 management companies in the US with 7,500 rooms or greater Some chains or parent companies manage their own hotels Management companies may manage a variety of different brands Copyright 2011 Smith Travel Research

22
Top 26 US Management Companies (by number of rooms)
Mgt Company Properties Rooms Starwood Hotels & Resorts 141 68,754 MGM Resorts 18 47,682 Caesars Entertainment 32 41,704 InterContinental Hotels 191 37,625 Interstate Hotels 83 26,603 Crossroads 210 25,886 White Lodging 156 23,447 Pillar Hotels & Resorts 232 23,282 Columbia Sussex 49 20,870 Highgate Hotels 33 18,042 The Procaccianti Group 56 14,872 Ocean 84 13,746 Davidson Hotel Company 48 13,637 GF Management 90 13,226 Remington Hotels 66 13,180 Aimbridge Hospitality 65 12,765 HEI Hotels and Resorts 40 11,053 Sage 53 10,931 Rim Corporation 80 10,903 John Q Hammons 43 10,544 Boyd Gaming 13 9,554 Noble Investment Group 51 9,455 Hersha Hospitality Management 73 9,345 Kimpton Hotel Group 44 8,336 Crescent Hotels & Resorts 38 8,110 Fairmont Hotels & Resorts 17 7,763 US Management companies with 7,500 rooms or more, WW examples are available Copyright 2011 Smith Travel Research

23
Owner Companies There are many companies that own multiple hotels
There are 23 owner companies in the US with 10,000 rooms or greater Some chains or parent companies own their own hotels Owners may own hotels from a variety of different brands Copyright 2011 Smith Travel Research

24
Top 23 US Owner Companies (by number of rooms)
Properties Rooms Accor North America 640 72,620 Host Hotels & Resorts 105 60,658 MGM Resorts 18 47,682 Hospitality Properties Trust 283 41,478 Caesars Entertainment 29 39,653 Archon Hospitality 346 37,103 Clarion Partners 174 25,567 Walt Disney World Resorts 19 23,865 FelCor 78 22,510 Ashford Hospitality Trust 98 21,488 R L J Lodging Trust 140 20,794 Inland American Lodging Group 101 16,424 Morgan Stanley Real Estate 35 15,247 Tharaldson Lodging 200 13,566 JER Partners 164 13,548 Highgate Hotels 23 13,535 Cornerstone 39 13,095 Apple REIT Nine 12,317 Sunstone Hotel Investors 32 12,272 The Procaccianti Group 46 12,064 DiamondRock Hospitality Comp 25 11,326 Omni Hotels 11,109 Atrium 43 10,544 Owners with 10,000 rooms or more, WW examples are available Copyright 2011 Smith Travel Research

25
Asset Management Company
An Asset Management Company represents the owner in the operation of a hotel A hotel may have both a Management Company and an Asset Management Company There are 25 Asset Management Companies in the US with 1,000 rooms or greater Copyright 2011 Smith Travel Research

26
Top 25 US Asset Management Companies (by number of rooms)
Asset Mgt Company Properties Rooms Pyramid Advisors, LLC 66 25,363 Capital Hotel Management 18 12,304 The Chartres Lodging AssetMgt 13 9,840 IStar Financial 19 8,531 Garfield Taub Development 7,946 Host Hotels & Resorts AssetMgt 53 7,611 Sceptre 22 6,740 BetaWest 23 4,653 Woodbine Development Corp 7 3,561 Omni Hotels AssetMgt 10 3,456 S C S Advisors AssetMgt 8 3,409 Hotel Asset Value Enhancement 11 3,052 Lodging Capital Partners, LLC 2,992 TR Engel Group, LLC 3 2,231 Wright Hotels, Inc AssetMgt 2 1,599 Millennium Partners 5 1,549 GF Management AssetMgt 1,513 Supertel Hospitality AssetMgt 1,354 CHIC Advisors 1,352 Red Lion Hotels 1,242 Bentall Kennedy 4 1,125 Integrated Capital LLC 1,083 TriMont Real Estate Advisors 1,080 Carr Hospitality 1,035 Ashford 1,030 Asset management companies with 1,000 rooms or more Copyright 2011 Smith Travel Research

27
Membership and Marketing Groups
Hotels can be members of various organizations that provide additional benefits These groups may provide marketing assistance They may provide reservation services They may have a focus on certain types of hotels There are several memberships groups that STR currently tracks Copyright 2011 Smith Travel Research

28
Top US Membership Groups
Properties Rooms Magnuson 1,300 71,814 Historic Hotels Of America 237 45,334 Preferred Lodging 120 28,422 Leading Hotels 40 16,541 World Hotels 39 12,945 K Hotels 27 6,471 Carino Hotels & Resorts WW 25 6,110 Summit 31 5,746 Sterling Hotels 18 4,916 Luxe Hotels 46 4,458 Small Luxury Hotels 38 2,575 AHMI - RES Hotel 11 2,384 Design Hotels 6 929 Grand Tradition Hotels & Resorts 5 874 Avantgarde Hotels 4 773 Epoque 611 Copyright 2011 Smith Travel Research Membership groups 500 rooms or more; there are additional WW groups

29
Questions Review the six different types of players in the lodging industry What are some reasons that all these players exist? Why do parent companies create multiple brands? What are the advantages and disadvantages of having so many different players in the hotel industry? Contrast independent versus chain hotels in and outside of the US Copyright 2011 Smith Travel Research

30
Who are the Players? – Additional Companies and Organizations
Copyright 2011 Smith Travel Research

31
Convention and Visitor Bureaus and Local Tourism Organizations
Most cities and states have organizations that serve hotels and promote tourism STR provides Destination Reports to nearly 500 different organizations in the US These organizations may have different names: CVBs, Local Hotel Associations, Travel or Tourism Organizations, or Destination Marketing Organizations (DMOs) Copyright 2011 Smith Travel Research
 Copyright 2011 Smith Travel Research.")
32
Hotel-related Associations
There are many large associations that represent the interests of hotels: American Hotel and Lodging Association (AHLA) US Travel Association (US Travel) Hospitality Sales and Marketing Association Int’l (HSMAI) Hospitality Financial & Technology Professionals (HFTP) Tourism and Travel Research Association (TTRA) Destination Marketing Association Int’l (DMAI) American Resort Development Association (ARDA) Copyright 2011 Smith Travel Research
 US Travel Association (US Travel) Hospitality Sales and Marketing Association Int’l (HSMAI) Hospitality Financial & Technology Professionals (HFTP) Tourism and Travel Research Association (TTRA) Destination Marketing Association Int’l (DMAI) American Resort Development Association (ARDA) Copyright 2011 Smith Travel Research.")
33
Additional Associations
There are other associations that represent specific groups of hotel professionals: Hotel Asset Management Association (HAMA) Global Business Travel Association (GBTA) Association of Corporate Travel Executives (ACTE) International Society of Hospitality Consultants (ISHC) Industry Real Estate Financing Advisory Council (IREFAC) Hotel Electronic Distribution Network Assoc (HEDNA) Meeting Planners International (MPI) Copyright 2011 Smith Travel Research
 Global Business Travel Association (GBTA) Association of Corporate Travel Executives (ACTE) International Society of Hospitality Consultants (ISHC) Industry Real Estate Financing Advisory Council (IREFAC) Hotel Electronic Distribution Network Assoc (HEDNA) Meeting Planners International (MPI) Copyright 2011 Smith Travel Research.")
34
Special Associations There are associations that focus on ethnicities:
Asian American Hotel Owner Association (AAHOA) National Association of Black Hotel Owners, Operators, and Developers (NABHOOD) Latino Hotel Association (LHA) There are associations that focus on education: International Council on Hotel, Restaurant, and Institutional Education (ICHRIE) American Hotel & Lodging Educational Institute (AHLEI) Copyright 2011 Smith Travel Research
 National Association of Black Hotel Owners, Operators, and Developers (NABHOOD) Latino Hotel Association (LHA) There are associations that focus on education: International Council on Hotel, Restaurant, and Institutional Education (ICHRIE) American Hotel & Lodging Educational Institute (AHLEI) Copyright 2011 Smith Travel Research.")
35
Financial/Wall Street Firms
Wall Street firms have significant interests in the hotel industry. Here are samples: Citigroup Goldman Sachs Wells Fargo JP Morgan UBS Nomura Deutsche Bank American Express Barclays Baird Bank of America Standard & Poor’s Copyright 2011 Smith Travel Research

36
Developers, Consultants & Appraisers
Many consulting firms have concentrations in the hotel industry. Here are samples: PKF PWC McKinsey Deloitte Cushman & Wakefield HVS Tourism Economics Y Partnership Ernst & Young Jones Lang LaSalle Copyright 2011 Smith Travel Research

37
Hotel-related Media Samples of printed media (also online presence):
Lodging Magazine Hotel Business Hotels Hotel Management Business Travel News Samples of electronic media: HotelNewsNow.com (HNN) -- Hotel-Online AHLA Smart Brief Hospitality Business News Daily Hotel Industry News -- Hospitality Net 360 Hotel Interactive Daily e-News -- HotelMarketing.com Copyright 2011 Smith Travel Research
 -- Hotel-Online. AHLA Smart Brief -- Hospitality Business News. Daily Hotel Industry News -- Hospitality Net 360. Hotel Interactive Daily e-News -- HotelMarketing.com. Copyright 2011 Smith Travel Research.")
38
The US Government Many government departments are related to the hotel industry: General Service Administration/Office of Management & Budget (GSA/OMB) – set per diems rates for federal travelers (used by others) Defense Travel Management Office (DTMO) – responsible for travel for armed service members Department of State (DOS) – responsible for international travel Federal Emergency Management Agency (FEMA) - tracks US hotels including fire-safe designation Bureau of Labor & Statistics (BLS) - tracks hotel industry stats Commerce Department - reviews industry impact issues Homeland Security – interested in hotels related to preparedness National Park Service - there are hotels in many national parks Federal Reserve Banks – interested in distressed hotels Copyright 2011 Smith Travel Research
 – set per diems rates for federal travelers (used by others) Defense Travel Management Office (DTMO) – responsible for travel for armed service members. Department of State (DOS) – responsible for international travel. Federal Emergency Management Agency (FEMA) - tracks US hotels including fire-safe designation. Bureau of Labor & Statistics (BLS) - tracks hotel industry stats. Commerce Department - reviews industry impact issues. Homeland Security – interested in hotels related to preparedness. National Park Service - there are hotels in many national parks. Federal Reserve Banks – interested in distressed hotels. Copyright 2011 Smith Travel Research.")
39
Hotel-related Conferences
There are many national hotel and tourism conferences. Here are samples: New York Hotel and Restaurant Show -- ALIS Lodging Conference NYU Midwest Lodging Investment Summit -- Hunter Conference AHLA Resort Conference HITEC/ROC Marketing Outlook Forum ULI HSMAI Revenue Optimization Conf STR’s Hotel Data Conference Copyright 2011 Smith Travel Research

40
The Educational Community
There are nearly 300 universities in the US that have some sort of hospitality or tourism undergraduate department. There are over 700 universities in the world. There are nearly 500 junior colleges, community colleges and post-secondary technical schools that have programs in hospitality or tourism. There are nearly 100 universities in the US that offer masters programs and nearly 25 that offer PHD programs in hospitality or tourism. Copyright 2011 Smith Travel Research

41
Questions Briefly describe some of the additional players in the hotel industry other than hotel companies What role do hotel-related associations serve? What is the value of hotel-related industry conferences? How does the US government use hotel data? Why is it important for the hotel-related educational community to be closely connected to the hotel industry? Copyright 2011 Smith Travel Research

42
Hotel Industry Categorization – Geographic
Copyright 2011 Smith Travel Research

43
Continents and Sub-continents
STR defines these related to the hotel industry There are 4 continents: Americas, Europe, Mideast/Africa and Asia Pacific Each continent includes three to four sub-continents STR is continually updating the census database of hotels to increase the numbers of properties around the world Copyright 2011 Smith Travel Research

44
Global Hotels by Continent and Sub-continent (as of Jan 2012)
Properties Rooms Americas Caribbean 2,270 246,102 Central America 847 48,738 North America 63,186 5,636,306 South America 2,788 299,409 Asia Pacific Australia & Oceania 4,953 298,358 Central & South Asia 2,991 198,599 Northeastern Asia 9,464 1,830,382 Southeastern Asia 3,245 486,755 Europe Eastern Europe 3,819 359,268 Northern Europe 11,345 795,884 Southern Europe 15,882 1,561,239 Western Europe 21,598 1,288,134 Middle East & Africa Middle East 1,120 199,008 Northern Africa 1,300 276,356 Southern Africa 1,549 146,575 TOTAL WORLD 146,357 13,671,113 Copyright 2011 Smith Travel Research

45
Americas consists of 4 continents and 50 countries
Americas - Countries & Sub-continents Sub-Continent Country Caribbean Anguilla Antigua / Barbuda Aruba Bahamas Barbados Bermuda British Virgin Islands Cayman Islands Cuba Curacao Dominica Dominican Republic Grenada Guadeloupe Haiti Jamaica Martinique Montserrat Netherlands Antilles Puerto Rico St Kitts / Nevis St Lucia St Vincent / the Grenadines Trinidad / Tobago Turks / Caicos Islands US Virgin Islands Americas - Countries & Sub-continents Sub-Continent Country Central America Belize Costa Rica El Salvador Guatemala Honduras Nicaragua Panama North America Canada Greenland Mexico United States South America Argentina Bolivia Brazil Chile Colombia Ecuador French Guiana Guyana Paraguay Peru Suriname Uruguay Venezuela Copyright 2011 Smith Travel Research Americas consists of 4 continents and 50 countries

46
Asia Pacific consists of 4 continents and 40 countries
Asia Pacific - Countries & Sub-continents Sub-Continent Country Australia & Oceania American Samoa Australia Cook Islands Fiji French Polynesia Guam Marshall Islands Micronesia New Caledonia New Zealand Northern Mariana Islands Palau Papua New Guinea Samoa Solomon Islands Tonga Vanuatu Central & South Asia Bangladesh Bhutan India Maldives Nepal Pakistan Sri Lanka Asia Pacific - Countries & Sub-continents Sub-Continent Country Northeastern Asia China Japan Mongolia South Korea Taiwan Southeastern Asia Brunei Cambodia East Timor Indonesia Laos Malaysia Myanmar Philippines Singapore Thailand Vietnam Copyright 2011 Smith Travel Research Asia Pacific consists of 4 continents and 40 countries

47
Europe consists of 4 continents and 55 countries
Europe - Countries & Sub-continents Sub-Continent Country Eastern Europe Armenia Azerbaijan Belarus Bulgaria Czech Republic Georgia Hungary Kazakhstan Kyrgyzstan Moldova Poland Romania Russia Slovakia Tajikistan Turkmenistan Ukraine Uzbekistan Northern Europe Denmark Estonia Finland Iceland Ireland Latvia Lithuania Norway Sweden United Kingdom Europe - Countries & Sub-continents Sub-Continent Country Southern Europe Albania Andorra Bosnia / Herzegovina Croatia Cyprus Gibraltar Greece Israel Italy Macedonia Malta Montenegro Portugal San Marino Serbia Slovenia Spain Turkey Western Europe Austria Belgium France Germany Liechtenstein Luxembourg Monaco Netherlands Switzerland Copyright 2011 Smith Travel Research Europe consists of 4 continents and 55 countries

48
Mideast Africa consists of 3 continents and 61 countries
Mideast Africa - Countries & Sub-continents Sub-Continent Country Southern Africa Angola Benin Botswana Burundi Cameroon Cape Verde Cote D`Ivoire Democratic Republic Of Congo Equatorial Guinea Ethiopia Gabon Gambia Ghana Guinea Kenya Lesotho Madagascar Malawi Mauritius Mozambique Namibia Nigeria Republic Of Congo Reunion Rwanda Sao Tome / Principe Senegal Seychelles South Africa Swaziland Tanzania Togo Uganda Zambia Zimbabwe Mideast Africa - Countries & Sub-continents Sub-Continent Country Middle East Afghanistan Bahrain Iran Iraq Jordan Kuwait Lebanon Oman Qatar Saudi Arabia Syria United Arab Emirates Yemen Northern Africa Algeria Burkina Faso Chad Djibouti Egypt Eritrea Libya Mali Mauritania Morocco Niger Sudan Tunisia Copyright 2011 Smith Travel Research Mideast Africa consists of 3 continents and 61 countries

49
Countries STR uses the WTO definition when it comes to recognizing countries Territories such as the Virgin Islands would appear as separate countries There are 206 countries with one or more hotels. There are a small handful of countries without any hotels (in the STR Census database). There are 26 countries with 75,000 rooms or greater Copyright 2011 Smith Travel Research
. There are 26 countries with 75,000 rooms or greater. Copyright 2011 Smith Travel Research.")
50
Top Countries in the World (by number of rooms)
Country Properties Rooms United States 51,954 4,860,339 China 6,872 1,326,242 Germany 8,855 544,482 Spain 4,279 532,975 United Kingdom 7,910 491,114 Canada 7,888 438,442 France 6,932 417,784 Japan 2,078 404,523 Mexico 3,340 337,233 Italy 5,388 329,348 Australia 3,913 232,498 Turkey 1,446 224,896 Brazil 1,365 174,871 Greece 1,895 168,547 India 2,678 166,687 Egypt 595 153,289 Thailand 823 137,018 Portugal 1,328 111,652 Switzerland 2,373 106,235 Indonesia 896 103,284 Malaysia 421 102,348 United Arab Emirates 465 89,555 Austria 1,402 85,612 Sweden 889 81,628 Russia 524 79,747 Netherlands 1,140 78,677 Countries with more than 75,000 hotel rooms Copyright 2011 Smith Travel Research

51
This map identifies hotels that submit performance data to STR

52
The United States There are nearly 52,250 hotels in the US at the current time. STR organizes these hotels into many different geographic and non-geographic categories. Examples will follow in this presentation. STR also tracks performance information for the total US as well as all other countries . A top level US summary will follow in this presentation. STR also provides detailed overviews of US lodging performance. Copyright 2011 Smith Travel Research

53
Hotels in the US Notice where the concentrations of hotels are located

54
Regions Within a Country
STR organizes larger countries into Regions The nine regions in the US correspond to the government Census regions The US regions have varying numbers of hotels and behave differently when it comes to metrics such as ADR Other countries such as Canada, UK, and Germany also have regions Copyright 2011 Smith Travel Research

55
Nine US Regions Nine geographic regions corresponding to the government Census areas

56
US Regions based on the Government Census
Properties Rooms ADR New England 2,102 177,784 $116.18 Middle Atlantic 3,991 415,864 $138.93 South Atlantic 10,838 1,117,814 $97.41 East North Central 6,033 544,714 $85.28 East South Central 3,720 310,502 $75.29 West North Central 4,194 329,095 $77.92 West South Central 6,853 595,450 $82.51 Mountain 5,177 576,006 $89.53 Pacific 7,854 720,726 $112.82 Copyright 2011 Smith Travel Research South Atlantic and Pacific are the two largest regions, Middle Atlantic has the highest ADR

57
States (and Provinces)
Many countries have geographic divisions of states or provinces Hotel data by state or province is very popular States vary widely when it comes to number of hotels and metrics such as ADR or Occupancy The next couple of slides show top US states by various metrics. WW data is also available (i.e.: Canada by Province). Copyright 2011 Smith Travel Research
. Copyright 2011 Smith Travel Research.")
58
Top States (by number of rooms)
Properties Rooms California 5,493 500,341 Florida 3,574 409,094 Texas 4,524 401,352 Nevada 573 196,236 New York 1,791 190,401 Georgia 1,966 178,726 Illinois 1,433 157,693 Virginia 1,453 150,078 North Carolina 1,617 141,249 Pennsylvania 1,333 127,252 Ohio 1,336 121,095 Tennessee 1,400 120,401 Arizona 1,118 110,681 Michigan 1,245 105,094 Missouri 1,117 103,930 Colorado 1,151 102,798 South Carolina 1,061 102,193 New Jersey 867 98,211 Washington 991 86,018 Louisiana 818 85,243 Three largest states (by far) are CA, FL and TX Copyright 2011 Smith Travel Research
 are CA, FL and TX. Copyright 2011 Smith Travel Research.")
59
Top States (by Occupancy)
Top States (by ADR) State ADR Washington DC $201.71 New York $176.50 Hawaii $174.80 Massachusetts $134.37 Alaska $113.02 Rhode Island $111.57 Vermont $111.38 California $110.22 Maryland $110.20 New Jersey $104.34 Florida $103.80 Colorado $103.54 New Hampshire $102.07 Illinois $101.04 Delaware $100.02 Pennsylvania $99.75 Connecticut $98.17 Washington $98.05 Virginia $96.26 Maine $95.72 Top States (by Occupancy) State Occupancy Washington DC 74.1% Hawaii 70.7% New York 69.3% North Dakota 68.0% Alaska 65.1% California 63.2% Massachusetts 62.3% West Virginia 61.8% Louisiana 60.7% Rhode Island 60.3% Washington 60.1% Maryland 59.4% Pennsylvania Florida 59.2% Illinois 58.6% Nevada 58.0% New Jersey 57.3% Minnesota 57.1% Vermont 57.0% New Mexico 56.8% DC, NY, and HI on top for both Copyright 2011 Smith Travel Research
 State. ADR. Washington DC. $ New York. $ Hawaii. $ Massachusetts. $ Alaska. $ Rhode Island. $ Vermont. $ California. $ Maryland. $ New Jersey. $ Florida. $ Colorado. $ New Hampshire. $ Illinois. $ Delaware. $ Pennsylvania. $ Connecticut. $ Washington. $ Virginia. $ Maine. $ Top States (by Occupancy) State. Occupancy. Washington DC. 74.1% Hawaii. 70.7% New York. 69.3% North Dakota. 68.0% Alaska. 65.1% California. 63.2% Massachusetts. 62.3% West Virginia. 61.8% Louisiana. 60.7% Rhode Island. 60.3% Washington. 60.1% Maryland. 59.4% Pennsylvania. Florida. 59.2% Illinois. 58.6% Nevada. 58.0% New Jersey. 57.3% Minnesota. 57.1% Vermont. 57.0% New Mexico. 56.8% DC, NY, and HI on top for both. Copyright 2011 Smith Travel Research.")
60
Markets in the US The US is broken up into 162 geographic areas called markets. There are 94 metro markets (cities) and 68 non-metro markets (rural areas). The metro markets are sometimes separated into major cities and secondary cities. Many industry publications display metrics for the “Top 25 Markets”. These markets are roughly based on Number of Rooms and exclude Las Vegas. Markets roughly correspond to government MSAs and sometimes cross state borders. Copyright 2011 Smith Travel Research An example of an exception - the Miami MSA includes Ft. Lauderdale. STR uses two markets, one for Miami and another for Ft. Lauderdale.
 and 68 non-metro markets (rural areas). The metro markets are sometimes separated into major cities and secondary cities. Many industry publications display metrics for the Top 25 Markets . These markets are roughly based on Number of Rooms and exclude Las Vegas. Markets roughly correspond to government MSAs and sometimes cross state borders. Copyright 2011 Smith Travel Research. An example of an exception - the Miami MSA includes Ft. Lauderdale. STR uses two markets, one for Miami and another for Ft. Lauderdale.")
61
WW Markets Countries outside the US contain varying numbers of markets depending upon the number of hotels and the participation. Smaller countries may consist of just a single market. Countries that are slightly larger may consist of a market for the major city and then a second market for all of the other hotels, named something like “Country Name Area” or “Country Regional”. Larger countries will have many markets just like the US. Copyright 2011 Smith Travel Research The number of markets will increase as hotels and participation increase

62
Top 25 US Markets (roughly related to Supply, excluding Las Vegas)
Properties Rooms Orlando, FL 473 117,842 Chicago, IL 720 107,606 Washington, DC-MD-VA 670 104,654 New York, NY 552 101,616 Los Angeles-Long Beach, CA 991 98,138 Atlanta, GA 784 93,673 Dallas, TX 622 76,866 Houston, TX 723 72,689 Phoenix, AZ 437 61,094 San Diego, CA 465 58,149 Anaheim-Santa Ana, CA 427 53,697 San Francisco/San Mateo, CA 395 51,509 Boston, MA 347 50,086 Miami-Hialeah, FL 363 47,879 Tampa-St Petersburg, FL 443 44,279 Philadelphia, PA-NJ 364 43,572 Detroit, MI 374 41,128 Seattle, WA 334 40,552 Denver, CO 290 40,052 Norfolk-Virginia Beach, VA 365 39,357 St Louis, MO-IL 331 39,044 Minneapolis-St Paul, MN-WI 314 37,841 New Orleans, LA 259 36,635 Nashville, TN 35,390 Oahu Island, HI 89 29,125 These are the ones that are tracked in the US Monthly and Weekly Hotel Reviews Copyright 2011 Smith Travel Research

63
Top 25 WW Markets (based upon number of rooms)
Properties Rooms East China excl Hangzhou 1,800 296,190 South Central China Regional 1,159 246,742 Turkey 1,448 222,997 Shanghai 926 175,576 Beijing 889 170,028 Las Vegas, NV 372 169,195 Central Mexico 1,974 161,232 Western China 827 153,192 Greece 1,695 145,223 Regional Southern Germany 2,907 138,164 Western France 2,371 125,794 Orlando, FL 469 117,521 Red Sea Resorts 400 115,370 Portugal 1,337 112,040 Greater London 1,173 110,836 Malaysia 468 106,934 Chicago, IL 712 106,675 Washington, DC-MD-VA 673 104,778 Eastern Spain excluding Barcelona 890 102,248 Canary Islands 462 101,793 New York, NY 548 101,453 Los Angeles-Long Beach, CA 985 97,029 Brazil Area 757 95,292 Atlanta, GA 783 93,293 Regional Western Germany 1,896 92,842 Some of these markets are related to participation, i.e. Turkey (country) Copyright 2011 Smith Travel Research
 Copyright 2011 Smith Travel Research.")
64
Top US Metro Markets (by number of properties)
Rooms Los Angeles-Long Beach, CA 991 98,138 Atlanta, GA 784 93,673 Houston, TX 723 72,689 Chicago, IL 720 107,606 Washington, DC-MD-VA 670 104,654 Dallas, TX 622 76,866 New York, NY 552 101,616 Riverside-San Bernardino, CA 500 41,947 Orlando, FL 473 117,842 San Diego, CA 465 58,149 Tampa-St Petersburg, FL 443 44,279 Phoenix, AZ 437 61,094 Anaheim-Santa Ana, CA 427 53,697 San Francisco/San Mateo, CA 395 51,509 San Antonio, TX 43,782 Las Vegas, NV 378 170,171 Detroit, MI 374 41,128 Norfolk-Virginia Beach, VA 365 39,357 Philadelphia, PA-NJ 364 43,572 Miami-Hialeah, FL 363 47,879 Notice that markets such as Chicago, DC, and NY have larger hotels Copyright 2011 Smith Travel Research

65
Top US Metro Markets (by Occupancy)
Properties Rooms New York, NY 80.8% 537 98,358 Oahu Island, HI 78.2% 88 29,076 San Francisco/San Mateo, CA 75.2% 396 51,663 Miami-Hialeah, FL 70.4% 359 47,435 Florida Keys 70.3% 167 8,841 Boston, MA 68.6% 338 49,816 Maui Island, HI 68.1% 103 13,922 Anaheim-Santa Ana, CA 67.8% 426 53,549 Los Angeles-Long Beach, CA 988 97,680 Fort Lauderdale, FL 67.4% 277 29,727 Washington, DC-MD-VA 67.0% 667 103,624 Newark, NJ 66.6% 133 17,692 Bergen-Passaic, NJ 66.5% 75 9,566 San Diego, CA 66.4% 465 58,202 Pittsburgh, PA 66.2% 202 23,237 Seattle, WA 65.5% 334 40,556 Long Island 64.9% 157 13,729 San Jose-Santa Cruz, CA 64.5% 308 29,241 New Orleans, LA 64.4% 256 35,192 Charleston, SC 64.1% 165 Top markets by Occ – NY, HI, San Fran, Miami, Keys, and Boston Copyright 2011 Smith Travel Research

66
Top US Metro Markets (by ADR)
Properties Rooms New York, NY $232.20 537 98,358 Maui Island, HI $226.19 103 13,922 Hawaii-Kauai Islands $184.67 87 13,559 Florida Keys $179.61 167 8,841 Oahu Island, HI $150.07 88 29,076 Miami-Hialeah, FL $143.65 359 47,435 Washington, DC-MD-VA $143.46 667 103,624 Boston, MA $141.57 338 49,816 San Francisco/San Mateo, CA $136.13 396 51,663 West Palm Beach-Boca Raton, FL $125.84 138 15,559 San Diego, CA $121.71 465 58,202 Long Island $120.71 157 13,729 Fort Myers, FL $119.98 135 12,088 Los Angeles-Long Beach, CA $116.59 988 97,680 New Orleans, LA $116.00 256 35,192 Chicago, IL $112.69 722 108,024 Seattle, WA $110.38 334 40,556 Scranton--Wilkes-Barre, PA $109.44 151 12,139 Anaheim-Santa Ana, CA $108.25 426 53,549 Philadelphia, PA-NJ $108.18 363 43,343 Top markets by ADR – NY, HI, Keys, Miami, DC, Boston, and San Fran Copyright 2011 Smith Travel Research

67
US Tracts (also called Sub-markets)
Tracts are geographic sub-divisions of a market. There may be anywhere from two to ten or more tracts in a market. In a metro market, there is usually a tract for the downtown area, sometimes called the CBD (Central Business District). There may be other tracts identified such as North/South/East/West, or Airport/Beach, or for suburban neighborhoods. In non-metro (rural) markets a tract may represent a small city. There are 622 tracts in the US. Copyright 2011 Smith Travel Research
. There may be other tracts identified such as North/South/East/West, or Airport/Beach, or for suburban neighborhoods. In non-metro (rural) markets a tract may represent a small city. There are 622 tracts in the US. Copyright 2011 Smith Travel Research.")
68
WW Sub-markets Outside of North America, STR/STR Global uses the term “sub-market” instead of tract. The number of sub-markets depend upon the size of the market. Small markets may only consist of a single sub- market. Larger markets will be sub-divided just like the US. As the number of hotels and participation increases, additional sub-markets will be created. Copyright 2011 Smith Travel Research

69
Notice differences between markets and tracts – Ski area, CA tracts
Top Tracts (by ADR) Tract ADR Properties Rooms Uptown/Midtown East $290.75 83 20,684 Maui Area HI $256.52 54 6,337 Times Square Area $254.00 108 32,872 Lower Manhattan $229.41 143 23,929 Colorado Ski Area $205.26 138 13,261 Kaanapali/Lahaina/Kapalua $201.93 49 7,585 Washington DC (CBD) $201.71 115 27,431 Santa Monica/Marina Del Rey $201.28 58 5,513 Hollywood-Beverly Hills $201.22 128 12,846 Miami Beach $194.12 158 19,458 Key West $190.58 90 4,670 Boston Downtown/Airport $188.58 72 18,201 Kauai $186.00 38 4,789 Hawaii (Big Island) $183.90 8,770 Arlington, VA $163.88 42 10,205 Upper Florida Keys $163.76 77 4,171 Chicago Downtown $163.32 37,388 Naples MSA $161.04 63 7,460 Fort Myers Beach/Sanibel Islan $160.08 71 6,003 Monterey/Salinas MSA $157.47 202 11,625 Notice differences between markets and tracts – Ski area, CA tracts Copyright 2011 Smith Travel Research
 Tract. ADR. Properties. Rooms. Uptown/Midtown East. $ ,684. Maui Area HI. $ ,337. Times Square Area. $ ,872. Lower Manhattan. $ ,929. Colorado Ski Area. $ ,261. Kaanapali/Lahaina/Kapalua. $ ,585. Washington DC (CBD) $ ,431. Santa Monica/Marina Del Rey. $ ,513. Hollywood-Beverly Hills. $ ,846. Miami Beach. $ ,458. Key West. $ ,670. Boston Downtown/Airport. $ ,201. Kauai. $ ,789. Hawaii (Big Island) $ ,770. Arlington, VA. $ ,205. Upper Florida Keys. $ ,171. Chicago Downtown. $ ,388. Naples MSA. $ ,460. Fort Myers Beach/Sanibel Islan. $ ,003. Monterey/Salinas MSA. $ ,625. Notice differences between markets and tracts – Ski area, CA tracts. Copyright 2011 Smith Travel Research.")
70
Top 20 Tracts (by Occupancy)
Properties Rooms Times Square Area 85.2% 108 32,872 Lower Manhattan 82.4% 143 23,929 Uptown/Midtown East 81.7% 83 20,684 Waikiki 79.5% 74 25,331 Key West 78.0% 90 4,670 S F - Nob Hill/Wharf 77.9% 129 15,479 San Francisco - Market St 76.9% 92 18,531 Miami Airport-Civic Center 76.8% 76 11,463 Santa Monica/Marina Del Rey 76.6% 58 5,513 New York City Area 75.9% 142 13,237 Boston Downtown/Airport 75.7% 72 18,201 Los Angeles Airport 75.3% 98 15,691 Hollywood-Beverly Hills 74.8% 128 12,846 Washington DC (CBD) 74.1% 115 27,431 San Francisco Airport 74.0% 62 8,812 Lake Buena Vista 73.7% 45 32,479 Cambridge/Waltham 73.4% 55 7,931 Arlington, VA 42 10,205 Shreveport MSA 10,322 Charleston/West Ashley 73.2% 50 6,120 Compare differences between markets and tracts, also occupancy and ADR Copyright 2011 Smith Travel Research
 74.1% ,431. San Francisco Airport. 74.0% 62. 8,812. Lake Buena Vista. 73.7% ,479. Cambridge/Waltham. 73.4% 55. 7,931. Arlington, VA ,205. Shreveport MSA. 10,322. Charleston/West Ashley. 73.2% 50. 6,120. Compare differences between markets and tracts, also occupancy and ADR. Copyright 2011 Smith Travel Research.")
71
Other US Geographic Categories
Counties Hotels are organized into the standard county designations. County data is often used for low-level impact analyses. Participation is sometimes a factor for many counties. There are 2,773 counties in the US with one or more hotels. There are 1,309 counties with four or more reporting hotels (47%). Zip Codes Zip code is the lowest geographic unit in the US. Participation is frequently a factor for zip codes. There are 11,037 zip codes in the US with one or more hotels. There are 2,794 zip codes with four or more reporting hotels (25%). MSAs (available) Copyright 2011 Smith Travel Research Many countries have some sort of postal code
. Zip Codes. Zip code is the lowest geographic unit in the US. Participation is frequently a factor for zip codes. There are 11,037 zip codes in the US with one or more hotels. There are 2,794 zip codes with four or more reporting hotels (25%). MSAs (available) Copyright 2011 Smith Travel Research. Many countries have some sort of postal code.")
72
Top 10 Counties (by Occupancy)
County Occupancy Properties Rooms New York County, NY 83.4% 334 77,485 Honolulu County, HI 78.2% 88 29,076 Ward County, ND 77.8% 18 1,793 Queens County, NY 77.7% 80 8,472 San Francisco County, CA 77.3% 222 34,061 Stark County, ND 76.9% 14 937 Lycoming County, PA 76.4% 12 1,122 Washington County, PA 75.4% 22 1,838 Suffolk County, MA 75.3% 82 19,800 Top 10 Counties (by ADR) County ADR Properties Rooms Pitkin County, CO $257.97 34 2,716 New York County, NY $256.56 334 77,485 Eagle County, CO $241.89 52 4,866 Maui County, HI $226.19 103 13,922 Napa County, CA $215.22 70 4,312 Summit County, UT $204.09 36 3,881 District of Columbia, DC $201.71 115 27,431 Kauai County, HI $186.00 38 4,789 Suffolk County, MA $184.00 82 19,800 Copyright 2011 Smith Travel Research
 County. ADR. Properties. Rooms. Pitkin County, CO. $ ,716. New York County, NY. $ ,485. Eagle County, CO. $ ,866. Maui County, HI. $ ,922. Napa County, CA. $ ,312. Summit County, UT. $ ,881. District of Columbia, DC. $ ,431. Kauai County, HI. $ ,789. Suffolk County, MA. $ ,800. Copyright 2011 Smith Travel Research.")
73
Latitudes and Longitudes for Hotels
Latitudes and Longitudes are available for hotels throughout the world These allow you to view hotels with various mapping programs. You can also perform radial queries, i.e.: select all hotels within two miles of the convention center. The lat/longs for North America are very accurate. Outside North America, some countries are very good. In smaller, developing countries lat/longs may be less reliable. Copyright 2011 Smith Travel Research

74
Hotel Industry Categorization – Non-Geographic
Copyright 2011 Smith Travel Research

75
Scale The Scale category is one of the most popular ways the industry looks at different hotels There are seven Scale categories, six for chain hotels ranging from Luxury to Economy, and one Scale category for all Independent hotels Chains are positioned in Scale groups based upon the average annual ADR of all hotels in the chain. STR revaluates this every year. (STR revised the Scale categories in Midscale changed from “with and without F&B” to Upper Midscale and Midscale.) Copyright 2011 Smith Travel Research
 Copyright 2011 Smith Travel Research.")
76
US Scales Scale Occupancy ADR Properties Rooms Luxury Chains 66.5%
$243.62 378 124,185 Upper Upscale Chains 67.4% $142.54 1,494 547,641 Upscale Chains 66.8% $107.81 3,652 565,703 Upper Midscale Chains 58.4% $91.42 7,674 766,494 Midscale Chains 51.7% $73.68 6,374 563,582 Economy Chains 51.6% $49.31 10,271 781,825 Independents 54.7% $95.83 20,919 1,438,525 Copyright 2011 Smith Travel Research Notice the average ADRs for each Chain Scale group and Independents Notice the numbers of Props and Rooms and size differences

77
US Luxury Chains (with 5 or more properties sorted by number of rooms)
JW Marriott 21 12,096 Ritz-Carlton 38 11,346 InterContinental 24 9,766 W Hotel 26 8,371 Grand Hyatt 11 8,211 Four Seasons 29 7,908 Loews 16 7,511 Waldorf Astoria Hotels & Resorts 13 7,172 Fairmont 17 7,155 Luxury Collection 3,920 Sofitel Luxury Hotels 8 2,635 Trump Hotel Collection 5 2,370 Affinia 7 2,064 St Regis 9 2,061 Mandarin Oriental Hotel Group 6 1,672 RockResorts 10 1,165 AKA 963 Rosewood 900 WW Chains by Scale are available Copyright 2011 Smith Travel Research

78
US Upper Upscale Chains (with 5 or more properties sorted by number of rooms)
Marriott 323 127,793 Hilton 256 104,517 Sheraton Hotel 185 68,556 Hyatt 105 52,612 Embassy Suites 204 49,579 Westin 96 42,740 Renaissance 79 28,707 Wyndham Hotels 52 14,681 Omni 38 14,530 Kimpton 49 9,496 Millennium Hotels 14 5,915 Autograph Collection 17 5,239 Joie De Vivre 29 3,681 Hard Rock 6 3,354 Marriott Conference Center 10 3,127 Club Quarters 11 2,866 Le Meridien 7 1,959 Dolce Hotels 1,684 Copyright 2011 Smith Travel Research

79
US Upscale Chains (with 5 or more properties sorted by number of rooms)
Courtyard 801 112,543 Residence Inn 597 72,075 Hilton Garden Inn 486 65,844 Doubletree 214 55,572 Crowne Plaza 161 45,874 Springhill Suites 284 33,376 Homewood Suites 298 32,821 Radisson 111 26,494 Disney Hotels 20 24,082 Hyatt Place 20,382 Staybridge Suites 180 19,685 Four Points 84 13,385 aloft Hotels 42 6,096 Hyatt Summerfield Suites 38 5,249 Aston Hotels 26 4,416 Ascend Collection 47 4,252 Great Wolf Lodge 10 3,747 Hotel Indigo 30 3,652 Outrigger 17 2,897 Grand America Hotels & Resort 6 2,708 Hotel Sierra 2,572 Cambria Suites 19 2,215 Coast Hotels 12 1,758 element 9 1,432 Legacy Vacation Club 8 791 Copyright 2011 Smith Travel Research

80
US Upper Midscale Chains (with 5 or more properties sorted by number of rooms)
Holiday Inn Express Hotel 1,733 146,966 Holiday Inn 660 117,275 Hampton Inn 1,192 113,054 Comfort Inn 1,419 111,124 Best Western Plus 706 63,906 Hampton Inn Suites 591 60,399 Fairfield Inn 665 60,166 Comfort Suites 617 47,473 Clarion 191 27,895 TownePlace Suites 198 19,880 Drury Inn & Suites 73 11,142 Ramada Plaza 33 7,765 Wyndham Garden Hotel 19 3,676 Xanterra Parks & Resorts 23 3,280 Isle of Capri 9 3,171 Ayres 20 2,625 Lexington 2,414 Drury Inn 2,220 Park Inn 1,919 Holiday Inn Select 8 1,810 Chase Suites 13 1,693 Drury Plaza Hotel 5 1,391 Silver Cloud 10 1,383 Doubletree Club 1,276 Best Western Premier 11 1,253 Phoenix Inn 937 3 Palms Hotels & Resorts 851 Home2 Suites by Hilton 527 Copyright 2011 Smith Travel Research

81
US Midscale Chains (with 5 or more properties sorted by number of rooms)
Best Western 1,272 97,337 Quality Inn 1,013 88,363 La Quinta Inns & Suites 802 81,690 Ramada 469 51,589 Country Inn & Suites 455 36,317 Candlewood Suites 300 29,260 Sleep Inn 393 28,499 Baymont Inns & Suites 259 21,701 Wingate By Wyndham 162 14,771 AmericInn 221 12,644 Howard Johnson 90 9,868 Red Lion 44 8,487 Hawthorn Suites by Wyndham 73 6,939 Shilo Inn 41 4,565 Quality Suites 35 3,398 Mainstay Suites 40 3,079 Vagabond Inn 42 3,003 Oak Tree Inn 28 2,060 Settle Inn 15 1,060 InnSuites Hotels 5 882 Crystal Inn 8 851 Cabot Lodge 816 GrandStay Residential Suites 13 795 Vista 11 781 ClubHouse 571 Crossings by GrandStay 9 447 America`s Best Suites 350 Copyright 2011 Smith Travel Research

82
US Economy Chains (with 25 or more properties sorted by number of rooms)
Days Inn 1,667 129,092 Super 8 1,851 111,300 Motel 6 998 97,141 Americas Best Value Inn 905 56,067 Econo Lodge 798 49,597 Extended Stay America 366 40,535 Red Roof Inn 348 36,215 Travelodge 349 24,467 Rodeway Inn 388 21,580 Microtel Inn 302 21,402 Knights Inn 336 21,021 Value Place 175 20,735 InTown Suites 138 17,974 Homestead 131 16,728 Howard Johnson Express 219 16,312 Extended Stay Deluxe 105 10,549 Jameson Inn 116 7,345 Suburban Extended Stay Hotels 60 7,205 Studio 6 63 6,971 Country Hearth Inn 103 6,862 Budget Suites of America 18 6,848 Red Carpet Inns 122 6,764 Budget Host 159 5,902 America`s Best Inns 97 5,847 GuestHouse Inns 69 5,736 Crossland Suites 34 4,401 Scottish Inns 115 4,321 Studio Plus 46 3,551 National 9 26 1,053 Copyright 2011 Smith Travel Research

83
Scales related to Geography
High-end hotels tend to be concentrated in specific markets of the US Luxury hotels tend to be located in larger cities and resort locations Upper Upscale hotels tend to be located in larger cities and business locations There is a higher concentration of Economy and Midscale hotels in smaller metro and rural markets Copyright 2011 Smith Travel Research

84
Top 20 US Metro Markets for Luxury Hotels (by number of rooms)
Properties Rooms New York, NY 39 13,945 Chicago, IL 16 6,654 Washington, DC-MD-VA 21 6,481 Orlando, FL 8 6,265 San Francisco/San Mateo, CA 18 5,807 Los Angeles-Long Beach, CA 20 5,749 Miami-Hialeah, FL 4,990 Phoenix, AZ 13 4,934 Atlanta, GA 12 4,116 San Diego, 9 3,728 Las Vegas, NV 6 3,559 Boston, MA 14 3,506 New Orleans, LA 3,367 Dallas, TX 2,763 Maui Island, HI 2,411 Hawaii-Kauai Islands 7 2,356 San Antonio, TX 3 2,104 Houston, TX 5 1,925 West Palm Beach-Boca Raton, FL 1,856 Anaheim-Santa Ana, CA 1,817 Top markets – NY, Chicago, DC, Orlando, San Fran, LA and Miami Copyright 2011 Smith Travel Research

85
Top 20 US Metro Markets for Upper Upscale Hotels (by number of rooms)
Properties Rooms Chicago, IL 68 30,412 Washington, DC-MD-VA 79 29,599 Los Angeles-Long Beach, CA 48 20,591 New York, NY 43 19,327 Atlanta, GA 18,473 Orlando, FL 32 18,367 San Francisco/San Mateo, CA 45 18,131 Dallas, TX 38 16,305 Boston, MA 37 14,540 Houston, TX 34 12,798 Anaheim-Santa Ana, CA 30 12,273 San Diego, CA 27 11,652 Phoenix, AZ 29 10,450 Las Vegas, NV 10 10,151 Oahu Island, HI 9 10,065 New Orleans, LA 18 8,838 Fort Lauderdale, FL 23 8,655 Denver, CO 21 8,586 Philadelphia, PA-NJ 26 8,466 St Louis, MO-IL 8,356 Notice differences – Atlanta, Dallas, Houston Copyright 2011 Smith Travel Research

86
The “Class” Category The Class category is similar to Scale. Chain hotels are always in the same Class group as their Scale group. There is no “Independent” Class group. Independent hotels are slotted into the Scale categories (Luxury through Economy) at similar ADR levels Class is relied upon heavily outside North America. Class is also used in North America. Class appears with Scale on US STAR Reports Copyright 2011 Smith Travel Research
 at similar ADR levels. Class is relied upon heavily outside North America. Class is also used in North America. Class appears with Scale on US STAR Reports. Copyright 2011 Smith Travel Research.")
87
WW Hotels by Class Class Properties Rooms Luxury Class 4,856 779,467
Upper Upscale Class 10,325 1,847,046 Upscale Class 21,348 2,769,999 Upper Midscale Class 25,939 2,664,167 Midscale Class 28,328 2,416,445 Economy Class 56,212 3,264,979 Copyright 2011 Smith Travel Research

88
Location Category STR distinguishes hotels by their Location. Detailed definitions are available Urban - in large metro cities Suburban - in the suburbs of the cities above Airport – close to a major airport Interstate – close to a major highway Resort – primarily leisure destination hotels Small Metro/Town – in smaller metro areas Copyright 2011 Smith Travel Research

89
US Locations Location Occupancy ADR Properties Rooms Urban 65.7%
$139.85 4,839 752,785 Suburban 57.3% $ 17,427 1,741,776 Airport 63.6% $ 2,205 304,318 Interstate 51.5% $ 7,316 496,593 Resort 59.5% $128.70 3,733 592,881 Small Metro/Town 51.7% $ 15,242 899,602 Notice highest occupancies in Urban & Airport, highest ADRs in Urban & Resort Copyright 2011 Smith Travel Research

90
Extended Stay Hotels Several chains are identified as Extended Stay chains Extended Stay is not a Scale category The Extended stay chains range in scale Chains are organized into two levels, Upper and Lower, related to price level Copyright 2011 Smith Travel Research

91
US Extended Stay Chains (by level and number of rooms)
Props Rooms Residence Inn Upper 597 72,075 Homewood Suites 298 32,821 Staybridge Suites 180 19,685 Hawthorn Suites by Wyndham 73 6,939 Hyatt Summerfield Suites 38 5,249 Club Quarters 11 2,866 Hotel Sierra 17 2,572 Chase Suites 13 1,693 element 9 1,432 AKA 963 Extended Stay America Lower 366 40,535 Candlewood Suites 300 29,260 Value Place 175 20,735 TownePlace Suites 198 19,880 InTown Suites 138 17,974 Homestead 131 16,728 Extended Stay Deluxe 105 10,549 Suburban Extended Stay Hotels 60 7,205 Studio 6 63 6,971 Crossland Suites 34 4,401 Studio Plus 46 3,551 Mainstay Suites 40 3,079 Crestwood Suites 21 2,846 Sun Suites Hotels 22 2,841 Savannah Suites 1,843 InnSuites Hotels 5 882 Affordable Suites of America 740 Home2 Suites by Hilton 527 Homegate 3 212 Copyright 2011 Smith Travel Research

92
Boutique Hotels Hotels that appeal to guests because of their unusual amenity and room configurations, normally independent and smaller than 200 rooms with a high average rate Several chains are indentified as Boutique: Aloft (Starwood) Autograph (Marriott) Dream (Wyndham) -- Exclusive Hotel Indigo (IHG) -- Joie De Vivre Kimpton Melia Boutique (Grupo Sol Melia) Rosewood -- W Hotel (Starwood) There are nearly 700 Boutique hotels in the US Copyright 2011 Smith Travel Research Counts and lists of Boutique hotels are available around the world
 -- Autograph (Marriott) Dream (Wyndham) -- Exclusive. Hotel Indigo (IHG) -- Joie De Vivre. Kimpton -- Melia Boutique (Grupo Sol Melia) Rosewood -- W Hotel (Starwood) There are nearly 700 Boutique hotels in the US. Copyright 2011 Smith Travel Research. Counts and lists of Boutique hotels are available around the world.")
93
Additional Hotel Types
STR tracks several additional types of hotels The types are not exclusive, so a single hotel can be categorized as multiple types Certain types indicate that the hotel has a feature on-site (and on the P&L), not just nearby, i.e.: Golf, Ski, Spa and Waterpark Definitions are available for other types Copyright 2011 Smith Travel Research
, not just nearby, i.e.: Golf, Ski, Spa and Waterpark. Definitions are available for other types. Copyright 2011 Smith Travel Research.")
94
Hotel Types Type Properties Rooms ADR Occupancy All-Suites 6,368
706,642 $94.67 64.5 Boutique 660 78,712 $178.91 67.6 Casino 388 227,651 $92.63 58.7 Conference 152 37,427 $126.31 57.5 Convention 863 580,689 $142.19 63.0 Destination Resort 306 154,689 $161.19 61.5 Golf 448 107,706 $155.25 54.5 Ski 158 22,398 $179.48 47.6 Spa 1,147 384,671 $166.02 61.2 Waterpark 132 29,282 $109.63 54.1 Copyright 2011 Smith Travel Research Notice the number of properties and the ADRs

95
Hotel Ratings There are various ratings that are used for hotels (stars, diamond) There are various companies that rate (or have rated) hotels (AAA, Mobil, Michelin, TripAdvisor, other online companies, hotel associations in countries) The ratings are based on a range of criteria. They can vary and can be inconsistent. STR rarely publishes data based on these ratings. Copyright 2011 Smith Travel Research
 hotels (AAA, Mobil, Michelin, TripAdvisor, other online companies, hotel associations in countries) The ratings are based on a range of criteria. They can vary and can be inconsistent. STR rarely publishes data based on these ratings. Copyright 2011 Smith Travel Research.")
96
Questions Briefly describe the geographic categorization methods used by the hotel industry What is the value of consistent categorization? Briefly describe the non-geographic categorization methods used by the hotel industry Compare the Scale category to the Class category Copyright 2011 Smith Travel Research

97
Hotel Industry Impact and Issues
Copyright 2011 Smith Travel Research

98
Total US - Key Statistics Annual 2010 and 2011
Metric Annual 2010 2011 % Change Number of Hotels 51,900 52,250 0.7 Rooms Available (Supply) 1,751,926,028 1,760,720,838 0.5 Rooms Sold (Demand) 1,008,002,820 1,057,506,460 4.9 Room Revenue $98,849,561,085 $107,527,875,788 8.8 Total Revenue $127,699,576,789 $137,510,880,894 7.1 Occupancy 57.5 60.1 4.5 ADR $98.06 $101.68 3.7 RevPAR $56.42 $61.07 8.2 Copyright 2011 Smith Travel Research
 1,751,926,028. 1,760,720, Rooms Sold (Demand) 1,008,002,820. 1,057,506, Room Revenue. $98,849,561,085. $107,527,875, Total Revenue. $127,699,576,789. $137,510,880, Occupancy ADR. $ $ RevPAR. $ $ Copyright 2011 Smith Travel Research.")
99
Total US Top-level Performance Summary
The number of rooms sold for the US Hotel Industry in 2011 was a little over 1 billion. The amount of room revenue for the US Hotel Industry in 2011 was over 100 billion dollars. This does not include ancillary revenue (additional revenue spent elsewhere in the hotel). That was approximately 30 billion dollars. Copyright 2011 Smith Travel Research
. That was approximately 30 billion dollars. Copyright 2011 Smith Travel Research.")
100
US Performance Records – KPI’s
The highest Occupancy since 1988 (Running 12- month number) was 64.9% in June, August, September, and October of More recently, Occupancy peaked at 63.5% in May, June, and July of 2006. The highest ADR (Running 12-month number) was $ in September 2008. The highest RevPAR (Running 12-month number) was $65.99 in July 2008. Copyright 2011 Smith Travel Research
 was 64.9% in June, August, September, and October of More recently, Occupancy peaked at 63.5% in May, June, and July of The highest ADR (Running 12-month number) was $ in September The highest RevPAR (Running 12-month number) was $65.99 in July Copyright 2011 Smith Travel Research.")
101
More US Records – Raw Values
The highest Supply, Demand, and Revenue numbers since 1988 (based upon Running 12-month data) was the most recent month, May 2012: Rooms Available (Supply) ,763,043,277 Rooms Sold (Demand) ,070,912,262 Room Revenue $110,710,637,383 All of these records are being set now as we speak! Copyright 2011 Smith Travel Research Data as of April 2012
 was the most recent month, May 2012: Rooms Available (Supply) 1,763,043,277. Rooms Sold (Demand) 1,070,912,262. Room Revenue $110,710,637,383. All of these records are being set now as we speak! Copyright 2011 Smith Travel Research. Data as of April")
102
Total US Historic Performance
STR regularly conducts overviews of the US Lodging Industry These overviews look at the various metrics and the percent change numbers over time The overviews also drill-down and look at performance in the various categories These overviews are also available for states and cities/markets Copyright 2011 Smith Travel Research

103
Occupancy back to 2008 level, ADR ½ way, RevPAR ⅔ way
Total US - Key Performance Indicators Annual 2007, 2008, 2009, 2010, and 2011 Occupancy back to 2008 level, ADR ½ way, RevPAR ⅔ way

104
Total US - Key Performance Percent Change Indicators Annual 2008, 2009, 2010, and 2011
Big Demand & Occ turn around; ADR negative in 2010, but positive in 2011

105
Total US - Supply and Demand Percent Change
Twelve Month Moving Average, Jan 1989 to Dec 2011 Supply: 3.0% (Sep 09) 0.6% (Dec 11) -0.9% Demand: 7.0% (Aug 09) 7.8% (Feb 11) 5.0% (Dec 11) - 4.6% This downturn and recovery was different than previous ones 2010 saw strongest Demand increase in history and sharp Supply decrease
 0.6% (Dec 11) -0.9% Demand: 7.0% (Aug 09) 7.8% (Feb 11) 5.0% (Dec 11) - 4.6% This downturn and recovery was different than previous ones 2010 saw strongest Demand increase in history and sharp Supply decrease.")
106
Supply has levelled off, for the first time since 2004 – good news
Total US - Actual Monthly Room Supply Millions of Room Nights, Seasonally Adjusted, Jan 1998 to Dec 2011 Supply has levelled off, for the first time since 2004 – good news

107
Demand at record high level for most of 2011! – also good news
Total US - Actual Monthly Room Demand Millions of Room Nights, Seasonally Adjusted, Jan 1998 to Dec 2011 Demand at record high level for most of 2011! – also good news

108
Occupancy leveling, ADR returning, very different recovery than 2002!
Total US – Occupancy and ADR Percent Change Twelve Month Moving Average, Jan 1989 to Dec 2011 ADR: -8.9% (Jan 10) 3.7% (Dec 11) -4.5% 0.0% Occupancy: -9.7% (Sep 09) 6.3% (Apr 11) 4.5% (Dec 11) -3.4% -6.7% Occupancy leveling, ADR returning, very different recovery than 2002!
 3.7% (Dec 11) -4.5% 0.0% Occupancy: -9.7% (Sep 09) 6.3% (Apr 11) 4.5% (Dec 11) -3.4% -6.7% Occupancy leveling, ADR returning, very different recovery than 2002!")
109
Major challenge for the industry – making up the lost ADR!
Total US - Occupancy & ADR Actual Values Twelve Month Moving Average – Jan 1997 to Dec 2011 Major challenge for the industry – making up the lost ADR!

110
ADR Discounting at Twice the Speed of ADR Recovery
Total US Actual ADR, 12 Month Moving Average, Sept ‘08 $108 Dec ‘11 $102 -10% +4.6% 19 Months Apr ’10 $97 19 Months

111
Inflation Adjusted ADRs Currently Well Out Of Reach
Total US Actual ADRs and Inflation Adjusted ADR, 2000 – 2013F 2000 – 2010 CPI from bls.gov, 2011 – 2013 CPI from Blue Chip Economic Indicators $117 2007 ADR Grown By CPI $107 $101 2000 ADR Grown By CPI $85 $85 $104 $107 $109

112
Questions Briefly describe the US hotel industry from the perspective of annual nights sold and revenue What do you guess is the amount of ancillary revenue in addition to room revenue and why is this significant? Compare the 2011 versus 2010 performance of the US hotel industry Compare various records set in the US hotel industry, including key performance indicators and raw values What is the current good news in the hotel industry, and what are the current challenges? Copyright 2011 Smith Travel Research

113
Benchmarking in the Hotel Industry – Intro to Competitive Sets
Copyright 2011 Smith Travel Research

114
Benchmarking 101: my hotel vs. the competition

115
Benchmarking in the Hotel Industry
Individual hotels compare their performance to the performance of a “competitive set” of hotels. This information is carefully tracked by the subject hotel (owner of the comp set). Individual hotels can also compare their performance to hotels in pre-defined industry segments near their hotel, i.e. the market or tract (sub-market) where they are located. Companies compare their own properties to a variety of comparative groups of hotels to gauge the performance of their portfolio. This is valuable for corporate HQs. Copyright 2011 Smith Travel Research
. Individual hotels can also compare their performance to hotels in pre-defined industry segments near their hotel, i.e. the market or tract (sub-market) where they are located. Companies compare their own properties to a variety of comparative groups of hotels to gauge the performance of their portfolio. This is valuable for corporate HQs. Copyright 2011 Smith Travel Research.")
116
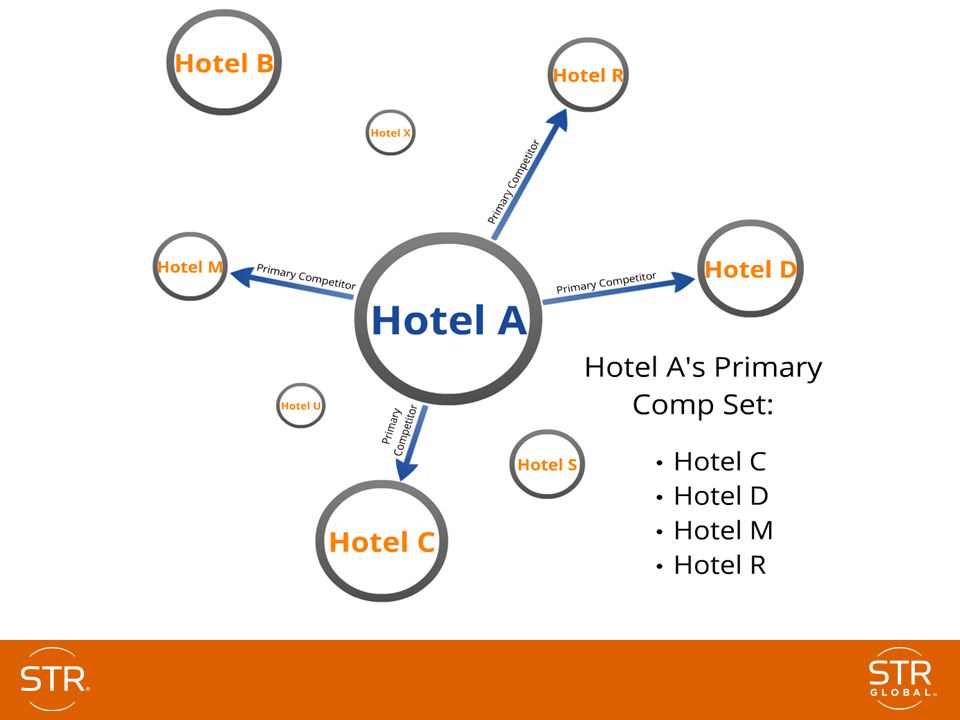
What is a “Competitive Set”?
A competitive set is a group of hotels used primarily for comparison against a subject property for performance benchmarking purposes The properties that comprise a comp set are competitive in nature; competing for the same guests and sharing similar qualitative and quantitative features Copyright 2011 Smith Travel Research

118
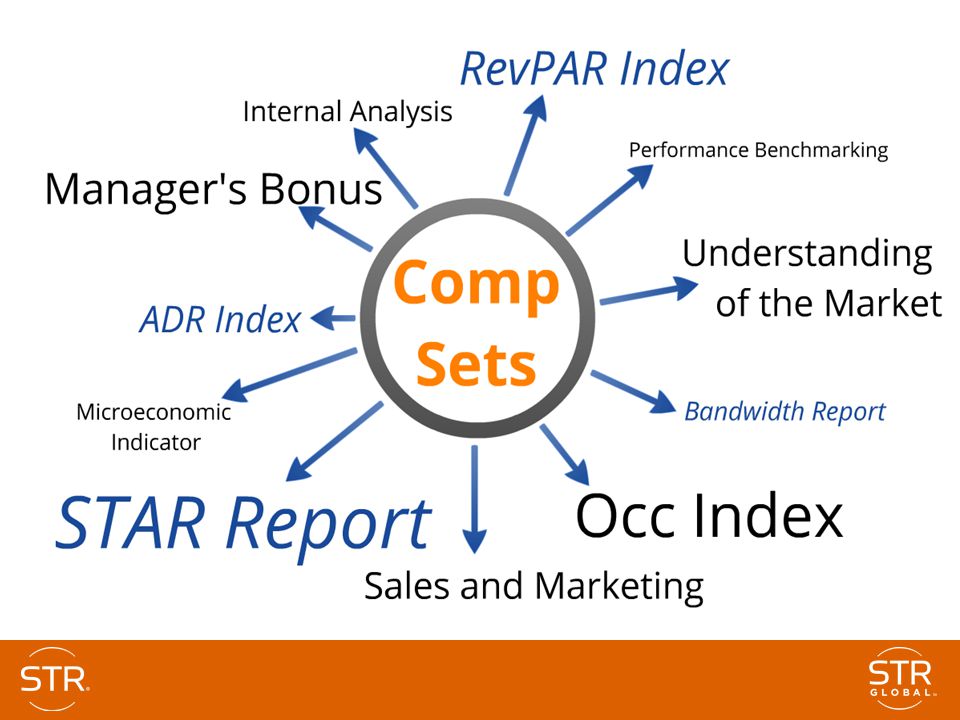
How are Comp Sets used? Comp sets have an impact on several functions of a hotel from the day-to-day operations to managerial and top-level decisions Comp set uses include, but are not limited to the following: compare to the subject property for performance benchmarking purposes Aide the sales and marketing department Use in management contracts for performance requirements (often determines the amount of compensation managers receive) Use for internal and external analysis (microeconomic) Copyright 2011 Smith Travel Research
 Use for internal and external analysis (microeconomic) Copyright 2011 Smith Travel Research.")
120
Why are Comp Sets needed?
Historically, hoteliers have relied on each other for performance information (price, quality, quantity etc.) Hotel staff would perform “call arounds” where they would talk to staff from competitive hotels They might also count cars in parking lots or windows with lights on There is no way of assuring whether entities are being honest with each other, or whether their information is pertinent or relevant to that of the seekers Copyright 2011 Smith Travel Research
 Hotel staff would perform call arounds where they would talk to staff from competitive hotels. They might also count cars in parking lots or windows with lights on. There is no way of assuring whether entities are being honest with each other, or whether their information is pertinent or relevant to that of the seekers. Copyright 2011 Smith Travel Research.")
121
Why Comp Sets? - continued
In the late 1980s, STR began collecting performance data from hotels and coined the term “comp set” within the hotel industry. STR essentially became a safe place for hotels to get accurate aggregate information about their set of competitors Aggregating means finding the averages based on the data from a group of hotels so that each individual hotel is protected from exploitation of their specific data No individual property data is ever disclosed to another property Copyright 2011 Smith Travel Research

122
Why Comp Sets? - continued
Despite attempts throughout history to prevent anti- competitive acts, such as the Sherman Antitrust Act as long ago as 1890, anti-competition actions are still committed today within the hotel industry Perhaps the most recent case involved five La Quinta hotels in Connecticut in April 2010: The Attorney General released a statement describing how calling around to collect current prices and occupancy rates with the intent to adjust one’s own rates is illegal and must be stopped. The Attorney General commended La Quinta for formally halting their use of “call-arounds” across all of their hotels. During the investigation, it was found that “call-arounds” are common practice among many hotels within the industry. Copyright 2011 Smith Travel Research

123
Snapshot of a Press Release Regarding Hotel Call-Arounds

124
Why Comp Sets? - continued
The same statement from the Attorney General recognized that STR Reports were a legitimate means of doing business: The agreement to cease Call-Arounds shall not (i) limit the ability of the LQ Parties … to review, consult, and participate in commercially available industry reports e.g., Smith Travel Reports …. Copyright 2011 Smith Travel Research
 limit the ability of the LQ Parties … to review, consult, and participate in commercially available industry reports e.g., Smith Travel Reports …. Copyright 2011 Smith Travel Research.")
125
When are Comp Sets created?
Competitive sets are created by the time the hotel opens. Sometimes comp sets are created long before the hotel opens while it is still under construction. The hotel can select a competitive set and can receive an “Under Construction” STAR Report. That way the new hotel staff can track the performance of the comp set prior to the opening of the hotel. Copyright 2011 Smith Travel Research

127
Who chooses the Comp Set?
There are many stakeholders when choosing a comp set: Management company GM Brand Company The sales and marketing team As you can imagine, each of these different entities have different goals when it comes to comp sets: For example: someone might choose to include a “dog” property in the set (a property of lower quality, chain scale and/or lower ADR or Occ) in order to inflate their property’s performance metrics (RevPAR Index, ADR Index) Copyright 2011 Smith Travel Research
 in order to inflate their property’s performance metrics (RevPAR Index, ADR Index) Copyright 2011 Smith Travel Research.")
129
Who chooses the Comp Set? - continued
In addition, some brands have a say in choosing comp sets by setting brand standards for comp sets. These standards may involve: Including/excluding specific brands Including/excluding different properties of the same brand choosing properties within specific radial distance choosing properties within specific chain scales Copyright 2011 Smith Travel Research

130
Rules related to creating Comp Sets
STR has a set of rules when it comes to creating competitive sets The first rule relates to “sufficiency”. Comp sets must include three hotels in addition to the subject Hotels are encouraged to have four or more so that if a hotel does not report for a time period for some reason, the comp set data will still appear

131
Comp Sets Rules - continued
The second set of rules relate to “percentage checks” and help to ensure that the data of a single hotel, brand or company is not isolated. When percentages are calculated the rooms of the subject hotel are excluded. No single property or brand (e.g. Holiday Inn, Comfort Inn, etc.) can account for more than 40% of the total participating room supply of a competitive set (50% outside North America) No single company (e.g. Starwood, Choice, Interstate, Host) can account for more than 60% of the total participating room supply of a competitive set
 can account for more than 40% of the total participating room supply of a competitive set (50% outside North America) No single company (e.g. Starwood, Choice, Interstate, Host) can account for more than 60% of the total participating room supply of a competitive set.")
132
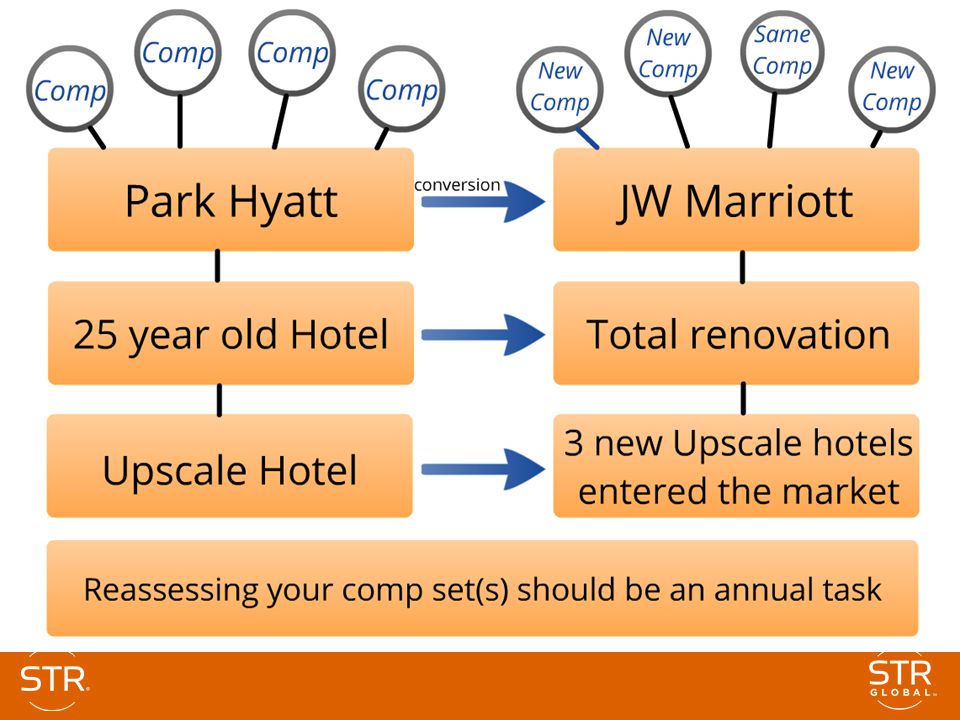
When are Comp Sets changed?
Comp sets may need to be changed due to: Changes in the subject hotel, i.e.: renovation, conversion, new mgtco or owner, contract changes Changes in the market, i.e.: new competitive hotels open Strategic changes, i.e.: repositioning, improving comp set strength Some companies make changes at specific times of the year Copyright 2011 Smith Travel Research

133
Rules related to changing Comp Sets
STR has rules related to changes that address “isolation” issues. If a property wishes to change their comp set, they must do so by a net change of two properties. They can add two hotels, remove two (as long as they don’t go below three remaining hotels) or they could add one and remove one. The two properties must be in a different chain, parent company and management company from the subject hotel. Copyright 2011 Smith Travel Research
 or they could add one and remove one. The two properties must be in a different chain, parent company and management company from the subject hotel. Copyright 2011 Smith Travel Research.")
134
Changing Comp Sets Rules continued
These rules ensure that a single property’s data is never isolated. The exceptions to the “rule of two” is that a hotel can add a brand new property which has been open less than six months Or a hotel can remove a property from its comp set that has stopped participating after three months. Copyright 2011 Smith Travel Research

135
Additional Comp Sets There are many cases where hotels have more than one comp set. Multiple comp sets can serve different benchmarking purposes. Hotels with multiple comp sets could have various key competitive features and/or unique qualities. When a hotel changes its comp set, they may elect to keep the old on for a period of time to provide perspective. A second comp set must differ from the primary comp set by at least two properties. The same rules apply as for changes. Copyright 2011 Smith Travel Research

136
Reasons for Additional Comp Sets
There are a wide variety of reasons for additional comp sets: Local versus Regional – one set nearby and another farther away Subject hotel is between two markets or cities Aspirational – second set for hotels of higher quality or performance level Different sets focusing on different brands Different set for special niche (conference, water park, boutique) Index-focused (aiming to achieve a specific index) Different sets for Weekday/Weekend or Group/Transient mix Different entities may not agree – brand versus management company An old comp set is linked to a prior contract Hotel wants to be compared to a different industry segment
 Index-focused (aiming to achieve a specific index) Different sets for Weekday/Weekend or Group/Transient mix. Different entities may not agree – brand versus management company. An old comp set is linked to a prior contract. Hotel wants to be compared to a different industry segment.")
137
Benchmarking at the Corporate Level
Companies benchmark the performance of their portfolio in a variety of manners Companies may compare their own hotels to all of their competitive sets They may compare the performance of a brand to the respective scale, i.e. all of the other similar brands in the same scale They may also create a “corporate comp set” and compare their brand to a user-defined group of brands that they feel they compete most closely with Copyright 2011 Smith Travel Research

138
Questions Briefly define benchmarking as it relates to the hotel industry Explain how hotels perform benchmarking Identify the rules related to creating a comp set Identify the rules related to changing a comp set Why do hotels have multiple comp sets? Briefly describe how companies perform benchmarking Copyright 2011 Smith Travel Research

139
Questions? Steve Hood , extension 3315

Similar presentations