Download presentation
Presentation is loading. Please wait.

1
Evolution Learning Targets 1-17

2
Guided Reading Review

3
Charles Darwin HMS Beagle Born in England in 1809
LT 1 HMS Beagle Born in England in 1809 A Naturalist (studied nature) Took a 5yr voyage on a ship called the HMS Beagle to study the organisms encountered on the journey Traveled to the Galapagos Islands near S. America Here he made many observations about the organisms he saw there; including tortoises and finches
 Took a 5yr voyage on a ship called the HMS Beagle to study the organisms encountered on the journey. Traveled to the Galapagos Islands near S. America. Here he made many observations about the organisms he saw there; including tortoises and finches.")
4
Darwin’s Observations
Each island of the Galapagos have a different climate. Found that tortoises had different shells depending on the island they inhabited Found that finches had different beaks He also found fossils similar to living organisms and some like he had never seen before

5
The Ride Home After leaving the Galapagos Islands, Darwin had a few questions. Why do organisms have differences based on their habitat? Why had so many species disappeared? How are they related to those still living? Were similar organisms formerly the same species?

6
Guided Reading Review

7
LT 2 Other Old Dead Dudes Darwin, being a good scientist, studied the works of other scientists in and outside of his field. Malthus HMS Beagle Economist Darwin Hutton Lamarck Naturalist Lyell Geologists

8
What everyone else thought
What Darwin Concluded Charles Darwin What everyone else thought From Hutton and Lyell: If the Earth can change, can life also change? Geological processes take a long time, therefore the Earth must be old. From Malthus: That organisms will have more offspring than will die and this will lead to competition. Not all offspring live so what makes some survive and others die? The Earth was made as it was now and did not change The Earth is only a few thousand years old Organisms don’t change **Darwin’s conclusions caused a BIG buzz**

9
Guided Reading Review

10
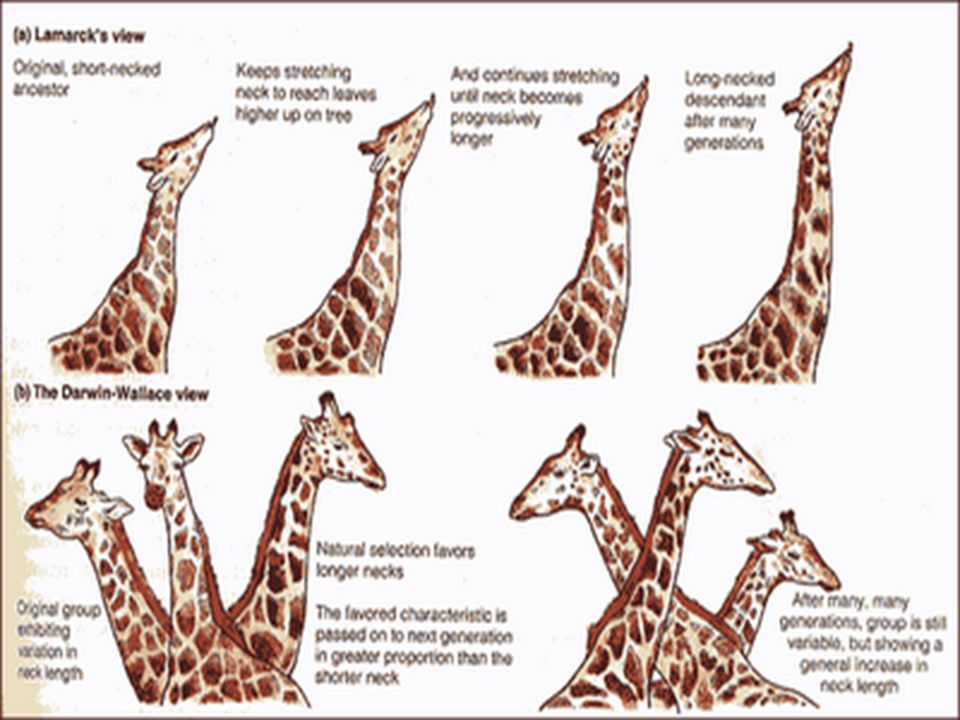
That Other Guy Jean Baptiste Lamarck
All living things change over time Living things descend from other living things Organisms adapt to their environment Selective USE or DISUSE of organs will cause organisms to gain or lose the trait during their lifetime Traits lost or gained will be passed onto the organism’s offspring. Loss or acquisition of a trait is to move toward being perfect and better suited for their environments Jean Baptiste Lamarck

11
Lamarck

12
Guided Reading Review

13
Darwin’s Idea Knowing that his ideas were not going to be well received, Darwin wrote a book called On the Origin of Species, but did not publish it for a long time. His idea was… Natural Selection (nature “selects” organisms to survive based on the most favorable trait for the environment) Every species has variations within a trait and the variations are IMPORTANT Some of the traits were inheritable Those organisms that have favorable traits (ADAPTATIONS) will survive and go on to have more offspring (FITNESS) SURVIVAL OF THE FITTEST Over many generations, an adaptation could spread throughout the entire species. In this way, according to Darwin, evolution by natural selection would occur.
 Every species has variations within a trait and the variations are IMPORTANT. Some of the traits were inheritable. Those organisms that have favorable traits (ADAPTATIONS) will survive and go on to have more offspring (FITNESS) SURVIVAL OF THE FITTEST. Over many generations, an adaptation could spread throughout the entire species. In this way, according to Darwin, evolution by natural selection would occur.")
15
Noodle Worms Post “Noodle Worm Lab” we can say…
Variations do exist within the population (green, orange, white worms)-Where did it come from? Why Genetics, silly! Some worms did struggled to survive. Those that did live were best suited or “most fit” and possess a color characteristic that makes them more likely to survive. Those that survived can pass their characteristic to the next generations (a.k.a descending with modifications)
-Where did it come from Why Genetics, silly! Some worms did struggled to survive. Those that did live were best suited or most fit and possess a color characteristic that makes them more likely to survive. Those that survived can pass their characteristic to the next generations (a.k.a descending with modifications)")
16
Variations So do variations exist in all populations?
How do they go from parent to offspring? Meiosis Cells copy DNA Crossing over events take place in Prophase I Fertilization from SEXUAL reproduction Egg + Sperm Individual sets of chromosomes combine to form offspring with features unique from either parent

18
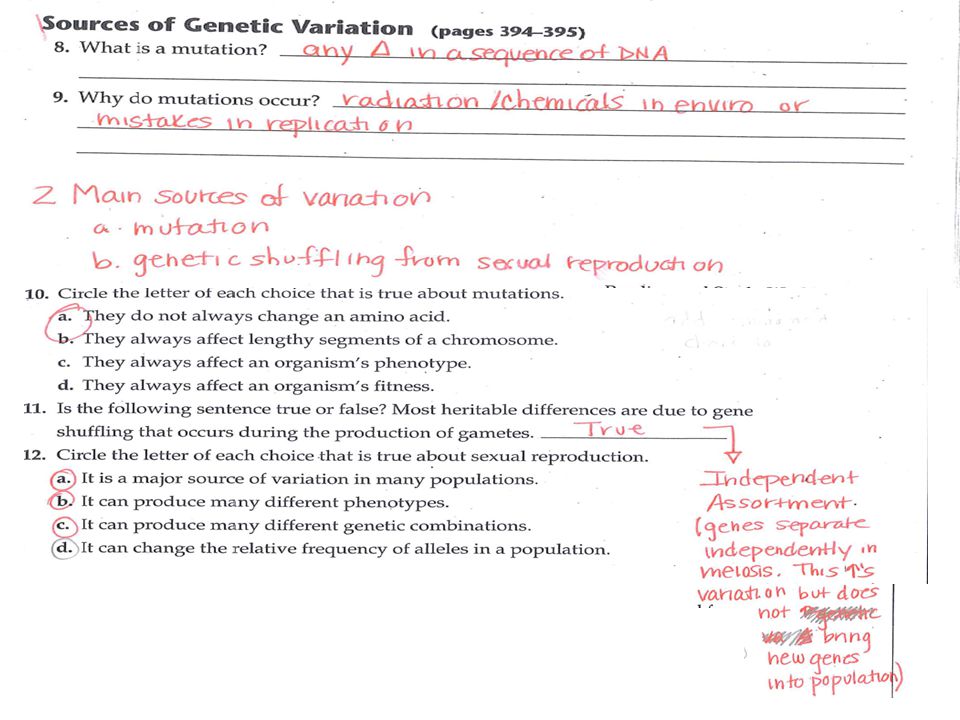
Variations Mutations Give new genetic material to the gene pool
By Chance, radiation, and chemicals Give new genetic material to the gene pool Genetic Drift Migration/Gene Flow All of these forces change GENOTYPES, PHENOTYPES, and determine the amount of GENETIC VARIATION

20
Variations Gene pool – all members of an interbreeding population who bring genetic variety to the population. So all the BB, Bb, or bb in the buffalo herd Relative frequency – percentage of time a particular allele appears in the gene pool compared to other alleles What is the % of B’s to the % of b’s in the buffalo herd

22
Putting It All Together
Evolution (Darwin) 1859 Genetics (Mendel) Mid 1800’s DNA (Watson & Crick) 1963 Current Understanding of Biological Evolution
 Genetics. (Mendel) Mid 1800’s. DNA. (Watson & Crick) Current Understanding of Biological Evolution.")
23
Putting It All Together
Okay, then…so, Based on the Mouse WS and the Moths Activity, Evolution – a change in the relative frequency of alleles in a population over time Evolutionary fitness – the success with which an individual can pass their traits to the next generation Therefore, POPULATIONS, NOT INDIVIDUALS, evolve

24
Putting It All Together
Evolution NEVER acts DIRECTLY on ONE GENE. Evolution works on the entire organism If the organism has evolutionary fitness and Reproduces = gene(s) in the gene pool Does not reproduce = NO gene(s) in the gene pool
 in the gene pool. Does not reproduce = NO gene(s) in the gene pool.")
25
NS on a Single Gene Trait
Single gene trait – one gene controls a trait. Only two phenotypes (Widow’s peak or no widow’s peak) Three genotypes (WW, Ww or ww) Two alleles (W and w) in this example Natural selection can work on each phenotype and change the allelic frequency
 Three genotypes (WW, Ww or ww) Two alleles (W and w) in this example. Natural selection can work on. each phenotype and change. the allelic frequency.")
26
NS on a Polygenic Trait Polygenic Trait- when a trait is controlled by more than one gene A range of phenotypes (a bell curve) Many genotypes At least two alleles per gene Natural selection effect is more complex fitness of individual close on curve is similar fitness of individuals further apart is varied. This is where NS can act.

27
NS on a Polygenic Trait Three Effects on Phenotypes
Directional Selection - when one end of the curve has higher fitness than the middle or other end of the curve *Shifts the curve left or right* Peccaries eat cacti. Cacti with fewer spines are eaten first. Thus, the cacti with more spines fair better . NS moves the curve toward cacti that make many spines

28
NS on a Polygenic Trait 2. Stabilizing Selection – when individuals in the middle of the curve have higher fitness than those on the ends. *Narrows the graph* Peccaries continue to eat the cacti with few spines (left of graph). A parasitic insect lays its eggs at the cacti spine base and therefore loves cacti with lots of spines (right of graph). Both extremes are NOT fit. Being in the middle is best
. A parasitic insect lays its eggs at the cacti spine base and therefore loves cacti with lots of spines (right of graph). Both extremes are NOT fit. Being in the middle is best.")
29
NS on a Polygenic Trait 3. Disruptive Selection – when individuals at the upper and lower ends of the curve have higher fitness *Creates 2 peaks in graph /phenotype* A road through the desert brings tourists that love to pick cacti as souvenirs. Too few spines on the cacti look bad and too many spines are hard to pick. Thus, cacti with spine numbers in the middle are picked.

30
Other Factors of Evolutionary Change
4. Genetic Drift Variation (crossing over, meiosis, sexual reproduction, and mutations) 5. Migration Natural Selection Note…NS does not create variation, it just works on it Evolutionary Change
 5. Migration. Natural Selection. Note…NS does not create variation, it just works on it. Evolutionary Change.")
31
Genetic Drift LT 6 Genetic drift – is evolution BY CHANCE!; changes in a population that result from random chance or “luck” Luck ≠ evolutionary fitness Luck ≠ “better” Affects all populations Natural selection produces adaptations, Genetic Drift does not Genes of one generation do not wind up in identical ratios in the next generation, but…it’s still evolution!

32
Genetic Drift By random chance, the brown frogs die
Their genes are thus unable to be passed to the next generation Thus the gray and greens are the only ones able to mate and pass on genes. Variation is thereby decreased

33
Genetic Drift Effects of Genetic Drift:
A decrease in variation within a population/change in the relative frequency May decrease a populations ability to respond to selection pressures Acts FASTER and is more DRAMATIC in small populations Very bad for rare or endangered species Can cause new species to emerge

34
Genetic Drift Population bottleneck – a decrease in population size for at least one generation Causes a decrease in variation Worse for small populations (even if for a short time) Makes responding to selective pressures harder Causes: Overhunting Environmental Disaster (hurricane, flood, etc) Habitat Destruction
 Makes responding to selective pressures harder. Causes: Overhunting. Environmental Disaster (hurricane, flood, etc) Habitat Destruction.")
35
Genetic Drift Founder Effect – when a portion of an original population breaks off and form a new population. Also decreases variability because the small group may not be equally representative of the larger population’s variability

36
When does this happen? Under what conditions?
Hardy-Weinburg LT 7 Recall that evolution -is the change in the relative frequency of alleles in a population over time. Versus Genetic equilibrium - No evolution – no changes in the relative frequency When does this happen? Under what conditions?

37
Hardy-Weinburg A: The relative frequency of alleles in a population will remain constant UNLESS 1 or more factors cause the frequency to change. Five Conditions for GE: Random Mating equal opportunity for all member to produce young. This is rarely random! The population is large this decrease the effects of genetic drift

38
Hardy-Weinburg No immigration or emigration No mutations
Immigration = new individuals move in and bring new alleles and variety Emigration = individuals leave the population and take allelic variety with them No mutations No natural selection All genotypes have equal probability for survival

39
Hardy-Weinburg p2 + 2pq + q2 = 1 p + q = 1 Where p = dom. allele freq
For some populations these conditions are met, or nearly met, for long periods of time. Conditions met = genetic equilibrium Conditions not met = evolution There are two equations that can be used to show changes. p2 + 2pq + q2 = 1 p + q = 1 Where p = dom. allele freq and q = rec. allele freq

40
Geologic Time & Evidence for Evolution
LT 9-13 Please see the Guided Reading Posted to the website for the answers and “notes” for Geologic Time and Evidence for Evolution (LT 9-13)
")
41
Cladograms LT 9-13 Let’s see one made Cladogram – a diagram that shows evolutionary relationships among groups Based on phylogeny (the study of evolutionary relationships) Sometimes called a phylogenic tree (although the two vary slightly) Cladistics - the practice of looking at “innovations,” or newer features, that serve some kind of purpose Derived characteristics – new features that appear in later generations but not earlier ones
 Sometimes called a phylogenic tree (although the two vary slightly) Cladistics - the practice of looking at innovations, or newer features, that serve some kind of purpose. Derived characteristics – new features that appear in later generations but not earlier ones.")
42
Cladogram 1. ______ Wings 2. ______ 6 Legs 3. ______ Segmented Body 4. ______ Double set of wings 5. ______ Jumping Legs 6. ______ Crushing mouthparts 7. ______ Legs 8. ______ Curly Antennae

43
Cladograms To make a cladogram, you must first look at the animals you are studying and establish characteristics that they share and ones that are unique to each group. For the animals on the table, indicate whether the characteristic is present or not. Based on that chart, create a cladogram like the one pictured above. Cells Backbone Legs Hair Opposable Thumbs Tiger Slug Frog Catfish Human

44
Speciation LT 14

45
Extinction 99% of all life that has ever existed is now extinct
LT 15 99% of all life that has ever existed is now extinct mass extinctions have occurred many times in the Earth’s history Extinctions indicate… Organisms who were selected against by nature A failure to adapt A collapse in an organism’s environment they could not help

46
Extinction What becomes of those organisms that live (evolutionarily speaking, of course)? When large groups of organisms die, it leaves habitats and niches open for others to move into. New habitats can also have new selective pressures that will work on organisms. This could cause evolution within a species OR Adaptive radiation – a species has evolved from a common ancestor into diverse forms that live in different ways

47
Types of Evolution LT 16 A. Divergent Evolution-when selective pressures cause two species to form (think speciation) B. Convergent Evolution-takes place when species of different ancestry begin to share similar traits because of a shared environment or other selection pressure. C. Co-evolution- organism of different species but have a close relationship and evolve together

48
Rates of Evolution LT 17 Darwin believed evolution was a SLOW process; Gradualism Modern Biologist think that some evolution is slow and other times long periods of equilibrium are followed by RAPID evolution-Punctuated Equilibrium

Similar presentations


 an English scientist considered the founder of the evolutionary.>")
