Download presentation
Presentation is loading. Please wait.

1
Topic 5 Bridging the Development Gap
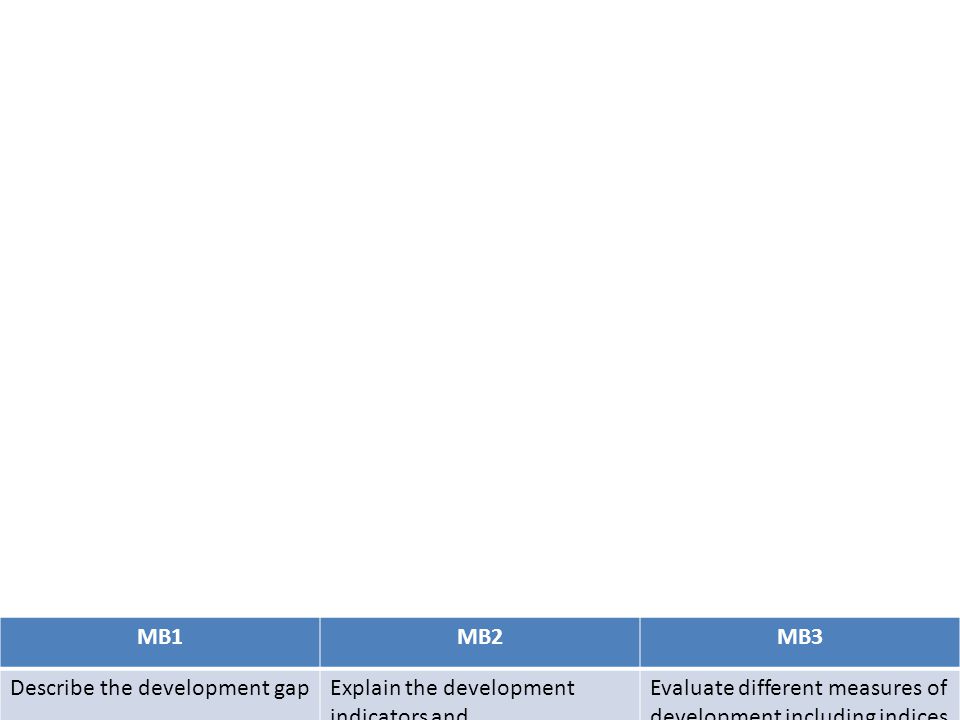
MB1 MB2 MB3 Describe the development gap Explain the development indicators and Evaluate different measures of development including indices

2
How is this unit examined?
2 ½ hour written exam, including pre-released synoptic resources (4 weeks in advance) Part 1 – 5 out of 6 topics Part 2 – 6th topic in a synoptic context (will pull together aspects of the other 5 topics) 30% of A level
 Part 1 – 5 out of 6 topics Part 2 – 6th topic in a synoptic context (will pull together aspects of the other 5 topics) 30% of A level")
3
5.1 What is the nature of the development gap? How has it arisen?
What is the development gap? What would a developed country be like? What would an undeveloped country be like? So what is development?

5
Starter Using your mini whiteboards suggest the following:
What is the development gap? How do we measure development? What indicators can we use?

6
Development What is Development?
Not just the difference between the developed, rich and powerful countries and those less developed. Within each country there are differing levels of prosperity and development What is it measured by? GNP HDI – Human development Index 0-1, 1 being best – uses income per capita, adult literacy, life expectancy. Development Indicators

7
Explaining development
Do you remember the food crisis of 2008?

8
Explaining development
Do you remember the food crisis of 2008? This is probably because you were well-sheltered from the worst because we live in a developed country. p179

10
Global food crisis Which of the following are real causes for the rise in food prices since 2006: Growth of biofuels Rising demand in NICs Climate change Rising demand for cattle feed Diseases wiping out crops Traders hoarding food Rising oil prices Change in agricultural policies Extreme weather Globalisation

11
Global food crisis Which of the following are real causes for the rise in food prices since 2006: Growth of biofuels Rising demand in NICs Rising demand for cattle feed Traders hoarding food Rising oil prices Change in agricultural policies Extreme weather

13
The food price crisis shows how susceptible less-developed countries are to price rises.
What happened to food prices in 2008? Why was this? Using the Philippines as an example, explain how a development gap was shown by the way in which the food crisis affected its people. What is the development gap?

14
5.1 What is the nature of the development gap? How has it arisen?
How can we measure it? Take a map and show the north-south divide line (Brandt line).
.")
15
The development gap The geography of the development gap is more complex than a simple ‘North-South divide’ Latin America has HDI levels similar to eastern Europe; China’s HDI and some others in SE Asia are relatively high South Asia has a concentration of levels below 0.6 Level in the Middle East are relatively high, although not in Yemen, Syria and Iraq The picture for Africa is very complex, with the extreme north and south having decent HDI levels, but some regions with shockingly low numbers

16
Development Indicators?
How can we accurately measure development between countries?

17
Development Indicators?

18
What is this map showing?

19
Life expectancy

20
Infant mortality

21
Under-nourishment

22
Burgernomics THE ECONOMIST's Big Mac index is based on the theory of purchasing-power parity: in the long run, exchange rates should adjust to equal the price of a basket of goods and services in different countries. This particular basket holds a McDonald's Big Mac, whose price around the world we compared with its American average of $4.20.

24
Understanding indicators…
Take an atlas ands find 10 contrasting countries. Analyse them using 5 development indicators. Rank them according to each indicators and add up the totals. The least scores shows the most developed

25
graph

26
Measuring development
Measuring development levels is a challenge. Traditionally development has measured using economic data such as GDP or GNI per capita. These measures fail to recognise: Income distribution The local value of money The non-money economy e.g. barter and exchange It is also important to recognise that development has social and quality of life aspects Measures such as life expectancy, education level, access to sanitation are important This basket of goods costs 112 Indian Rupees in India, the equivalent of £1.50*. To buy the same basket of goods in the UK would cost around £6. The difference in how much goods and services really cost, is why PPP (purchasing power parity) GDP income is used rather than ‘raw’ GDP. Using raw GDP per capita average income in India is about $1000, but PPP GDP per capita income is $2800 *data for Dec 2009
 GDP income is used rather than ‘raw’ GDP. Using raw GDP per capita average income in India is about $1000, but PPP GDP per capita income is $2800. *data for Dec")
27
As the development cable model (right) shows, development is a multi-faceted process
At its core is economic development, but to achieve real progress social, political, environmental and personal development is also needed. Recognising the complex nature of development is why development is often measured using an index, which combines a range of data Indices are considered more accurate than single data points such as GDP per capita. Physical Quality of Life Index (PQLI) Life expectancy + Literacy rate + Infant Mortality rate The Human Development Index (HDI) Life expectancy at birth + Literacy rate + Enrolment rate + GDP per capita PPP
 Life expectancy + Literacy rate + Infant Mortality rate. The Human Development Index (HDI) Life expectancy at birth + Literacy rate + Enrolment rate + GDP per capita PPP.")
28
Measuring development:
Explain what they are and how each measurement works GDP GNI PPP HDI Which is the best method in your opinion? Explain why.

30
Make up and perfumes in the world
Have you ever thought how much is spent in the world on basic needs and luxuries? How much would it cost to: How much is spent on: Make up and perfumes in the world every year? Eliminate world hunger? $19 billion $33 billion Clean water for everyone? Ocean cruises $10 billion $14 billion Provide the ability for everyone to read and write? Ice cream in Europe every year $11 billion $5 billion

31
Measuring development:
Explain what they are and how each measurement works GDP GNI PPP HDI Which is the best method in your opinion? Explain why. Why is the situation more complex today? The Human Development Index (HDI) Life expectancy at birth + Literacy rate + Enrolment rate + GDP per capita PPP Physical Quality of Life Index (PQLI) Life expectancy + Literacy rate + Infant Mortality rate
 Life expectancy at birth + Literacy rate + Enrolment rate + GDP per capita PPP. Physical Quality of Life Index (PQLI) Life expectancy + Literacy rate + Infant Mortality rate.")
33
Awe can also measure development through looking at the progress towards Millennium development Goals - Are MDGs a better measure?

34
Is the development gap widening or becoming narrower – what do you think?

35
The development gap ... ... is the difference in levels of social well-being and economic development between the poorest and the richest people on the planet ... is the divide between rich and poor or the ‘haves’ and the ‘have-nots’ ... can exist on different scales ... involves social and economic differences

36
Using Worldmapper 2 Map 171 – Wealth Growth
Territory size shows the proportion of worldwide growth in wealth that occurred there between 1975 and 2002 Source: © Copyright 2006 SASI Group (University of Sheffield) and Mark Newman (University of Michigan)
 and Mark Newman (University of Michigan)")
37
Using Worldmapper 3 Map 172 – Wealth Decline
Territory size shows the proportion of worldwide decline in wealth that occurred there between 1975 and 2002 Source: © Copyright 2006 SASI Group (University of Sheffield) and Mark Newman (University of Michigan)
 and Mark Newman (University of Michigan)")
38
Using Worldmapper 4 Map 173 – Human Development
Territory size shows the proportion of worldwide human development of the total world population (population multiplied by Human Development Index), found there. Source: © Copyright 2006 SASI Group (University of Sheffield) and Mark Newman (University of Michigan)
, found there. Source: © Copyright 2006 SASI Group (University of Sheffield) and Mark Newman (University of Michigan)")
39
Using Worldmapper 5 Map 175– Development Increase
Territory size shows the proportion of worldwide human development that occurred there between 1975 and 2002 (calculated by multiplying human development index by population) Source: © Copyright 2006 SASI Group (University of Sheffield) and Mark Newman (University of Michigan)
 Source: © Copyright 2006 SASI Group (University of Sheffield) and Mark Newman (University of Michigan)")
40
Using Worldmapper 6 Map 176 – Development Decrease
Territory size shows the proportion of worldwide human un-development that occurred there between 1975 and 2002 (calculated as the fall in Human Development Index multiplied by population) Source: © Copyright 2006 SASI Group (University of Sheffield) and Mark Newman (University of Michigan)
 Source: © Copyright 2006 SASI Group (University of Sheffield) and Mark Newman (University of Michigan)")
41
Is the development gap widening or becoming narrower – what do you think?
Yes – the development gap is narrowing, the world is becoming a better place No – the development gap is widening and the world is not becoming a better place Both – the development gap is widening and narrowing at the same time; it is different in different places

42
The development gap – the evidence
Narrowing There has been global development, particularly in Asia Many poorer countries, like China and India, are industrialising Widening Development in much of Africa has lagged behind, although the percentage of people in poverty has decreased actual numbers have increased as population has grown Worldwide, one billion people live on less than US$1 dollar a day There is an urban–rural divide in many countries, like Mexico Economic growth is increasing the divide between extreme wealth and poverty in some countries, like Brazil The gap between rich and poor people living in both richer and poorer countries is growing The development gap has narrowed for some people but not for others

48
Region Life expectancy Infant mortality Under-nourishment North America Western Europe Eurasia (Eastern Europe and CIS) Latin America and Caribbean Middle East and North Africa Sub-Saharan Africa Eastern Asia (China) South-East Asia and Pacific Rim South Asia (Indian sub-continent) Australasia
 South-East Asia and Pacific Rim. South Asia (Indian sub-continent) Australasia.")
49
How is the world more complex today than Brandt suggested in the 1980s?

Similar presentations


 GNP- Refers to the total value of all goods and services produced by a country.>")


