Download presentation
Presentation is loading. Please wait.

1
Predation (Chapter 15) Predator-prey cycles Physical Characteristics
Adaptations Functional vs. numeric responses Models of predation

2
What is Predation? – one species feeds on another enhances fitness of predator but reduces fitness of prey (+/– interaction)
")
3
Two big themes: Predators can limit prey populations.
*This keeps populations below K.

4
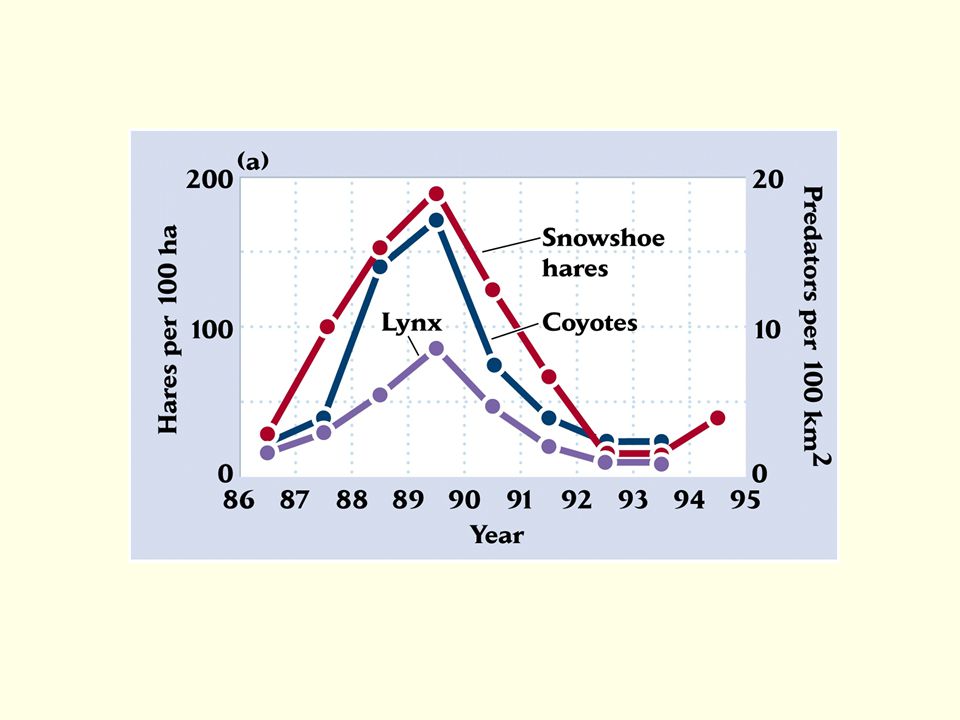
Predator and prey populations increase and decrease in regular cycles.

5
A verbal model of predator-prey cycles:
Predators eat prey and reduce their numbers Predators go hungry and decline in number With fewer predators, prey survive better and increase Increasing prey populations allow predators to increase And repeat…

6
Why don’t predators increase at the same time as the prey?

7
Factors promoting stability in predator-prey relationships
Inefficient predators (prey escaping) less efficient predators allow more prey to survive more living prey support more predators Outside factors limit populations higher death rate (d) for predators lower growth rate (r) for prey
 less efficient predators allow more prey to survive. more living prey support more predators. Outside factors limit populations. higher death rate (d) for predators. lower growth rate (r) for prey.")
8
Alternative food sources for the predator
less pressure on prey populations Refuges from predation at low prey densities prevents prey populations from falling too low Rapid numeric response of predators to changes in prey population

9
Huffaker’s Experiment on Predator-Prey Coexistence
2 mite species (1 predator and 1 prey) Initial experiments – predators drove prey extinct then went extinct themselves Adding barriers to dispersal allowed predators and prey to coexist.
 Initial experiments – predators drove prey extinct then went extinct themselves. Adding barriers to dispersal allowed predators and prey to coexist.")
10
Refuges from predation allow predator and prey to coexist.

11
Predator-prey cycles can be unstable
efficient predators can drive prey to extinction if the population moves away from the equilibrium, there is no force pulling the populations back to equilibrium eventually random oscillations will drive one or both species to extinction

13
Characteristics of Predators
Eye Position: Predators’ eyes face forward to give them a clear view of their prey

14
Predators’ Eye Position
Predators’ eyes face forward so they can see the animals they are chasing. This allows them to focus their vision on just the prey. They have great depth perception, so they can see how close or far away the prey is. Predators have their best vision in their binocular area because they are seeing the prey with both eyes. They don’t see the prey as well in their monocular areas because they can only see with the eye on that particular side.

15
Characteristics of Predators
2. Feet: Have sharp claws that the predators use to hold onto the prey while they are killing it

16
Characteristics of Predators
3. Teeth: Sharp, pointed teeth for grabbing and cutting their food. Predators don’t usually chew the meat completely. It is swallowed whole or in chunks

17
Characteristics of Prey
Eyes: Located on the side of the head so they can see if predators are approaching

18
Preys’ Eyes Preys’ eyes are located at the sides of the head, so they have good side and rear vision. Since prey spend most of their time eating grass and leaves, it is important for them to see to the side and rear without moving their heads to allow them to look out for predators and to eat at the same time. Prey have almost 360-degree vision. Prey have monocular vision, meaning they use each eye separately. This allows them to see two different objects on opposite sides of their bodies at the same time.

19
Characteristics of Prey
2. Feet: Made for running

20
Characteristics of Prey
3. Teeth: Flat teeth used to grind tough plant material Deer basically have two types of teeth. The front teeth, or incisors, are used for cutting the food. The back teeth, or premolars and molars - are used for chewing and grinding the food. Between the incisors and molars is an open space along the jaw that has no teeth.

21
Predator or Prey? By looking at an animal’s feet, eye position, and teeth a person can usually tell if an animal is a predator or prey. See if you can determine which of these animals are predators and which are prey. Remember to look at their feet and eye positions.

22
The Predator Becomes the Prey
Some animals can be both predators and prey. For example, a Texas horned lizard is a predator when it eats ants, termites, beetles, and grasshoppers. It is also a prey when it is eaten by snakes, bobcats, roadrunners and other birds such as hawks and loggerhead shrikes. A horned lizard is a prey when it is eaten by birds, snakes, wolves, bobcats, and coyotes. The horned lizard is a predator when it eat ants and other insects.

23
How has predation influenced evolution?
Adaptations to avoid being eaten: spines (cactii, porcupines) hard shells (clams, turtles) toxins (milkweeds, some newts) bad taste (monarch butterflies) camouflage aposematic colors mimicry
 hard shells (clams, turtles) toxins (milkweeds, some newts) bad taste (monarch butterflies) camouflage. aposematic colors. mimicry.")
24
Camouflage – blending in

25
Aposematic colors – warning

26
Is he crazy???

27
Mimicry – look like something that is dangerous
or tastes bad

28
Mimicry – look like something that is dangerous or tastes bad
Mullerian mimicry – convergence of several unpalatable species

29
Mimicry – look like something that is dangerous or tastes bad
Batesian mimicry – palatable species mimics an unpalatable species model mimic mimics model

30
Why are ecological interactions important?
Interactions can affect distribution and abundance.

31
Changing the number of prey can cause 2 types of responses:
Functional response – relationship between an individual predator’s food consumption and the density of prey Numeric response – change in the population of predators in response to prey availability

32
Type I functional response:
predators never satiate! no limit on the growth rate of predators!

33
Type II functional response:
– consumption rate increases at first, but eventually predators satiate (upper limit on consumption rate)
")
34
Type III functional response : consumption rate is low at low prey densities, increases, and then reaches an upper limit

35
Why type III functional response?
at low densities, prey may be able to hide, but at higher densities hiding spaces fill up predators may be more efficient at capturing more common prey predators may switch prey species as they become more/less abundant

36
Functional Responses of Predation
Number of Prey Consumed Density of Prey Population

37
Lotka-Volterra models describe predator and prey
population cycling. Real world predator and prey populations can cycle in size.

38
The Lotka-Volterra Model:
*Predicts oscillations in the abundances of predator and prey populations *Predator numbers lag behind those of their prey *Separate calculations for predators and prey

39
The Lotka-Volterra Model:
Assumptions Prey grow exponentially in the absence of predators. Predation is directly proportional to the product of prey and predator abundances (random encounters). Predator populations grow based on the number of prey. Death rates are independent of prey abundance.
. Predator populations grow based on the number of prey. Death rates are independent of prey abundance.")
40
The Lotka-Volterra Model
Variables: = change t = time V = # of prey individuals (“victims”) P = # of predator individuals r = exponential growth rate of prey c = capture efficiency of the predators
 P = # of predator individuals. r = exponential growth rate of prey. c = capture efficiency of the predators.")
41
The Lotka-Volterra Model
For the Prey: rate of change in the prey population intrinsic growth rate of the prey removal of prey by predators

42
The Lotka-Volterra Model
For the predators: a = efficiency with which prey consumption results in baby predators d = death rate of predators death rate of predators rate of change in the predator population conversion of prey into new predators

43
Equilibrium- state of balance between opposing forces
populations at equilibrium do not change Isocline- a line on a graph along which populations will not change over time

44
Equilibrium Isocline Prey population reaches equilibrium when ΔV/Δt = 0 Prey population stabilizes based on the size of the predator population Prey Isocline Predators (P) Number of r/c d/ac Number of prey (R)
 Number of. r/c. d/ac. Number of prey (R)")
45
Equilibrium Isocline Predator population reaches equilibrium when ΔP/Δt = 0 Predator population stabilizes based on the size of the prey population Predator isocline Predators (P) Number of d/ac Number of prey (R)
 Number of. d/ac. Number of prey (R)")
48
Predator-prey systems can have multiple stable states
Reducing the number of predators can lead to an outbreak of prey

49
Keystone species affect community structure
Predators can allow coexistence of competing prey Starfish predator Pisaster Next, I want to turn to how predator behavior can influence interactions between prey species In particular I want to ask, how can preference for a dominant competitor influence species coexistence? We might expect predators to show preference for dominant competitors over subordinate species. Why? What makes a dominant competitor? High intrinsic rate of increase, capacity to monopolize scarce resources, ergo relatively high abundance. What makes an energetically profitable prey source? all else being equal, relatively high abundance. Why, smaller search time. So, let’s see what happens to a prey community in the presence of a picky predator. We reach into our virtual zoo and pull out barnacles, (balanus), mussels (mytilus), and starfish (pisaster). This is the virtual inter tidal zone, where sea meets rocky shore. it, and this particular community, were made famous in a classic paper by Robert Paine in the mid-60s. Paine’s study was the first to experimentally manipulate species abundances as a way of testing the factors controlling community composition. you have the reference on a list we passed out in lab this week. competitors Barnacles Mussels Balanus Mytilus (Paine 1966)
, mussels (mytilus), and starfish (pisaster). This is the virtual inter tidal zone, where sea meets rocky shore. it, and this particular community, were made famous in a classic paper by Robert Paine in the mid-60s. Paine’s study was the first to experimentally manipulate species abundances as a way of testing the factors controlling community composition. you have the reference on a list we passed out in lab this week. competitors. Barnacles Mussels. Balanus. Mytilus. (Paine 1966)")
50
How can we test the effect of a predator on community structure?
Experiment - Remove the predator Starfish Pisaster Now let’s return the starfish to the community, and see how they affect the interaction between barnacles and mussels. run ecobeaker, keystone predator-2 prey note: show predator action table: specialist on mytilus with selective predation of the top competitor, the subordinate (barnacles) persists. What controls the population of the subordinate (barnacles) Intraspecific competition and interspecific competition. Watch squares. Barnacles Mussels Balanus Mytilus
 persists. What controls the population of the subordinate (barnacles) Intraspecific competition and interspecific competition. Watch squares. Barnacles Mussels. Balanus. Mytilus.")
51
Removal experiment - mussels are the dominant competitor
- competitive exclusion of barnacles starfish removed mussels % of inter- tidal zone Now let’s return the starfish to the community, and see how they affect the interaction between barnacles and mussels. run ecobeaker, keystone predator-2 prey note: show predator action table: specialist on mytilus with selective predation of the top competitor, the subordinate (barnacles) persists. What controls the population of the subordinate (barnacles) Intraspecific competition and interspecific competition. Watch squares. barnacles time
 persists. What controls the population of the subordinate (barnacles) Intraspecific competition and interspecific competition. Watch squares. barnacles. time.")
52
What is the effect of the predator on the structure of this community?
- starfish allow coexistence of competitors starfish removed mussels % of inter- tidal zone Now let’s return the starfish to the community, and see how they affect the interaction between barnacles and mussels. run ecobeaker, keystone predator-2 prey note: show predator action table: specialist on mytilus with selective predation of the top competitor, the subordinate (barnacles) persists. What controls the population of the subordinate (barnacles) Intraspecific competition and interspecific competition. Watch squares. barnacles time
 persists. What controls the population of the subordinate (barnacles) Intraspecific competition and interspecific competition. Watch squares. barnacles. time.")
53
How do starfish promote coexistence?
Pisaster Now let’s return the starfish to the community, and see how they affect the interaction between barnacles and mussels. run ecobeaker, keystone predator-2 prey note: show predator action table: specialist on mytilus with selective predation of the top competitor, the subordinate (barnacles) persists. What controls the population of the subordinate (barnacles) Intraspecific competition and interspecific competition. Watch squares. Barnacles Mussels Balanus Mytilus Starfish are picky – they prefer mussels (dominant competitor), which allows barnacles (weaker competitor) to coexist.
 persists. What controls the population of the subordinate (barnacles) Intraspecific competition and interspecific competition. Watch squares. Barnacles Mussels. Balanus. Mytilus. Starfish are picky – they prefer mussels (dominant competitor), which allows barnacles (weaker competitor) to coexist.")
54
Keystone species affect community structure
disproportionately to their abundance. Picky predators can promote coexistence among competing prey species. Competitive exclusion is prevented when the dominant competitor is the preferred prey.

Similar presentations


 Predator-prey cycles Models of predation>")


 involve interactions between same trophic level Predation involves interactions between trophic levels One species.>")
>")

>")


