Download presentation
Presentation is loading. Please wait.

1
The Atmosphere in Motion
Chapter 19

2
Air Pressure & Wind section 1
Horizontal movement of air Helps moderate surface temperatures Distributes moisture “cleanses” the atmosphere Several forces affect direction of movement Caused by differences in air pressure

3
What is Air Pressure? Weight of the air pushing down on Earth’s surface At sea level = 14.7 pounds per square inch (psi) At sea level, the barometric pressure is inches or millibars (mb). As increase elevation, pressure decreases b/c less air above Decreases ~50% every 5 km Exerted in all directions
. As increase elevation, pressure decreases b/c less air above. Decreases ~50% every 5 km. Exerted in all directions.")
4
Air Pressure With Altitude

5
Mercury Barometer Weight of column of mercury is balanced by the pressure exerted on the dish of mercury from air above

6
Aneroid Barometer & Barograph
Without liquid Partially evacuated metal chamber that compresses or expands based on outside pressure

7
Recording Air Pressure
Different units can be used to express air pressure With a mercury barometer Inches Millimeters Meteorologists use: millibars

8
You can easily change from inches to millibars

9
Why Does Air Pressure Change?
Elevation As altitude increases, pressure decreases Temperature As temperature increases, pressure decreases Molecules move further apart as air is heated So fewer air molecules than in same volume of cool air Warm air lower pressure, cold air high pressure Humidity As humidity increases, pressure decreases Water molecules have less mass than oxygen or nitrogen molecules

10
Why Does Air Pressure Change?
Changes in air pressure can aid in predicting the weather A decrease in pressure often indicates approaching warmer, more humid, air along w/ rain or snow Less dense air less pressure exerted An increase in pressure often indicates approaching cooler, drier air & fair weather More dense air more pressure exerted

11
Why Does Air Pressure Change?
Meteorologists analyze air pressure by plotting isobars on weather maps Isobar: line that joins points of equal barometric (air) pressure A “closed” isobar forms a loop on a weather map High-pressure area (“high”) Air pressure steadily increases toward the center of a set of closed isobars ~Think of a hill Low-pressure area (“low”) Air pressure steadily decreases toward the center of a set of closed isobars ~Think of a valley
 pressure. A closed isobar forms a loop on a weather map. High-pressure area ( high ) Air pressure steadily increases toward the center of a set of closed isobars. ~Think of a hill. Low-pressure area ( low ) Air pressure steadily decreases toward the center of a set of closed isobars. ~Think of a valley.")
12
Isobars

13
Pressure Gradient Pressure Gradient = change in pressure
change in distance The closer the isobars, the steeper the gradient Pressure changes quickly Faster, stronger winds The further the isobars, the more gentle the slope Pressure changes slowly Slower, weaker winds

14
What Makes the Wind Blow?
Differences in pressure caused by unequal heating of Earth’s surface -Winds blow from areas of High to Low pressure H L WIND Falling air Rising air (cold, dry = more dense) (warm, moist = less dense) Fair weather stormy weather High Pressure Low Pressure
 (warm, moist = less dense) Fair weather stormy weather. High Pressure Low Pressure.")
16
Measuring Surface Wind Direction & Speed
Wind vanes instrument to determine the direction of wind Broad tail Resists wind “Points away” from where the wind is blowing from Arrowhead Points into the wind (where the wind is blowing from) Winds are named for the direction from which they blow from Examples Blow from west (to east) = westerly (or west) wind Nor’easter = winds from the northeast
 Winds are named for the direction from which they blow from. Examples. Blow from west (to east) = westerly (or west) wind. Nor’easter = winds from the northeast.")
17
westerly wind

18
Measuring Surface Wind Direction & Speed
Anemometer instrument used to measure wind speeds 10 meters above ground Effects on water, smoke, trees, & other objects can also be used as estimates of wind speed.

19
Factors Affecting Winds section 2
The Coriolis Effect: the tendency of an object (wind, ocean current, plane, etc.) moving freely over the earth’s surface to curve away from its path of travel Due to Earth’s rotation Northern Hemisphere deflect to right (from perspective of object) Blow clockwise out of areas of high pressure Blow counterclockwise into areas of low pressure *****Diagrams Southern Hemisphere deflect to left (from perspective of object) Does not depend on object’s direction of movement Only noticeable on large scale (winds, planes, ocean currents) Greatest near poles, least near equator Increases if speed of object increases
 moving freely over the earth’s surface to curve away from its path of travel. Due to Earth’s rotation. Northern Hemisphere deflect to right (from perspective of object) Blow clockwise out of areas of high pressure. Blow counterclockwise into areas of low pressure. *****Diagrams. Southern Hemisphere deflect to left (from perspective of object) Does not depend on object’s direction of movement. Only noticeable on large scale (winds, planes, ocean currents) Greatest near poles, least near equator. Increases if speed of object increases.")
21
Coriolis Effect Animation
Coriolis Effect & Wind Direction Visualiziation

22
Friction Friction between the air & ground slows winds
Changes the impact of the Coriolis effect on surface winds More friction less “deflection”/curving Ex. rough land Less friction more “deflection”/curving Ex. smooth land or water Winds at higher altitudes less friction stronger Coriolis effect

23
Friction Jet Stream Video
Internet Investigation: How Does the Jet Stream Change Through the Year? Jet stream: Band of very fast winds ( km/hr) near the top of the troposphere (hardly affected by friction) Typically 1000s of km long, 100s of km wide, & about 1 km from top to bottom Polar-front jet stream: cool polar air joins w/ warmer air to the south Generally flows west to east Great effect on weather in the U. S. Energy for storms, directs storms’ paths Can reach to central FL in winter, generally over Canada and northern U.S. in summer Speed depends on pressure gradient in upper troposphere (depends on surface temps) Fastest in winter Tropical-easterly jet stream: warm air in tropics of N. Hemisphere Weaker than polar-front jet stream
 near the top of the troposphere (hardly affected by friction) Typically 1000s of km long, 100s of km wide, & about 1 km from top to bottom. Polar-front jet stream: cool polar air joins w/ warmer air to the south. Generally flows west to east. Great effect on weather in the U. S. Energy for storms, directs storms’ paths. Can reach to central FL in winter, generally over Canada and northern U.S. in summer. Speed depends on pressure gradient in upper troposphere (depends on surface temps) Fastest in winter. Tropical-easterly jet stream: warm air in tropics of N. Hemisphere. Weaker than polar-front jet stream.")
25
Global Wind Patterns sec 3
Affected by: ***Unequal heating of Earth by sunlight (temp diff btw equator & poles) ***Earth's rotation (spin) (& Coriolis effect) Location of continents Time of year Local topography (landforms)
 ***Earth s rotation (spin) (& Coriolis effect) Location of continents. Time of year. Local topography (landforms)")
26
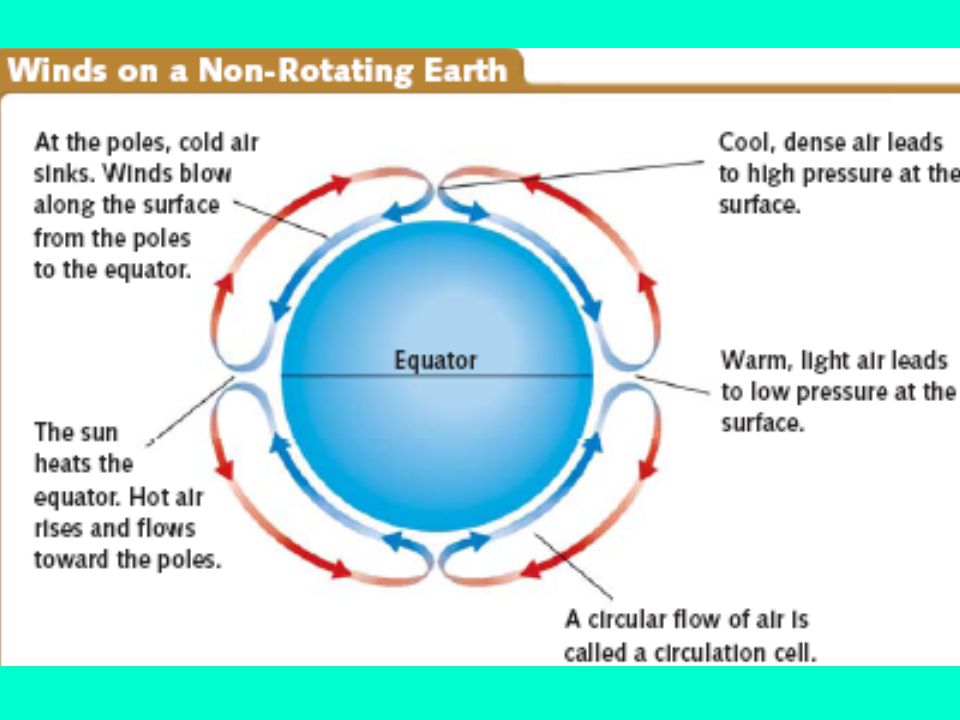
Global Wind Patterns What would happen if Earth did not rotate & there was no Coriolis effect? The unequal heating: makes the tropical equatorial regions warmer than the polar regions. lower pressure at the (warmer) equator Air rises & moves toward poles higher pressure at the (cold) poles Polar air moves toward equator ~heats, rises, & continues cycle Would result in one large circulation cell in each hemisphere
 equator. Air rises & moves toward poles. higher pressure at the (cold) poles. Polar air moves toward equator. ~heats, rises, & continues cycle. Would result in one large circulation cell in each hemisphere.")
28
Effects of Earth’s Rotation
B/c Earth rotates: Coriolis effect prevents air from flowing straight from equator to poles Air flowing northward from equator is deflected to right Air flowing southward from equator is deflected to left Air cools & sinks long before reaches polar regions Air circulation is better represented w/ 3-cells in each hemisphere Idealized, not 100% accurate, but helpful in understanding global wind patterns

29
Effects of Earth’s Rotation
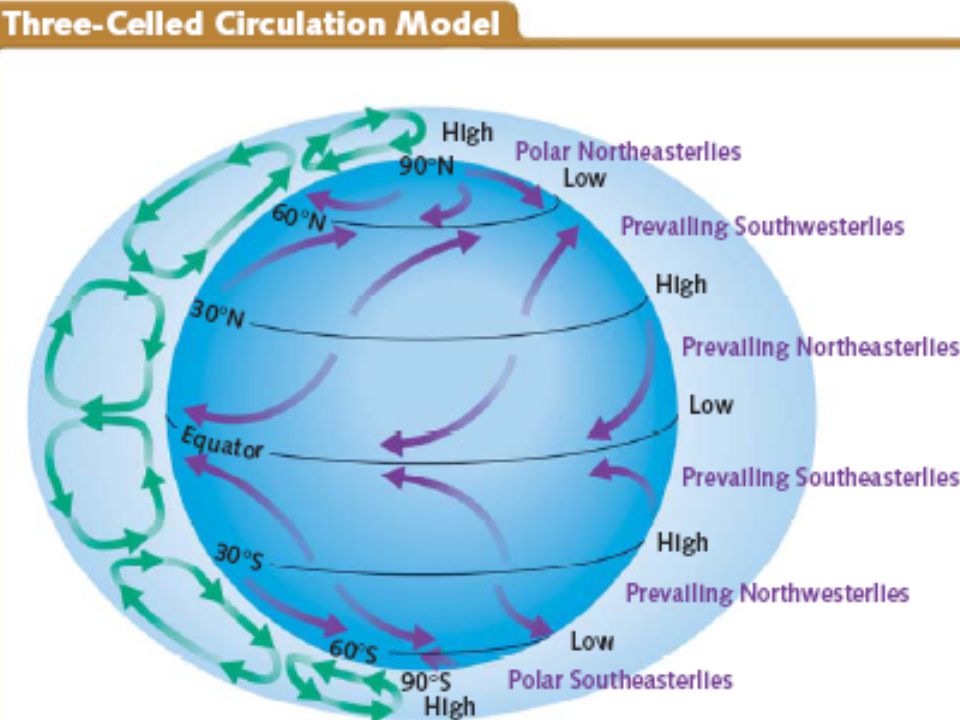
Three-Celled Circulation Model 3 circulation cells in each hemisphere 0 (equator)-30° 30-60° 60-90° (pole) Direction of circulation changes from each cell to the next Caused by alternating bands of high & low pressure at Earth’s surface Polar front = boundary at 60° where air flows away from high pressure poles & collides w/ warmer air moving up from lower latitudes As winds blow from high to low pressure, they are deflected by the Coriolis effect To right in northern hemisphere To left in southern hemisphere
-30° 30-60° 60-90° (pole) Direction of circulation changes from each cell to the next. Caused by alternating bands of high & low pressure at Earth’s surface. Polar front = boundary at 60° where air flows away from high pressure poles & collides w/ warmer air moving up from lower latitudes. As winds blow from high to low pressure, they are deflected by the Coriolis effect. To right in northern hemisphere. To left in southern hemisphere.")
31
Weaknesses of the Three-Celled Model
3 main weaknesses Gives a simplified view of circulation btw 30 & 60° Referred to as middle latitudes or mid-latitudes Most of the U. S. Surfaces winds determined by locations of transient high- & low-pressure systems Change often Does not take into account the effects of the continents (heat & cool more rapidly than oceans) or seasons Based on a simplified view of upper-level winds Impression that generally travel N S Primarily westerly (except near equator, Coriolis is weak)
 or seasons. Based on a simplified view of upper-level winds. Impression that generally travel N S. Primarily westerly (except near equator, Coriolis is weak)")
32
Strength of the Three-Celled Model
Fairly accurate image of general surface winds & pressures outside the mid-latitudes Gives a picture of wind patterns & pressure systems that is useful for climate studies b/c involves averaging patterns over long periods

33
Description of Wind & Pressure Belts
Intertropical Convergence Zone (ITCZ) or doldrums: a low pressure belt at the equator where winds from both hemispheres come together Little to no wind, hot & humid, rain is common Tradewinds: blow from the NE (N. Hemi) & SE (S. Hemi) are found at about 30º N & S Polar highs: high-pressure regions where cold air sinks at the poles Polar easterlies: surface winds at poles that blow from east Prevailing winds: winds that usually blow from same direction Tradewinds Polar easterlies Prevailing westerlies which blow (SW in N. Hemi & NW in S. Hemi) in the mid-latitudes.
 or doldrums: a low pressure belt at the equator where winds from both hemispheres come together. Little to no wind, hot & humid, rain is common. Tradewinds: blow from the NE (N. Hemi) & SE (S. Hemi) are found at about 30º N & S. Polar highs: high-pressure regions where cold air sinks at the poles. Polar easterlies: surface winds at poles that blow from east. Prevailing winds: winds that usually blow from same direction. Tradewinds. Polar easterlies. Prevailing westerlies which blow (SW in N. Hemi & NW in S. Hemi) in the mid-latitudes.")
34
Polar Front Polar Front

36
Continental & Local Winds Sec 4
Because of tilt of Earth, relative position of sun changes over year Causes seasons Temperature changes Changes in global winds Also affected by positions of continents Highest temps in N. Hemi often N of equator Sun causes air to heat, rise, & flow toward poles

37
Effects of Seasons & Continents
Summer continents hotter than oceans heats up (& cools down) faster than water b/c absorbs (& radiates) heat better hot land heats air above it, becomes less dense, rises, causing low pressure Oceans cooler than land Heats up (& cools down) slower than land b/c does not absorb (& radiate) heat quickly Cool water, air above cooler, more dense, higher pressure Highs & lows determine direction of prevailing winds at various locations Winter opposite from summer
 faster than water b/c absorbs (& radiates) heat better. hot land heats air above it, becomes less dense, rises, causing low pressure. Oceans cooler than land. Heats up (& cools down) slower than land b/c does not absorb (& radiate) heat quickly. Cool water, air above cooler, more dense, higher pressure. Highs & lows determine direction of prevailing winds at various locations. Winter opposite from summer.")
38
Direction of winds change seasonally monsoons
Most dramatic in southern Asia Winter cold, dry winds Summer warm, moist winds & heavy rains

39
Local Winds Extends 100 km or less
Caused mostly by differences in temperature Examples: Land & sea breezes Mountain & valley breezes

40
Developing a Sea Breeze
Daytime Land heats faster creating warm air above it. decreases the pressure (& density) air rises. low pressure develops over land Water heats slower, so it has cooler air above it. Increases pressure (& density) Air sinks High pressure develops over water causing a difference in pressure. Wind blows from high (sea) to low (land)
 air rises. low pressure develops over land. Water heats slower, so it has cooler air above it. Increases pressure (& density) Air sinks. High pressure develops over water causing a difference in pressure. Wind blows from high (sea) to low (land)")
41
Developing a Land Breeze
Nighttime Water stays warm longer creating warm air above it. decreases the pressure (& density) air rises. low pressure develops over water Land cools faster, so it has cooler air above it. Increases pressure (& density) Air sinks High pressure develops over land causing a difference in pressure. Wind blows from high (land) to low (sea)
 air rises. low pressure develops over water. Land cools faster, so it has cooler air above it. Increases pressure (& density) Air sinks. High pressure develops over land causing a difference in pressure. Wind blows from high (land) to low (sea)")
Similar presentations


>")


