Download presentation
Presentation is loading. Please wait.

1
Chapter 12 Inventory Management
McGraw-Hill/Irwin Copyright © 2009 by The McGraw-Hill Companies, Inc. All Rights Reserved.

2
Inventory Inventory Independent demand items A stock or store of goods
Items that are ready to be sold or used 12-2

3
Types of Inventory Raw materials and purchased parts Work-in-process
Finished goods inventories or merchandise Maintenance and repairs (MRO) inventory, tools and supplies Goods-in-transit to warehouses or customers (pipeline inventory) 12-3
 inventory, tools and supplies. Goods-in-transit to warehouses or customers (pipeline inventory)")
4
Inventory Functions Inventories serve a number of functions such as:
To meet anticipated customer demand To smooth production requirements To decouple operations To protect against stockouts To take advantage of order cycles To hedge against price increases To permit operations To take advantage of quantity discounts 12-4

5
Inventory Management Management has two basic functions concerning inventory: Establish a system for tracking items in inventory Make decisions about When to order How much to order 12-5
![]()
6
Effective Inventory Management
Requires: A system keep track of inventory A reliable forecast of demand Knowledge of lead time and lead time variability Reasonable estimates of holding costs ordering costs shortage costs A classification system for inventory items 12-6

7
Inventory Counting Systems
Periodic System Physical count of items in inventory made at periodic intervals Perpetual Inventory System System that keeps track of removals from inventory continuously, thus monitoring current levels of each item Two-bin system Two containers of inventory; reorder when the first is empty 12-7

8
Inventory Counting Technologies
Universal product code (UPC) Bar code printed on a label that has information about the item to which it is attached Radio frequency identification (RFID) tags A technology that uses radio waves to identify objects, such as goods in supply chains 12-8
 Bar code printed on a label that has information about the item to which it is attached. Radio frequency identification (RFID) tags. A technology that uses radio waves to identify objects, such as goods in supply chains")
9
Demand Forecasts and Lead Time
Inventories are necessary to satisfy customer demands, so it is important to have a reliable estimates of the amount and timing of demand Lead time Time interval between ordering and receiving the order Point-of-sale (POS) systems A system that electronically records actual sales Such demand information is very useful for enhancing forecasting and inventory management 12-9
 systems. A system that electronically records actual sales. Such demand information is very useful for enhancing forecasting and inventory management")
10
ABC Classification System
A-B-C approach Classifying inventory according to some measure of importance, and allocating control efforts accordingly A items (very important) 10 to 20 percent of the number of items in inventory and about 60 to 70 percent of the annual dollar value B items (moderately important) C items (least important) 50 to 60 percent of the number of items in inventory but only about 10 to 15 percent of the annual dollar value Annual $ value of items High Low Few Many Number of Items A C B 12-10
 10 to 20 percent of the number of items in inventory and about 60 to 70 percent of the annual dollar value. B items (moderately important) C items (least important) 50 to 60 percent of the number. of items in inventory but only. about 10 to 15 percent of the. annual dollar value. Annual. $ value. of items. High. Low. Few. Many. Number of Items. A. C. B")
11
Cycle Counting Cycle counting Cycle counting management
A physical count of items in inventory Cycle counting management How much accuracy is needed? A items: ± 0.2 percent B items: ± 1 percent C items: ± 5 percent When should cycle counting be performed? Who should do it? 12-11

12
How Much to Order: EOQ Models
The basic economic order quantity model The economic production quantity model The quantity discount model 12-12

13
Basic EOQ Model The basic EOQ model is used to find a fixed order quantity that will minimize total annual inventory costs Assumptions Only one product is involved Annual demand requirements are known Demand is even throughout the year Lead time does not vary Each order is received in a single delivery There are no quantity discounts 12-13

14
Profile of Inventory Level Over Time
The Inventory Cycle Profile of Inventory Level Over Time Quantity on hand Q Receive order Place Lead time Reorder point Usage rate Time 12-14

15
Total Annual Cost 12-15

16
Goal: Total Cost Minimization
Order Quantity (Q) The Total-Cost Curve is U-Shaped Ordering Costs Q* Annual Cost (optimal order quantity) Holding Costs 12-16
 The Total-Cost Curve is U-Shaped. Ordering Costs. Q* Annual Cost. (optimal order quantity) Holding Costs")
17
Deriving EOQ Using calculus, we take the derivative of the total cost function and set the derivative (slope) equal to zero and solve for Q. The total cost curve reaches its minimum where the carrying and ordering costs are equal. 12-17

18
Economic Production Quantity (EPQ)
Assumptions Only one product is involved Annual demand requirements are known Usage rate is constant Usage occurs continually, but production occurs periodically The production rate is constant Lead time does not vary There are no quantity discounts 12-18

19
EPQ: Inventory Profile
Imax Production and usage Usage only Cumulative production Amount on hand Time 12-19

20
EPQ – Total Cost 12-20

21
EPQ 12-21

22
Quantity Discount Model
Price reduction offered to customers for placing large orders 12-22

23
Quantity Discounts 12-23

24
Quantity Discounts 12-24

25
When to Reorder Reorder point
When the quantity on hand of an item drops to this amount, the item is reordered. Determinants of the reorder point The rate of demand The lead time The extent of demand and/or lead time variability The degree of stockout risk acceptable to management 12-25

26
Reorder Point: Under Certainty
12-26

27
Reorder Point: Under Uncertainty
Demand or lead time uncertainty creates the possibility that demand will be greater than available supply To reduce the likelihood of a stockout, it becomes necessary to carry safety stock Safety stock Stock that is held in excess of expected demand due to variable demand and/or lead time 12-27

28
Safety Stock Quantity Maximum probable demand Expected demand
LT Time Expected demand during lead time Maximum probable demand ROP Quantity Safety stock 12-28

29
Safety Stock? As the amount of safety stock carried increases, the risk of stockout decreases. This improves customer service level Service level The probability that demand will not exceed supply during lead time Service level = 100% - Stockout risk 12-29

30
How Much Safety Stock? The amount of safety stock that is appropriate for a given situation depends upon: The average demand rate and average lead time Demand and lead time variability The desired service level 12-30

31
Reorder Point The ROP based on a normal
Distribution of lead time demand Risk of stockout Service level Expected demand ROP Quantity Safety stock z z-scale 12-31

32
Reorder Point: Demand Uncertainty
12-32

33
Reorder Point: Lead Time Uncertainty
12-33

34
How Much to Order: FOI Fixed-order-interval (FOI) model
Orders are placed at fixed time intervals Reasons for using the FOI model Supplier’s policy may encourage its use Grouping orders from the same supplier can produce savings in shipping costs Some circumstances do not lend themselves to continuously monitoring inventory position 12-34

35
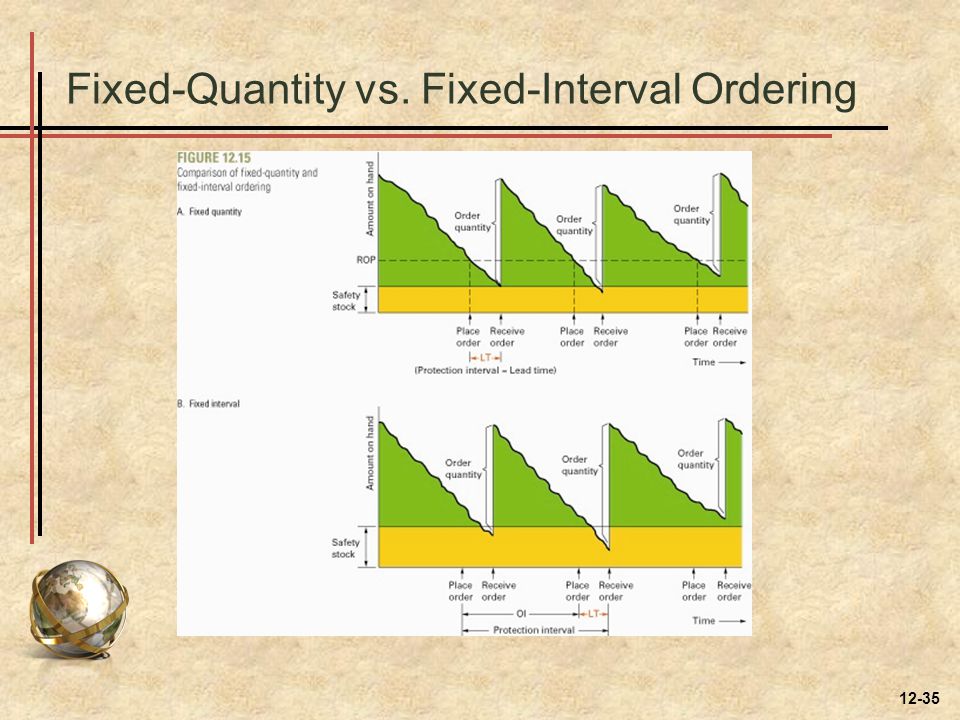
Fixed-Quantity vs. Fixed-Interval Ordering
12-35
36
FOI Model 12-36

37
FOI Model OI* represents the optimal time between orders. Time-frame of interest is an appropriate period (e.g., days or weeks). This is usually based on the time-frame expressed by the average demand rate, d-bar. 12-37
. This is usually based on the time-frame expressed by the average demand rate, d-bar")
38
Single-Period Model Single-period model
Model for ordering perishables and other items with limited useful lives Shortage cost Generally, the unrealized profit per unit Cshortage = Cs = Revenue per unit – Cost per unit Excess cost Different between purchase cost and salvage value of items left over at the end of the period Cexcess = Ce = Cost per unit – Salvage value per unit 12-38

39
Single-Period Model The goal of the single-period model is to identify the order quantity that will minimize the long-run excess and shortage costs Two categories of problem: Demand can be characterized by a continuous distribution Demand can be characterized by a discrete distribution 12-39

40
Stocking Levels Service level Cs Ce So Balance Point Quantity
So =Optimum Stocking Quantity 12-40

Similar presentations


