Download presentation
Presentation is loading. Please wait.

1
STEM Fair Shana Tirado Supervisor, Elementary Science
Teacher background information: Science Fair projects are a highly motivating tool for helping our students learn to use the scientific method, explore the practice of science, the characteristics of science, and the role of theories, laws, hypothesis, and models. The Science Department is strongly recommending that ALL students kindergarten through grade 12 participate in science fair every year. All science fair projects will be completed in class, at school. (Data collection can be done at home if parents are able and willing to provide support). You have time built into your curriculum map to work on science fair. This was not something the district just made up. Our nation is scoring below most other nations in scientific thinking on worldwide tests. Scientific thinking is the basis of discovery, understanding, and problem solving skills. 32 % of our workforce is in science, engineering, and related professions. (National Science Foundation , 2010) A majority of long-term issues faced by our legislators and the electorate, such as health, the environment, energy, space exploration, biotechnology, nutrition, and national security have technical and scientific dimensions. (National Educational Leadership Association, 2005) More info and rules are on IDEAS In IDEAS go to “Instructional” then “Elementary” then “Science” then “Science Fair” Shana Tirado Supervisor, Elementary Science
. You have time built into your curriculum map to work on science fair. This was not something the district just made up. Our nation is scoring below most other nations in scientific thinking on worldwide tests. Scientific thinking is the basis of discovery, understanding, and problem solving skills. 32 % of our workforce is in science, engineering, and related professions. (National Science Foundation , 2010) A majority of long-term issues faced by our legislators and the electorate, such as health, the environment, energy, space exploration, biotechnology, nutrition, and national security have technical and scientific dimensions. (National Educational Leadership Association, 2005) More info and rules are on IDEAS. In IDEAS go to Instructional then Elementary then Science then Science Fair Shana Tirado. Supervisor, Elementary Science.")
2
Hillsborough County STEM Fair Expectations
Scientific Method Hillsborough County STEM Fair Expectations Ask a question and state a purpose Research Hypothesis Procedures(variables, materials, step by step directions) Collect data Create a graph Draw a conclusion This version of the scientific method is like the alphabet to reading or playing notes on a piano to creating songs with the notes. Our students will learn these basic steps so that they can later go on to rearrange them and be creative with science. Our students should know that scientists do NOT always use these steps in this order.
 Collect data. Create a graph. Draw a conclusion. This version of the scientific method is like the alphabet to reading or playing notes on a piano to creating songs with the notes. Our students will learn these basic steps so that they can later go on to rearrange them and be creative with science. Our students should know that scientists do NOT always use these steps in this order.")
3
Required for all projects
STEM Fair Log Required for all projects

4
STEM Fair Log You will keep everything you do and think about your STEM fair project in your log. Your log is like a diary or journal of your progress in your investigation. Keep everything you write in your log even if you change your mind or start over. The log is a record of student thinking.

5
Write today’s date on the first page of your log.
Day 1 Entry: Write today’s date on the first page of your log. Write what you know, think, and wonder about science fair. You can use Diary style books to show what a diary or journal looks like. You might want to do a “Writer’s Workshop” model lesson on this style of writing. Model the writing craft of using voice. A f Great books for modeling this include Diary of a Worm, Diary of a Spider, Diary of a Fly, and Best Friends.” Allow students time to write in logs diary style. Prompt students to record thoughts, ideas, concerns, and all other thoughts in the log. Ask questions to prompt students who have trouble thinking of what to write. Have you ever done science fair? What did you do? What was it like? What do you think doing a science fair project will be like this year? Do you have any questions about science fair?

6
Log Expectations Projects without logs will be disqualified.
The log IS the project. The show board is just a commercial for the project. Each entry should be dated. Research notes, measurements, observations, and test results should be included. Projects without logs will be disqualified. The log IS the project. The show board is just a commercial for the project. THE LOG IS THE SCIENCE FAIR PROJECT!!! The first entry should be the when the student begins thinking about the project, the last entry should be when the project is turned in.

7
How to Select a STEM Fair Topic
The topic should be: Something your student is interested in Something your student can investigate themselves (volcanoes are interesting, but you can’t really investigate one yourself)
")
8
Restricted Topics Projects involving blood, bacteria, mold or fungus.
Projects using guns or explosives. Projects causing harm to animals.

9
Animals Permission must be given prior to the start.
Human / Animal Form No surgery or dissection may take place Neither physiological or psychological harm to the animal can result Must be supervised by an adult. If the question involves people or animals in the investigation a Human/Animal Research form MUST be filled out prior to the beginning of the project. The form is on IDEAS under the science fair icon.

10
Brainstorming Topics (Grades 3-5)
Help your child make a list of things they are interested in or have questions about. Brainstorm at least 10 to get started. This is a great “getting to know each other” activity for the beginning of the year. Teacher models first. Make a list of things you like. Challenge students to come up with as many ideas as they can think of. After lists are generated model asking as many questions as possible about the topic. Remind teachers to MODEL each step. Tip: If a student has trouble thinking of things they like you may let the student look through magazines and cut out interesting pictures to paste in the log or look at pictures to think of ideas to write down. They can also turn and talk and discuss things they like. Web Sites To Use To Find A Topic yahooligans.yahoo.com (type in science fair projects) super-science-fair-projects.com school.discovery.com/sciencefaircentral
 super-science-fair-projects.com. school.discovery.com/sciencefaircentral.")
11
Help your child think of questions ….
Things I Like Questions Baseball Does a baseball roll farther on artificial grass? Paper Airplanes How does the shape of the wing affect the glide? Rocks Do rocks erode more when exposed to acid rain? Playing outside What color shirt will keep me cooler outside in the sun? Teacher model first then give time for students to write. You may allow discussion. Prompt and assist students who have trouble asking questions. These are NOT necessarily the questions the students will use for science fair. This is a starting point. Encourage students to ask multiple questions about each topic they have listed.

12
Creating a testable STEM Fair question
Go through and discuss question slides then have students look at their question lists to choose a question.

13
STEM Fair Questions How does the type of water affect the growth rate of a plant? How does the species of the orange affect the amount of juice it has? How do shade trees affect temperature of areas on our playground? Does the type of water affect the growth rate of a plant? Is a yes or no question. It can be turned into an investigatable question by asking HOW.

14
A good science investigation question:
What is a Good Question? A good science investigation question: Can not be answered with one word such as yes or no. Tells you what you need to measure. Is something you can investigate yourself. Is answered with data that is collected. Instruct students to look through their questions and place a check mark or star next to questions that meet all of the above criteria. ****Many yes/no questions can be improved and made usable by changing the wording. An easy way to word questions is “How does ___________affect ___________?” Help your students choose a question and to change questions to a usable form if needed. Use leading questions to help them decide as much as possible.

15
Identifying the Purpose

16
Research

17
Research Before the project begins, learn more about the topic.
Include the information learned in the STEM fair log. This information will be used to develop the hypothesis. Your students can go on-line or into an encyclopedia, book, magazine, or other text or talk to an expert and learn something about the topic. This can be done as a reading or library skills lesson, in the computer lab as a lesson on finding online information, or whatever works best for your class. Have students read informational text related to their topic and jot notes in their logs. (This is like think notes in reading). They should try to find the answer to their questions, or information that leads them to an answer. They will conduct an investigation to prove or disprove what they have read or heard.
. They should try to find the answer to their questions, or information that leads them to an answer. They will conduct an investigation to prove or disprove what they have read or heard.")
18
Hypothesis

19
Procedure Materials Variables Directions

20
Example of Materials List
2 – 16oz Office Depot clear plastic cups 130ml tap water 1 Thermometer 16 oz of ice from cafeteria ice maker *Include how and when materials were obtained Discuss with students. Scientists use metric measurement and someday they might only use metric too. Notice – cups are measured using ounces because that is what is listed on the package. (It is NOT necessary to convert to metric.) If the student understands metric measurement it can be used to measure, notice the water is measured in milliliters.
 If the student understands metric measurement it can be used to measure, notice the water is measured in milliliters.")
21
Examples of Directions
Gather Materials Fill cup to ½ way mark with ice. Add 130 ml of tap water Swirl cup for 1 minute. (hold by top edges of the cup) Record water temperature. (Keep thermometer in water, look at eye level) Add 2 more ice cubes. Repeat steps 4 and 5
 Record water temperature. (Keep thermometer in water, look at eye level) Add 2 more ice cubes. Repeat steps 4 and 5.")
22
DATA This will be the most time consuming and sometimes messy part of science fair. In grades 3-5 you will spend several science periods collecting data. (See curriculum map). K-2 will have one class project. In grades 3-5 the data collection portion may be done at home IF parents are willing and able to help. Students should record data and bring data along with log entries about the data collection then create the data chart and graph at school. Look at the math standards from the previous grade. Only what has been previously taught is considered appropriate to use for science fair. Projects WILL NOT be disqualified if metric is not used. Students will follow directions and collect data. Explain that each group represents 1 trial. 5 groups = 5 trials. Whole class data can be quickly collected, making individual projects more manageable. Each group should write temp 1 and temp 2 on a sticky note. Collect sticky notes and graph on a bar graph and display. Graph : increased, decreased, stayed the same. Create data table with the data. The first several times you do this with children, you will need to model using the data to create a data table and graph. Some students will learn quickly and be able to do their charts and graphs on their own after data is collected. Others will need more support and you may model theirs whole class. While one student is writing up their data charts and graph, another can be preparing their materials and the rest of the class can be collecting data.
. K-2 will have one class project. In grades 3-5 the data collection portion may be done at home IF parents are willing and able to help. Students should record data and bring data along with log entries about the data collection then create the data chart and graph at school. Look at the math standards from the previous grade. Only what has been previously taught is considered appropriate to use for science fair. Projects WILL NOT be disqualified if metric is not used. Students will follow directions and collect data. Explain that each group represents 1 trial. 5 groups = 5 trials. Whole class data can be quickly collected, making individual projects more manageable. Each group should write temp 1 and temp 2 on a sticky note. Collect sticky notes and graph on a bar graph and display. Graph : increased, decreased, stayed the same. Create data table with the data. The first several times you do this with children, you will need to model using the data to create a data table and graph. Some students will learn quickly and be able to do their charts and graphs on their own after data is collected. Others will need more support and you may model theirs whole class. While one student is writing up their data charts and graph, another can be preparing their materials and the rest of the class can be collecting data.")
23
DATA Data refers to the information gathered in the investigation
This is in the form of tables and charts. You can also use photographs or drawings to show the information you gathered but pictures do not replace the data. Look at the math standards from the previous grade. Only what has been previously taught is considered appropriate to use for science fair. Projects WILL NOT be disqualified if metric is not used. Students will follow directions and collect data. Explain that each group represents 1 trial. 5 groups = 5 trials. Whole class data can be quickly collected, making individual projects more manageable. Each group should write temp 1 and temp 2 on a sticky note. Collect sticky notes and graph on a bar graph and display. Graph : increased, decreased, stayed the same. Create data table with the data. The first several times you do this with children, you will need to model using the data to create a data table and graph. Some students will learn quickly and be able to do their charts and graphs on their own after data is collected. Others will need more support and you may model theirs whole class. While one student is writing up their data charts and graph, another can be preparing their materials and the rest of the class can be collecting data.

24
DATA The more trials you do the more accurate the results of your experiment will be. The minimum for STEM fair is five trials. Scientists often repeat experiments thousands of times.

25
Distance a toy car will Roll in Meters
Trial Tile Floor Carpet Sidewalk Trial 1 4.3 2.4 2 Trial 2 4.4 2.7 Trial 3 3.5 1.8 Trial 4 4.5 2.8 2.5 Trial 5 4.8 1.6 Example of a data chart. Teacher can model data collection. Use student projects and model, model, model! Again, several groups can do the experiment all at the same time and each group becomes one trial for the student who is doing the project. K-2 will only do one whole class data collection.

26
Graph Graphs should be grade level appropriate and understood by the student. Refer to the math standards from the previous school year. Use math resources if needed to reteach graphing. Model graphic using student’s data. Students must be able to explain their graphs to the science fair judges. In K-2 picture graphs or bar graphs with 1:1 correspondence are appropriate. In 3-5 student should be able to understand and explain their graphs.

27
Graph Use a bar graph or line graph to display data. This is the same information gathered and already recorded on your data chart. Graphs should be grade level appropriate and understood by the student. In K-2 picture graphs or bar graphs with 1:1 correspondence are appropriate. In 3-5 student should be able to understand and explain their graphs.

28
Distance Toy Car Travels When Rolled Down Ramp Onto Various Surfaces
Key Meters We no longer average or find the mean in elementary school. This graph would not be appropriate for students who have not yet learned to create a triple bar graph. In primary it would be appropriate to add the results of each trial and create a two-bar bar graph to compare the data. Trials

29
CONCLUSION We no longer list results – results implies that we averaged the data and we do not. Finding the mean, or average is no longer part of our math standards. *If a student does understand and can explain finding a mean it is acceptable for that student to do so.

30
CONCLUSION My hypothesis was supported (or not supported) by the data. (Explain) I found out that… If I were to do this project again, I would change…because….. The way this is connected to the real world is… These are suggestions for writing conclusions. You and your students may add to this. Notice we no longer list results – results implies that we averaged the data and we do not. The conclusion is based on the hypothesis – so student should refer back to it. If the data did not support the hypothesis, this is where they will state that and give the corrected information

31
CONCLUSION A problem I had or unusual event was…. Describe your data in detail. What does your data mean? Compare the results with you background information. Explain why the experiment is important. Statement of support or non-support of the original hypothesis. Revise hypothesis (if data did not support the original hypothesis).
.")
32
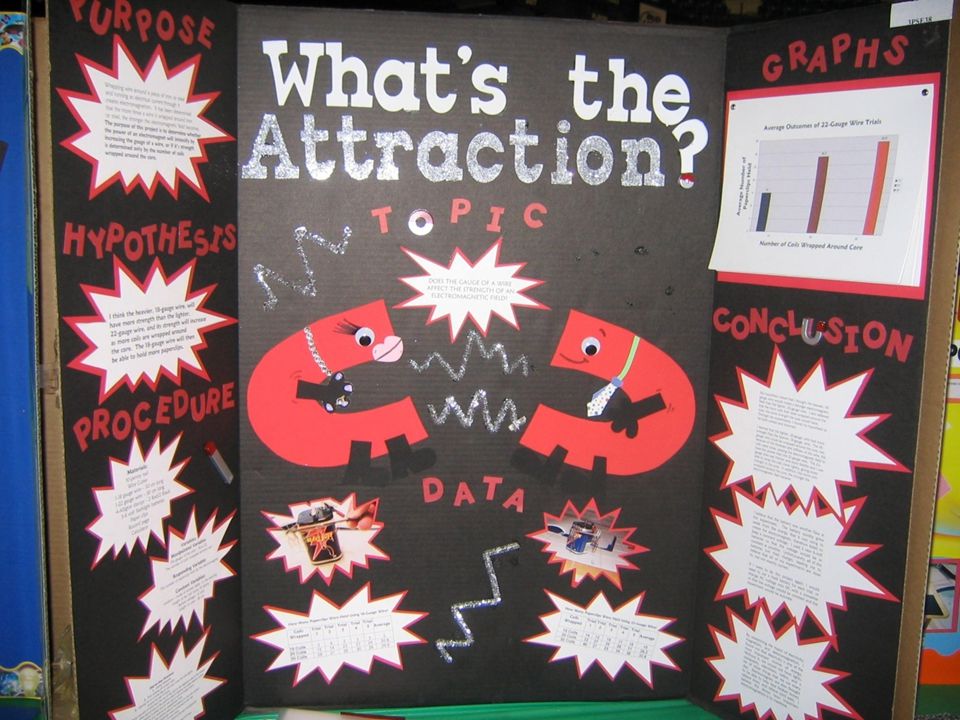
My Title Purpose Graph Hypothesis Data Procedure: Conclusion Optional
Materials Variables Conclusion How you do your science fair display for your school site based science fair is up to your school site. You may choose to use construction paper mini boards, typed up copies of what goes on the show board, hand written list of show board info, or whatever works for your school. The large cardboard display boards are only needed for the students who win for the school site and are going on to the district science fair. The information needs to flow, but parts do not necessarily need to be in these positions. (It’s okay if the directions go in the center and the pictures are in various places, etc…) Parents, art teachers, etc… may assist with the boards. Boards are not judged, what matters most is what the student has learned and can explain and what has been written and drawn in the log. Step-by-Step Directions Optional Research Paper Data Log
 Parents, art teachers, etc… may assist with the boards. Boards are not judged, what matters most is what the student has learned and can explain and what has been written and drawn in the log. Step-by-Step. Directions. Optional. Research Paper. Data Log.")
33
The title can be the question or a cute name for the project. Both work.

37
Judging Criteria Scientific Investigation – 40 pts
Thoroughness – 20 pts Skill – 15 pts Creative Ability/Originality – 15 pts Clarity/Neatness – 10 pts This information is on IDEAS in the Science Fair Handbook.

38
Shana Tirado, Supervisor
Questions? Shana Tirado, Supervisor Elementary Science Developed by Hillsborough County Schools Elementary Science Department

Similar presentations

>")


