Download presentation
Presentation is loading. Please wait.

1
Science Fair This presentation is meant to be used over a time period of days or months a little piece at a time. Refer to your curriculum map. This is just an outline and can be used in different ways to fit your class. Teacher notes are included. You may want to print the notes pages for reference. Teacher background information: Science Fair projects are a highly motivating tool for helping our students learn to use the scientific method, explore the practice of science, the characteristics of science, and the role of theories, laws, hypothesis, and models. The Science Department is strongly recommending that ALL students kindergarten through grade 12 participate in science fair every year. All science fair projects will be completed in class, at school. (Data collection can be done at home if parents are able and willing to provide support). You have time built into your curriculum map to work on science fair. This was not something the district just made up. Our nation is scoring below most other nations in scientific thinking on worldwide tests. Scientific thinking is the basis of discovery, understanding, and problem solving skills. 32 % of our workforce is in science, engineering, and related professions. (National Science Foundation , 2010) A majority of long-term issues faced by our legislators and the electorate, such as health, the environment, energy, space exploration, biotechnology, nutrition, and national security have technical and scientific dimensions. (National Educational Leadership Association, 2005) More info and rules are on IDEAS In IDEAS go to “Instructional” then “Elementary” then “Science” then “Science Fair”
. You have time built into your curriculum map to work on science fair. This was not something the district just made up. Our nation is scoring below most other nations in scientific thinking on worldwide tests. Scientific thinking is the basis of discovery, understanding, and problem solving skills. 32 % of our workforce is in science, engineering, and related professions. (National Science Foundation , 2010) A majority of long-term issues faced by our legislators and the electorate, such as health, the environment, energy, space exploration, biotechnology, nutrition, and national security have technical and scientific dimensions. (National Educational Leadership Association, 2005) More info and rules are on IDEAS. In IDEAS go to Instructional then Elementary then Science then Science Fair")
2
Scientific Method Scientists do not always follow these steps in this order or even go through all of them every time, but for science fair we will. Ask a question and state a purpose. Research Hypothesis Procedures(variables, materials, step by step directions.) Collect data. Create a graph. Draw a conclusion. This version of the scientific method is like the alphabet to reading or playing notes on a piano to creating songs with the notes. Our students will learn these basic steps so that they can later go on to rearrange them and be creative with science. Our students should know that scientists do NOT always use these steps in this order.
 Collect data. Create a graph. Draw a conclusion. This version of the scientific method is like the alphabet to reading or playing notes on a piano to creating songs with the notes. Our students will learn these basic steps so that they can later go on to rearrange them and be creative with science. Our students should know that scientists do NOT always use these steps in this order.")
3
Lesson 1 Log

4
Log The first thing you need to do to begin a science fair project is to begin writing in a log. It is a record of everything you think and do as you work on your science fair project. Projects without logs will be disqualified. The log IS the project. The show board is just a commercial for the project. THE LOG IS THE SCIENCE FAIR PROJECT!!! A log may be a notebook, loose-leaf paper in a notebook, paper stapled together, or any other type of log you want your students to use. In K-2 a log may be on chart paper, a notebook that both teachers and students write in, a collection of student work with teacher dictation notes, or any other format that works for your class. In grades 3-5 group project logs can be a compilation of all group members’ work (up to 4 in a group) . Individual projects should have their own log. Logs can be handwritten, typed, or a combination of both. If student work was handwritten then typed, include both copies. Spelling and grammar are NOT judged.
 . Individual projects should have their own log. Logs can be handwritten, typed, or a combination of both. If student work was handwritten then typed, include both copies. Spelling and grammar are NOT judged.")
5
Log You will keep everything you do and think about your science fair project in your log. Your log is like a diary or journal of your progress in your investigation. Keep everything you write in your log even if you change your mind or start over. The log is a record of student thinking.

6
Write today’s date on the first page of your log.
Write what you know, think, and wonder about science fair. You can use Diary style books to show what a diary or journal looks like. You might want to do a “Writer’s Workshop” model lesson on this style of writing. Model the writing craft of using voice. A f Great books for modeling this include Diary of a Worm, Diary of a Spider, Diary of a Fly, and Best Friends.” Allow students time to write in logs diary style. Prompt students to record thoughts, ideas, concerns, and all other thoughts in the log. Ask questions to prompt students who have trouble thinking of what to write. Have you ever done science fair? What did you do? What was it like? What do you think doing a science fair project will be like this year? Do you have any questions about science fair?

7
Log Projects without logs will be disqualified.
The log IS the project. The show board is just a commercial for the project. Each entry should be dated. Research notes, measurements, observations, and test results should be included. Projects without logs will be disqualified. The log IS the project. The show board is just a commercial for the project. THE LOG IS THE SCIENCE FAIR PROJECT!!! The first entry should be the when the student begins thinking about the project, the last entry should be when the project is turned in.

8
Lesson 2 Topic The topic should be:
Something your student is interested in Something your student can investigate themselves (volcanoes are interesting, but you can’t really investigate one yourself)
")
9
Brainstorming Topics (Grades 3-5)
Make a list of things you are interested in. The things you like do not need to have anything to do with science or school it’s just a list of things you like. Can you think of 20 or more? This is a great “getting to know each other” activity for the beginning of the year. Teacher models first. Make a list of things you like. Challenge students to come up with as many ideas as they can think of. After lists are generated model asking as many questions as possible about the topic. Remind teachers to MODEL each step. Tip: If a student has trouble thinking of things they like you may let the student look through magazines and cut out interesting pictures to paste in the log or look at pictures to think of ideas to write down. They can also turn and talk and discuss things they like. Web Sites To Use To Find A Topic yahooligans.yahoo.com (type in science fair projects) super-science-fair-projects.com school.discovery.com/sciencefaircentral
 super-science-fair-projects.com. school.discovery.com/sciencefaircentral.")
10
Think of as many questions as you can about the things you listed
Think of as many questions as you can about the things you listed. A list might look like this one: Things I Like Questions Baseball Does a baseball roll farther on artificial grass? Paper Airplanes How does the shape of the wing affect how far a paper airplane glides? Rocks Do most rocks erode in the rain? Can some rocks float? Playing outside What are good ways to cool off when you are hot? Teacher model first then give time for students to write. You may allow discussion. Prompt and assist students who have trouble asking questions. These are NOT necessarily the questions the students will use for science fair. This is a starting point. Encourage students to ask multiple questions about each topic they have listed.

11
Choosing Topics K-2 Teach your students to ask questions. Listen for their questions. Keep a chart “Wonder Wall” up and add questions to the chart. When you get to science fair project time you will have a list of questions to choose from. Example: In first grade you do Sheep in a Jeep- rolling jeep down a ramp, changing the height of the ramp to change the pull of gravity. If a student asks what would happen if you do it on the rug, or suggests another surface, say :”That’s a good question, maybe we will investigate that someday. I wonder about that too, lets write that question on the Wonder Wall”.

12
What is a Good Question for Science Fair? Lesson 3
Go through and discuss question slides then have students look at their question lists to choose a question.

13
A good question cannot be answered yes or no.
(There are exceptions to this rule) Good: How does the type of water affect the growth rate of a plant? Bad: Can plants grow in water? Does the type of water affect the growth rate of a plant? Is a yes or no question. It can be turned into an investigatable question by asking HOW.
 Good: How does the type of water affect the growth rate of a plant Bad: Can plants grow in water Does the type of water affect the growth rate of a plant Is a yes or no question. It can be turned into an investigatable question by asking HOW.")
14
A good question tells you what you need to measure.
Good: How does the species of the orange affect the amount of juice it has? Bad: Are oranges juicy? You can measure the amount of juice an orange has.

15
You can investigate the question yourself.
Good: How do shade trees affect temperature of areas on our playground? Bad: What are the temperatures on Venus? (though you can look it up, you cannot build a rocket, go to Venus and study this on your own and get back before the due date) You may need to add that to answer a question on your own you must have access the materials you need. A project that requires expensive materials that are not available is not something you can do yourself. Students may use any materials in the old or new science kits.
 You may need to add that to answer a question on your own you must have access the materials you need. A project that requires expensive materials that are not available is not something you can do yourself. Students may use any materials in the old or new science kits.")
16
The answer is a fact, not an opinion.
Good: How does the brand of soap affect the amount of bubbles produced? Bad: What kind of soap smells the best?

17
A good science investigation question:
What is a Good Question? A good science investigation question: Can not be answered with one word such as yes, no, or purple. Tells you what you need to measure. Is something you can investigate yourself. Is answered with a fact, not an opinion. Instruct students to look through their questions and place a check mark or star next to questions that meet all of the above criteria. ****Many yes/no questions can be improved and made usable by changing the wording. An easy way to word questions is “How does ___________affect ___________?” Help your students choose a question and to change questions to a usable form if needed. Use leading questions to help them decide as much as possible.

18
Example of log entry for question: August 20, 2011 I saw a picture of icebergs floating. They look really cool and pretty. Ice floats in a glass of water too. I wonder if ice is lighter than water. My question is: Does the mass of water change when it goes from a liquid to a solid. No, How does going from a liquid to a solid affect the mass of ice? is better. The boat in the picture floats too. Is the boat wood or metal? I think metal sinks, but metal boats float. I know wood will float.. Tell your student that they will choose a question that fits the criteria and explain why they chose the question. You may share the above example first. This entry was written AFTER the student had been taught how to ask a question appropriate for use in science fair. This student had difficulty selecting a topic so her teacher asked her to look for interesting pictures in magazines and questions about the pictures.

19
Choose a question from your list that fits the science fair question criteria and explain why you chose the question in your log. It is okay if a student chooses a new question as long as it fits the criteria. You may ask leading questions and make suggestions to help students choose an appropriate question. Remember – unless parents can and are willing to help with data collection you will be helping students to conduct the experiment and collect data at school. If the experiment matches other benchmarks in your grade BONUS!!

20
Research Involving Animals
Human/Animal Research form MUST be filled out prior to the beginning of the project. No surgery or dissection may take place Neither physiological or psychological harm to the animal can result Must be supervised by an adult. If the question involves people or animals in the investigation a Human/Animal Research form MUST be filled out prior to the beginning of the project. The form is on IDEAS under the science fair icon.

21
Lesson 4 Purpose

22
It is really just restating the question.
Purpose The purpose of the project should tell what you want to find out. The purpose of my project is to find out… It is really just restating the question. Model – use some student questions and write them as purposes. Example: Question: Will a cable-stayed bridge or a beam bridge support the most weight? Purpose: The purpose of my project is to find out if a cable-stayed bridge or a beam bridge will support the most weight. Encourage students to write a log entry about their project. They may start to explain what materials they think they might use, ideas for conducting the investigation, or any other thoughts about the project. Do not correct or change what they write at this point. This is purely student thinking and processing at this point. You will address the other steps at a later date. K-2 will do the one class project purpose. Student comments and ideas can be recorded in the log.

23
Lesson 5 Research

24
Research Before you can begin your project, you need to learn more about the topic. You will write the information you learn in your science fair log. You will use this information to make your hypothesis. Your students can go on-line or into an encyclopedia, book, magazine, or other text or talk to an expert and learn something about the topic. This can be done as a reading or library skills lesson, in the computer lab as a lesson on finding online information, or whatever works best for your class. Have students read informational text related to their topic and jot notes in their logs. (This is like think notes in reading). They should try to find the answer to their questions, or information that leads them to an answer. They will conduct an investigation to prove or disprove what they have read or heard.
. They should try to find the answer to their questions, or information that leads them to an answer. They will conduct an investigation to prove or disprove what they have read or heard.")
25
Lesson 6 Hypothesis

26
Hypothesis The hypothesis is what you predict will happen when you perform the experiment based on your research. It doesn’t matter whether you are right or wrong; in your conclusion, you will tell if your hypothesis was correct or not. It is what you think the results of your experiment will be and WHY you think that.

27
Based on my research, I think… will happen because ...
Hypothesis In your log write what you think the results of your experiment will be and WHY you think that. Based on my research, I think… will happen because ... Remember to use the information from your research to explain why you think this will happen!

28
Lesson 7 Variables

29
What you are changing on purpose. The changes are you measuring.
Variables There are 3 kinds of variables. You will list the variables for your science fair project today. Manipulated (Independent ) What you are changing on purpose. 2. Responding (Dependent ) The changes are you measuring. 3. Held Constant (Control) Everything that stays the same. Students do not need to know the vocabulary independent/manipulated, dependent/ responding, held constant/control. Projects have to be labeled with some type of terminology, it can be “What I kept the same, changed on purpose, and what changed because of what I did.” Students should understand that investigations should contain these 3 parts.
 What you are changing on purpose. 2. Responding (Dependent ) The changes are you measuring. 3. Held Constant (Control) Everything that stays the same. Students do not need to know the vocabulary independent/manipulated, dependent/ responding, held constant/control. Projects have to be labeled with some type of terminology, it can be What I kept the same, changed on purpose, and what changed because of what I did. Students should understand that investigations should contain these 3 parts.")
30
Examples of VARIABLES:
Question ? Manipulated (Independent) Variable (what You Change) Responding (Dependant) Variables (What You Will Measure) Constants (Controlled) (What you keep the same) Do all brands of paper towels absorb the same amount of water? Brands of paper towels Amount of water that is absorbed by each towel Size of paper towel Amount of water poured on each paper towel Temperature of the water used Container towels are placed in Method of pouring Amount of time paper towel remains submerged Read and discuss.
 Variable. (what You Change) Responding. (Dependant) Variables. (What You Will Measure) Constants. (Controlled) (What you keep the same) Do all brands of paper towels absorb the same amount of water Brands of paper towels. Amount of water that is absorbed by each towel. Size of paper towel. Amount of water poured on each paper towel. Temperature of the water used. Container towels are placed in. Method of pouring. Amount of time paper towel remains submerged. Read and discuss.")
31
(What You Will Measure) (What you keep the same)
List your VARIABLES: Question ? Manipulated (Independent) Variable (what You Change) Responding (Dependant) Variables (What You Will Measure) Constants (Controlled) (What you keep the same) Have students list their variables in their logs.
 Variable. (what You Change) Responding. (Dependant) Variables. (What You Will Measure) Constants. (Controlled) (What you keep the same) Have students list their variables in their logs.")
32
Lesson 8 . Materials Use measurements that are appropriate in your grade level. It is okay for K-2 to use nonstandard measurement. 3-5 should only use measurements that the student understands. Look at the previous grade level’s benchmarks for measurement to find out what your students should know. Projects will not be disqualified if metric is not used. It is recommended that students who understand metric use it.

33
Example of Materials List
2 – 16oz Office Depot clear plastic cups 130ml tap water 1 Thermometer 16 oz of ice from cafeteria ice maker Discuss with students. Scientists use metric measurement and someday they might only use metric too. Notice – cups are measured using ounces because that is what is listed on the package. (It is NOT necessary to convert to metric.) If the student understands metric measurement it can be used to measure, notice the water is measured in milliliters.
 If the student understands metric measurement it can be used to measure, notice the water is measured in milliliters.")
34
Materials This is a list of ALL the materials you need to perform your experiment. You must also include how much. . Use measurements that are appropriate in your grade level. It is okay for K-2 to use nonstandard measurement. 3-5 should only use measurements that the student understands. Look at the previous grade level’s benchmarks for measurement to find out what your students should know.

35
HOW, WHEN, and WHERE will you get you materials?
Explain in your log.

36
Step by Step Directions
Lesson 9 Step by step directions makes a good writing connection. (Procedural writing) (National Geographic writing connection books also offer good model lessons) It’s Peanut Butter and Jelly Time! science/writing connection – can be used as a writing lesson Have your students work in groups to write a recipe for making a peanut butter and jelly sandwich. Follow the directions EXACTLY to make a sandwich. If any part of the directions are missing or incomplete, have your students revise them until they can be followed and a sandwich can be made. Students are very willing to revise when they have to have usable directions in order to get a sandwich. ****In case of peanut allergies make Fluff and jelly sandwiches. *****
 (National Geographic writing connection books also offer good model lessons) It’s Peanut Butter and Jelly Time! science/writing connection – can be used as a writing lesson. Have your students work in groups to write a recipe for making a peanut butter and jelly sandwich. Follow the directions EXACTLY to make a sandwich. If any part of the directions are missing or incomplete, have your students revise them until they can be followed and a sandwich can be made. Students are very willing to revise when they have to have usable directions in order to get a sandwich. ****In case of peanut allergies make Fluff and jelly sandwiches. *****")
37
Examples of Directions
Gather Materials Fill cup to ½ way mark with ice. Add 130 ml of tap water Swirl cup for 1 minute. (hold by top edges of the cup) Record water temperature. (Keep thermometer in water, look at eye level) Add 2 more ice cubes. Repeat steps 4 and 5
 Record water temperature. (Keep thermometer in water, look at eye level) Add 2 more ice cubes. Repeat steps 4 and 5.")
38
Step by Step Directions –
These are like a recipe. Anyone who reads them will be able to duplicate the investigation and get the same results. Data collection for one student’s project can be done as a whole class. Each group’s data becomes 1 trial.

39
Step by Step Directions –
Direction steps need to be numbered. The experiment needs to be done 5 or more times so they will have sufficient data to make an accurate conclusion. Step number one is always, “Gather materials.” Data collection for one student’s project can be done as a whole class. Each group’s data becomes 1 trial.

40
When you write your directions there are a few things to remember:
Write them clearly so someone else may follow them and get the same (or similar) results. Be very specific and to the point. Remember to indicate how many trials are necessary. For Example: “Repeat steps 2-5 four more times for a total of five trials” Make sure to indicate when data should be collected and what kind of data. Your students directions will be revised and ready to use before any data collection takes place.
 results. Be very specific and to the point. Remember to indicate how many trials are necessary. For Example: Repeat steps 2-5 four more times for a total of five trials Make sure to indicate when data should be collected and what kind of data. Your students directions will be revised and ready to use before any data collection takes place.")
41
DATA Lesson 10 This will be the most time consuming and sometimes messy part of science fair. In grades 3-5 you will spend several science periods collecting data. (See curriculum map). K-2 will have one class project. In grades 3-5 the data collection portion may be done at home IF parents are willing and able to help. Students should record data and bring data along with log entries about the data collection then create the data chart and graph at school. Look at the math standards from the previous grade. Only what has been previously taught is considered appropriate to use for science fair. Projects WILL NOT be disqualified if metric is not used. Students will follow directions and collect data. Explain that each group represents 1 trial. 5 groups = 5 trials. Whole class data can be quickly collected, making individual projects more manageable. Each group should write temp 1 and temp 2 on a sticky note. Collect sticky notes and graph on a bar graph and display. Graph : increased, decreased, stayed the same. Create data table with the data. The first several times you do this with children, you will need to model using the data to create a data table and graph. Some students will learn quickly and be able to do their charts and graphs on their own after data is collected. Others will need more support and you may model theirs whole class. While one student is writing up their data charts and graph, another can be preparing their materials and the rest of the class can be collecting data.
. K-2 will have one class project. In grades 3-5 the data collection portion may be done at home IF parents are willing and able to help. Students should record data and bring data along with log entries about the data collection then create the data chart and graph at school. Look at the math standards from the previous grade. Only what has been previously taught is considered appropriate to use for science fair. Projects WILL NOT be disqualified if metric is not used. Students will follow directions and collect data. Explain that each group represents 1 trial. 5 groups = 5 trials. Whole class data can be quickly collected, making individual projects more manageable. Each group should write temp 1 and temp 2 on a sticky note. Collect sticky notes and graph on a bar graph and display. Graph : increased, decreased, stayed the same. Create data table with the data. The first several times you do this with children, you will need to model using the data to create a data table and graph. Some students will learn quickly and be able to do their charts and graphs on their own after data is collected. Others will need more support and you may model theirs whole class. While one student is writing up their data charts and graph, another can be preparing their materials and the rest of the class can be collecting data.")
42
DATA Data refers to the information gathered in the investigation
This is in the form of tables and charts. You can also use photographs or drawings to show the information you gathered but pictures do not replace the data. Look at the math standards from the previous grade. Only what has been previously taught is considered appropriate to use for science fair. Projects WILL NOT be disqualified if metric is not used. Students will follow directions and collect data. Explain that each group represents 1 trial. 5 groups = 5 trials. Whole class data can be quickly collected, making individual projects more manageable. Each group should write temp 1 and temp 2 on a sticky note. Collect sticky notes and graph on a bar graph and display. Graph : increased, decreased, stayed the same. Create data table with the data. The first several times you do this with children, you will need to model using the data to create a data table and graph. Some students will learn quickly and be able to do their charts and graphs on their own after data is collected. Others will need more support and you may model theirs whole class. While one student is writing up their data charts and graph, another can be preparing their materials and the rest of the class can be collecting data.

43
DATA To collect your data you will follow your step by step directions exactly. You will complete at least 5 trials and record the information in your log. You will use the data to create a data chart. Be careful that your name or school name cannot be seen in the pictures. You can do a student’s data collection as a whole class and each group’s data becomes 1 trial. Data collection should be grade level appropriate according to math standards.

44
DATA The more trials you do the more accurate the results of your experiment will be. The minimum for science fair is five trials. Scientists often repeat experiments thousands of times.

45
Distance a toy car will Roll in Meters
Trial Tile Floor Carpet Sidewalk Trial 1 4.3 2.4 2 Trial 2 4.4 2.7 Trial 3 3.5 1.8 Trial 4 4.5 2.8 2.5 Trial 5 4.8 1.6 Example of a data chart. Teacher can model data collection. Use student projects and model, model, model! Again, several groups can do the experiment all at the same time and each group becomes one trial for the student who is doing the project. K-2 will only do one whole class data collection.

46
How can you collect qualitative data for:
Quantitative and Qualitative data Explain the difference between quantitative and qualitative data. Qualitative has to do with observable qualities. (5 senses) What we can hear, see, feel, taste, smell. Quantitative is measurable and can be expressed numerically. Qualitative Data How can you collect qualitative data for: How Does drinking Coca Cola affect the color of teeth? You can use tooth color charts from the dentists office. A numerical value is given to each shade. How does laundry detergent affect stains? Example: Use a white T-shirt. Rub in grass until well stained. Cut into squares. Use a clean white square as “0”. Worst stain as “10”. Soak squares in different detergents. Rank by stain and number . Paint sample cards work well too.
 What we can hear, see, feel, taste, smell. Quantitative is measurable and can be expressed numerically. Qualitative Data. How can you collect qualitative data for: How Does drinking Coca Cola affect the color of teeth You can use tooth color charts from the dentists office. A numerical value is given to each shade. How does laundry detergent affect stains Example: Use a white T-shirt. Rub in grass until well stained. Cut into squares. Use a clean white square as 0 . Worst stain as 10 . Soak squares in different detergents. Rank by stain and number . Paint sample cards work well too.")
47
Graph Lesson 11 Graphs should be grade level appropriate and understood by the student. Refer to the math standards from the previous school year. Use math resources if needed to reteach graphing. Model graphic using student’s data. Students must be able to explain their graphs to the science fair judges. In K-2 picture graphs or bar graphs with 1:1 correspondence are appropriate. In 3-5 student should be able to understand and explain their graphs.

48
Graph Use a bar graph or line graph to display data. This is the same information gathered and already recorded on your data chart. Graphs should be grade level appropriate and understood by the student. In K-2 picture graphs or bar graphs with 1:1 correspondence are appropriate. In 3-5 student should be able to understand and explain their graphs.

49
Graph A bar graph – shows comparative data
A line graph – shows data over time. (such as growing plants) Horizontal Axis: The manipulated variable (what you changed on purpose) is displayed on the horizontal axis. Vertical Axis: The responding variable (what happened as a result of what you changed) is displayed on the vertical axis. Only use this if it is appropriate for your students.
 Horizontal Axis: The manipulated variable (what you changed on purpose) is displayed on the horizontal axis. Vertical Axis: The responding variable (what happened as a result of what you changed) is displayed on the vertical axis. Only use this if it is appropriate for your students.")
50
Distance Toy Car Travels When Rolled Down Ramp Onto Various Surfaces
Key Meters We no longer average or find the mean in elementary school. This graph would not be appropriate for students who have not yet learned to create a triple bar graph. In primary it would be appropriate to add the results of each trial and create a two-bar bar graph to compare the data. Trials

51
CONCLUSION Lesson 12 We no longer list results – results implies that we averaged the data and we do not. Finding the mean, or average is no longer part of our math standards. *If a student does understand and can explain finding a mean it is acceptable for that student to do so.

52
CONCLUSION My hypothesis was supported (or not supported) by the data. (Explain) I found out that… If I were to do this project again, I would change…because….. The way this is connected to the real world is… These are suggestions for writing conclusions. You and your students may add to this. Notice we no longer list results – results implies that we averaged the data and we do not. The conclusion is based on the hypothesis – so student should refer back to it. If the data did not support the hypothesis, this is where they will state that and give the corrected information

53
CONCLUSION A problem I had or unusual event was…. Describe your data in detail. What does your data mean? Compare the results with you background information. Explain why the experiment is important. Statement of support or non-support of the original hypothesis. Revise hypothesis (if data did not support the original hypothesis).
.")
54
My Title Purpose Graph Hypothesis Data Procedure: Conclusion Optional
Materials Variables Conclusion How you do your science fair display for your school site based science fair is up to your school site. You may choose to use construction paper mini boards, typed up copies of what goes on the show board, hand written list of show board info, or whatever works for your school. The large cardboard display boards are only needed for the students who win for the school site and are going on to the district science fair. The information needs to flow, but parts do not necessarily need to be in these positions. (It’s okay if the directions go in the center and the pictures are in various places, etc…) Parents, art teachers, etc… may assist with the boards. Boards are not judged, what matters most is what the student has learned and can explain and what has been written and drawn in the log. Step-by-Step Directions Optional Research Paper Data Log
 Parents, art teachers, etc… may assist with the boards. Boards are not judged, what matters most is what the student has learned and can explain and what has been written and drawn in the log. Step-by-Step. Directions. Optional. Research Paper. Data Log.")
55
This is what we don’t want!
When someone does a science project for a student they are taking away the student’s opportunity to learn. And, if the student can not show a thorough understanding of the investigation the student will not win a science fair medal. We need to let the students do the work and the learning.

56
DRAWINGS OR PHOTOGRAPHS
Photographs and drawings are an excellent idea. School names and students names should not be on showboard.

57
Show what you have learned…
The title can be the question or a cute name for the project. Both work.

59
Displays Must be durable and self-supporting
No student or school name can be on the front of the display, or on/in the log/research paper. Photos are great, but there should not be school shirts in photos. Dead animals, plants, and food may NOT be part of display. Projects involving human blood, mold or fungus are prohibited Glass items and plastic “baggies” are not to be displayed Straight pins, tacks, or staples are not to be used to secure materials onto display boards This information is on IDEAS in the Science Fair Handbook. There is a maximum size for boards. See Science Fair Handbook.

60
Ineligible Projects Projects involving human blood, body parts including hair, teeth, nails, or pathogenic agents (bacteria, mold, viruses, fungi, parasites) are PROHIBITED! Yeast is the exception and is approved. Projects involving weapons (ANY type of gun, arrows, knives, darts, etc.) or explosives are PROHIBITED! No rockets with engines, no catapults. This information is on IDEAS in the Science Fair Handbook.
 are PROHIBITED! Yeast is the exception and is approved. Projects involving weapons (ANY type of gun, arrows, knives, darts, etc.) or explosives are PROHIBITED! No rockets with engines, no catapults. This information is on IDEAS in the Science Fair Handbook.")
61
Requirements K-2 projects must be for display ONLY.
ALL grades must have a separate DATA LOG that is clearly marked. Projects without LOGS will be disqualified A research paper is not required, BUT students who do write one will be most likely be considered for top awards. This information is on IDEAS in the Science Fair Handbook.

62
Judging Criteria Scientific Investigation – 40 pts
Thoroughness – 20 pts Skill – 15 pts Creative Ability/Originality – 15 pts Clarity/Neatness – 10 pts This information is on IDEAS in the Science Fair Handbook.

63
Teacher information The following slides are intended for teacher use only.

64
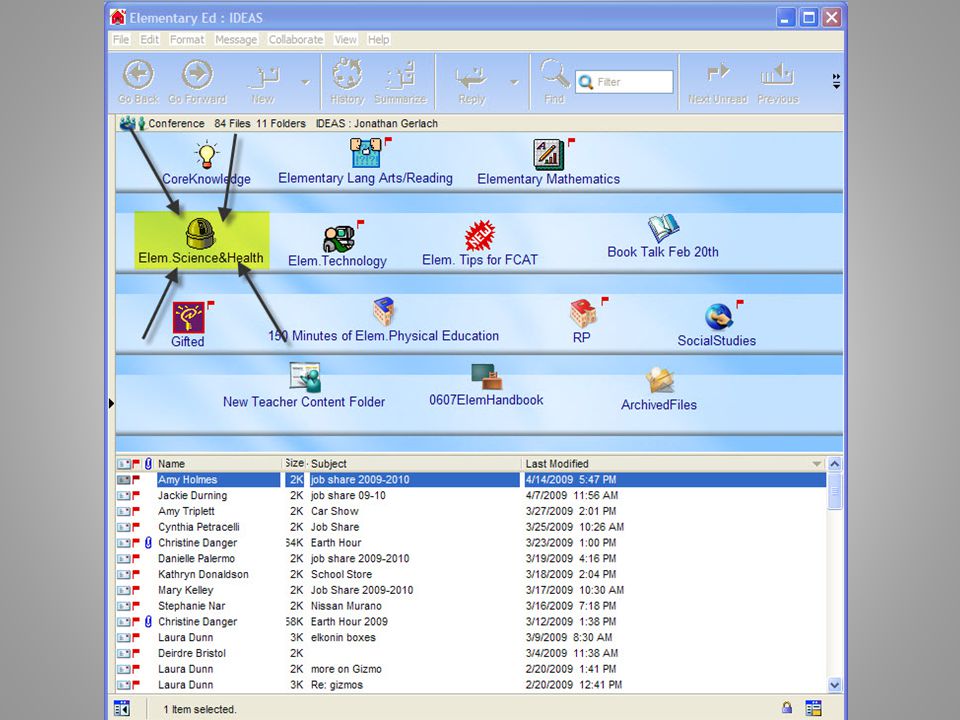
How to Get to Elementary Science on IDEAS
Here is how to find the science fair rules and information on IDEAS.

68
Questions? If you have questions or concerns regarding the Next Generation Sunshine State Standards, the Hillsborough County Curriculum Map, or any other science related matter, please contact one of your science team members. Shana Tirado, Elementary Science Supervisor Jonathan Gerlach, DRT Elementary Science – Title I Barb Brightman, DRT Elementary Science Christine Angel Danger Elementary Science Trainer Leann Rodriguez Elementary Science Trainer Developed by Hillsborough County Schools Elementary Science Department

Similar presentations


 o Writing A Question o Writing A Hypothesis.>")


