Download presentation
Presentation is loading. Please wait.

1
The EU agrofood sector: facts and challenges
IP Erasmus June 25th 2010

2
P 9 à 15 rapport EU 25 à 57

3
Agrofood- Agroindustry?…
Industry dealing with the supply, processing and distribution of farm products. (Source: PHC) Agro Food….. For human food purpose A F I FARM INDUSTRY FOOD Alimentation, ingredients, processing aids, neutraceuticals ENERGY Carburants, Electricity, Heat MOLECULES Pharmacy, Hygien, Cosmetics, Detergents… MATERIALS Construction, Paper, Textile, Plasturgy, Metallurgy, Packaging
 Agro Food….. For human food purpose A F I. FARM. INDUSTRY. FOOD. Alimentation, ingredients, processing aids, neutraceuticals. ENERGY. Carburants, Electricity, Heat. MOLECULES. Pharmacy, Hygien, Cosmetics, Detergents… MATERIALS. Construction, Paper, Textile, Plasturgy, Metallurgy, Packaging.")
4
EU Agrofood sector– Impact of CAP
Definitions EU AFI: snapshot EU Agrofood sector– Impact of CAP Evolution and consequences EU AFI : today , tomorrow … challenges What do we observe today? Strengths & Weaknesses Threats & Opportunities An illustration: the meat & poultry meat area

5
EU Food & Drink characteristics
EU Agrofood sector Snapshot EU Food & Drink characteristics

6
World exports of Agri Food products
Total: 1127,7 mio$ P.prod: 913 % intra region PA 519,3 435,4 81% 178 134,1 42% 39 32% 213 164 56% 53,5 27 33% 125 111 15% Poids de UE Donner infos sur évolution des autres zones Asie/ Am Latine WTO 2007 6

7
965

8
EU Food & Drink A heavy sector
Largest EU Turnover 965 b € ,2% Largest EU employer 4,4 million

9
EU Food & Drinks What’s in?

10
Share of main sectors in the EU Food & Drink exports -2008

11
EU Agrofood sector A few « takeaways »
Value added: 2% EU GDP Largest Manufacturing sector in the EU - 13,5% employment 12,9% EU Turnover b € ,2% Fragmented market: companies, predominantly SME’s Shrinking share in 17,5% global export markets Insufficient R&D budget: 0,37% SME 48,7% turnover: 63% employment 4,4mio employees 99% enterprises emply less than 249 people Changing primary sector A diverse food processing sector A major competitor to added value A powerful distribution sector A leading employer A significant contributor to trade R&D efforts…? Now: a period of structural adjustment

12
Evolution and consequences
EU Agrofood sector Impact of CAP Evolution and consequences

13
History of CAP Settled in the 60’s to modernize European agriculture
Clear objectives: Modernize agriculture Allow farmers to be competitive Basic principles: Very high prices comparatively to world prices Guaranteed by intervention No quantity limit for sales to intervention

14
CAP and Agriculture CAP and AFI businesses Europe self-sufficient
Quick improvement of productivity of agriculture Farm restructuring slow many middle-size farms kept Land occupation Rural exodus slowed down ( 60’s,70’s) Success for intervention systems, resulting in huge … excess of production … expenses for CAP and critics: from third countries from consumers and importing countries within the EU CAP and AFI businesses Such protective environment has been comfortable : guaranteed prices help to have predictable business …With perverse effects High prices for cereals lead to expensive inputs for meat products : beef, pork and poultry No necessity to be competitive : Europe is protected and restitutions help to competitiveness Trade barriers are very efficient to protect from imports from third countries due to distorted competition Predictability of business……As prices kept stable -Competitiveness: expensive inputs -No need to be competitive Trade barriers Restitutions
 Success for intervention systems, resulting in huge. … excess of production. … expenses for CAP. and critics: from third countries. from consumers and importing countries within the EU. CAP and AFI businesses. Such protective environment has been comfortable : guaranteed prices help to have predictable business. …With perverse effects. High prices for cereals lead to expensive inputs for meat products : beef, pork and poultry. No necessity to be competitive : Europe is protected and restitutions help to competitiveness. Trade barriers are very efficient to protect from imports. from third countries due to distorted competition. Predictability of business……As prices kept stable. -Competitiveness: expensive inputs. -No need to be competitive. Trade barriers. Restitutions.")
15
Food companies policies
90 90’s 07 07 CAP strategy of volume for many companies Subsidies “addicts” are: Weak in innovation Not “incented”to create brands and added value, except multinationals Easy return Intra EU trade Large single protected market- SME In the sectors where CAP was implemented, many food companies have been modelled on a strategy of volume instead added value No necessity to add value with marketing and innovation Emergence of big co-operatives which deal with subsidies and deliver products to intervention : they only have to manage a strategy of volume, permitted by growth of production Addiction to subsidies Weakness of marketing expenses an R&D : less necessary Few companies invest to create brands and added value, except multinationals High prices for raw material gives an easier return, it favours trade between EU member states For instance : Total world cheese trade : 1,6 MT Intra EU cheese trade : 3,4 MT Similar for sugar The strength of the single market allows small companies to be maintained without external competition

16
Need for many companies to change their strategy
The changes in the 90’s 90’s 90 90’s 07 07 EU begins to reform CAP Lower farm prices and direct subsidies to farmers are implemented Limitation of restitutions Changing scope for AFI From 2000, less access to intervention Need for many companies to change their strategy Due to external (and budgetary !) pressures, EU begins to reform the CAP Lower farm prices and direct subsidies to farmers are implemented Limitation of restitutions From 2000, less access to intervention …Big changes for many companies which were not ready The limitation of restitutions changes the scope of food industry : Less competitive on basic products Less access to third countries markets The products with high added value and brands are only able to compete Necessity to turn to EU domestic market But which products to be sold if the company has always dealt with commodities ? For many companies within the EU, the time has come to change their strategy Three simple solutions : Create added value : shifting from subsidised commodities to consumer products Concentrate in big companies within Europe Delocalize outside Europe Some « small » problems : Which products ? Which brands (private labels ?) Which approach to retailers ?
 pressures, EU begins to reform the CAP. Lower farm prices and direct subsidies to farmers are implemented. Limitation of restitutions. From 2000, less access to intervention. …Big changes for many companies which were not ready. The limitation of restitutions changes the scope of food industry : Less competitive on basic products. Less access to third countries markets. The products with high added value and brands are only able to compete. Necessity to turn to EU domestic market. But which products to be sold if the company has always dealt with commodities For many companies within the EU, the time has come to change their strategy. Three simple solutions : Create added value : shifting from subsidised commodities to consumer products. Concentrate in big companies within Europe. Delocalize outside Europe. Some « small » problems : Which products Which brands (private labels ) Which approach to retailers")
17
EU Agrofood vs Production
90 90’s 07 07 Production structures weakened in some areas Agricultural activity perceived less attractive Many small farm structures Consequently, “high” prices to be paid to farmers Price decreases lead to a weakening of the structures of production in countries where the restructuring has not been strong enough (France, Germany) Agricultural activity is less attractive, and producers are prompted to change their production with new decoupling rules Many farmers think agriculture has less future and want to give up
 Agricultural activity is less attractive, and producers are prompted to change their production with new decoupling rules. Many farmers think agriculture has less future and want to give up.")
18
EU AFI companies policies
90 90’s 07 07 Different strategies Delocalization Concentration Outsourcing Within a difficult context Less subsidies Increased competition from 3rd countries Many companies facing difficulties Too many SMEs – Restructuring has still to go on Mergers, emergence of large players The changes are considerable for many companies Delocalization for sugar and poultry Concentration for all basic industries Outsourcing for multinational companies These changes have to be managed in the framework of a global reform with less subsidies, and increased competition from third countries Many companies in difficulties : mergers and creation of big players

19
EU AFI companies:challenges
90 90’s 07 07 Find new outlets within EU Nutrition challenges in sugar, dairy, meat industry Weak competitiveness on world market for commodities A strong image of quality products from Europe Strong network of middle-sized companies with high added value Emergence of large AFI cies Strong and competitive retail sector At the turn of the century, food industry faces new challenges : Necessity to find new outlets within EU New challenges about nutrition in sugar, dairy, meat industry Weak competitiveness on world market for commodities Weak competitiveness on prices due to small agricultural concerns Agrofood industry is able to cope with these challenges : A strong image of quality products from Europe A strong network of middle-sized companies with high added value The surge of big companies in many sectors which are able to compete and develop A strong and competitive retail sector

20
Possible consequences?
2007 shock 90’s 90 90’s 07 07 Catalysers for price increases Competition for land ( biofuels) Speculation on cereals Climate Decoupling had strong effects Possible consequences?
 Speculation on cereals. Climate. Decoupling had strong effects. Possible consequences")
21
A few questions for the future
90 90’s 07 07 Localisation of production will still change In these conditions, where to process ? Prices will remain high Added value is more than ever a priority Strong domestic market is still strong and vast, with high purchase power consumers Localisation of production will still change For instance, where is the potential for milk production ? In Holland, Denmark and Poland In these conditions, where will be our factories ? Prices will remain high…mainly for meat products which will be disadvantaged Added value is more than ever a priority taking into account the new competition from developing countries However, the domestic market is strong and vast, with high purchase power consumers

22
Takeaways Weak competitiveness in terms of raw material
EU has to improve its performances in terms of structure and price But holds assets, among which: Added value, even if has to be further pushed Image Consumers

23
EU A.F. I. Today… and tomorrow Challenges

24
What can we observe today?
EU A.F.I. Today… and tomorrow Challenges What can we observe today?

25
EU Food & Drink industry ranks low
Frowth real value a dded of a specific ibdustry in total FI 6 Reflects competiton for production factors between different industries within a country Balassa index – reflects export specialisation level Growth of export share –Refects outcome of the competitive process Growth of real labour productivity- Affects unit labour cost and this way the relative prices Growth of real value added felects industrial dynamism Competitiveness of the EU Food industry LEI

26
EU Food & Drink industry ranks (usually low) by sectors
Competitiveness of the EU Food industry LEI

27
Open to the World Market EU: a major exporter – Intra EU share is hig
% processed products vs agric prod Agric. Products – export moi$ 2007 Latam Eur NA Asia AME % export-intra zone

28
Shrinking share in world trade TOP 10 exporting countries – Food products 1967 – 2007
18,1% 31,3%

29
Emergence of Brazil and China in Food&Drinks exports

30
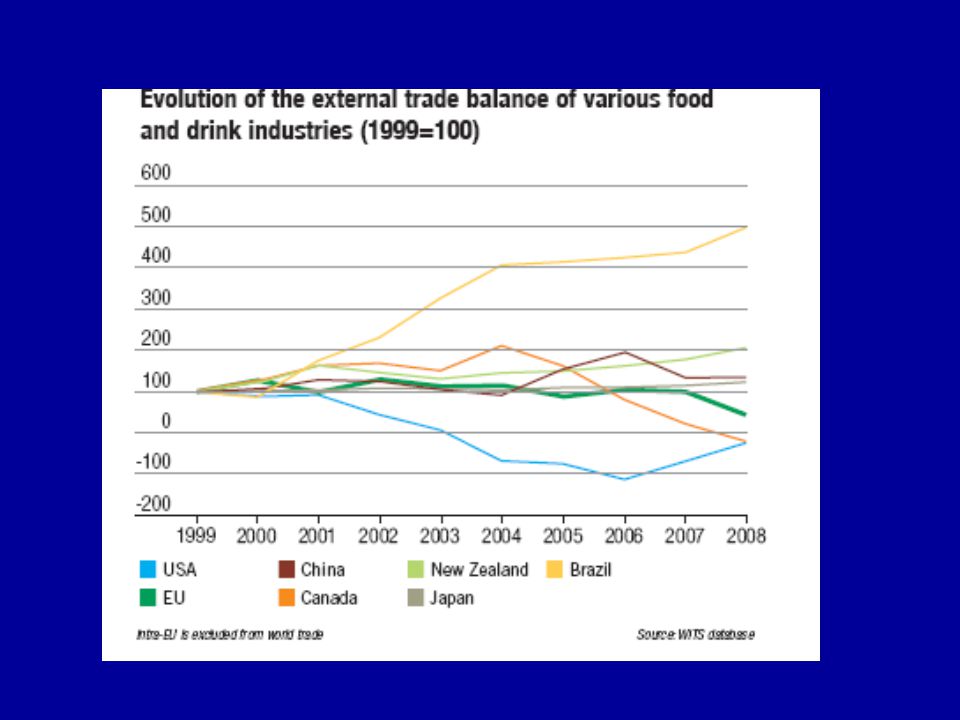
Trade balance still positive but…
Trade balance still positive but….. Trade balance of Food & Drinks industries 1999: base 100

31
To be even more accurate.. EU Food & Drink trade balance 2000-2008 (b€)
I 48,2b€ I 57,1b€ Balance 3, puis 2 en puis 1,1 en 2008

32
Importance of Intra EU trade Share of EU in Food imports by EU member states – 1967/2007

33
Selective evolution per sector EU Food & Drink sector’s balance 2005-2008 – b €

34
Is « in »… open competition
World AgriFood companies- Top 30 by Food & Drink sales WW Eur Sales – 189 b€ WW Sales – 557,5 b€ 34%

35
TOP 30 WW AFI companies

36
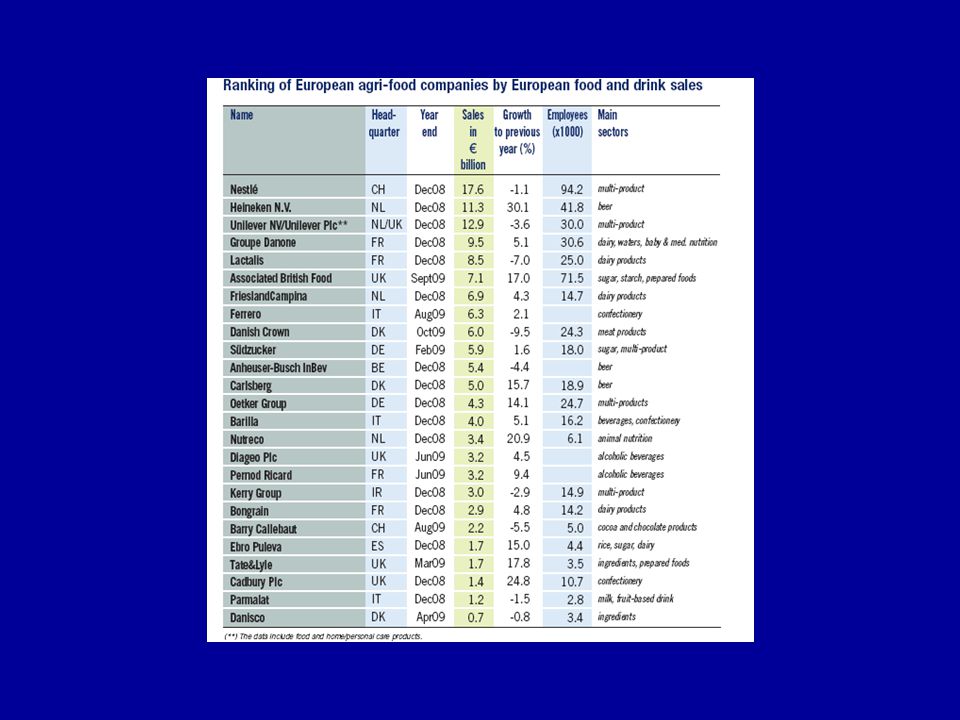
Top 30 European AFI companies by european Food & Drink sales

37
EU Agrofood Today… and tomorrow Challenges What can we see today? Why?

38
Value-added is medium, but still growing
VA/ emp - € -2006 US Canada Japon Australia UE25 Brasil China 92,3 75,3 65,3 59,2 58 25,5 12;8 Indice base Growth of value added/ employee - CIAA 2008

39
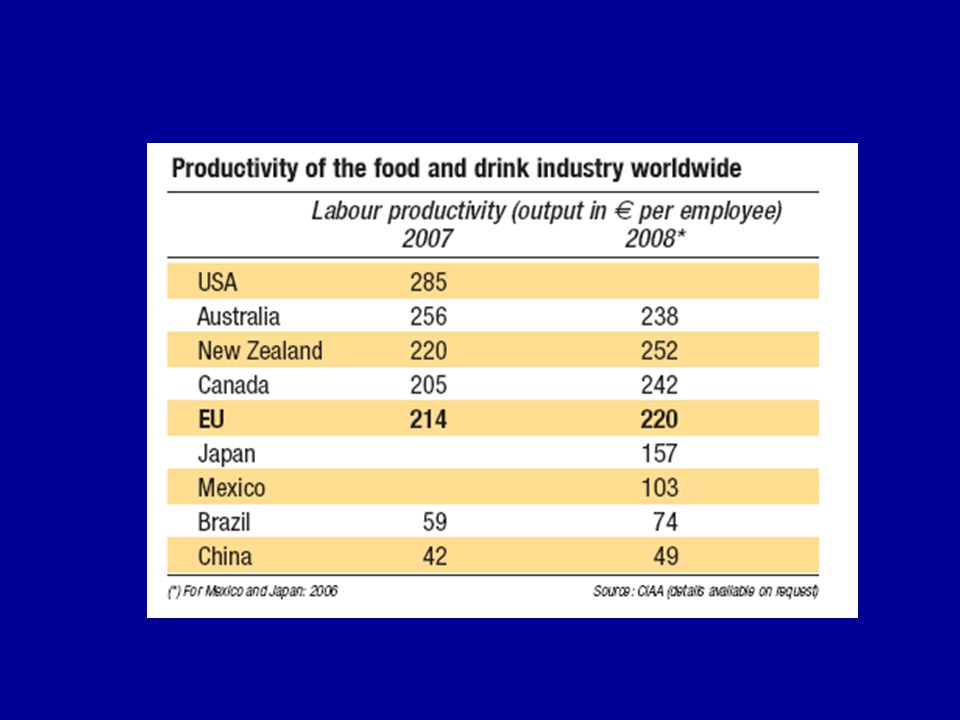
Weak in labour productivity ( worldwide comparison) 1000€/ employee – 2008
285 US EU China 49 Mostly due to SMEs 2005, Eurostat, SBS

40
Labour productivity growth
Weak in Labour productivity compared with other industries 1000€/ employee Labour productivity growth (%) -1,5% +0,1% L Prod grwth F&D 2,6% entre 96 et 2000; 2,2% entre 2000 et 2005, 0,9% entre 2005 et 2007, -1,5% 2008 2005, Eurostat, SBS
 -1,5% +0,1% L Prod grwth. F&D 2,6% entre 96 et 2000; 2,2% entre 2000 et 2005, 0,9% entre 2005 et 2007, -1,5% , Eurostat, SBS.")
41
Insufficient R&D expenditures
CIAA Report 2009

42
EU Food &Drinks low in economies of scale
Highly fragmented market 99, 1% companies are SME employing < 250pp But…. high in economies of scope Cultural differences between Specialized SMEs Consumer preference for differentiated and healthy products

43
To sum up…. Strengths & Weaknesses
Small size companies Economies of scope Economies of scale Attractiveness: labour, € Labour productivity Value added Too low RD expenditures Small size companies Economies of scope Cultural differences Attractiveness: labour force, € Value added Trade driven In open market- large companies in competition Pressuire on SMEs which have persistent lack of resoitce: fnancial K, workforce and time, little RD cap of tyheir own Trade driven Exports & Trade balance down In open market- large cies in competition

44
Opportunities & threats
EU Agrofood Today… and tomorrow Challenges Opportunities & threats

45
Population: a low « growth » EU 25 population -1980-2050
Eurostat

46
Population: less spendings in HH expenditures 1995 -2008

47
Impact of retailers in EU

48
Increasing scale of the retail chain Sales evolution in food retail and food processing 2001/2008
Global markets: global F I structure, July 29th www ers.usda.gov USDA

49
Increasing scale of the retail chain Seen from another angle Ex: price evolution along the food chain ( monthly price indices) It is a trhreat if industry scale isnt at the same lecvel

50
A threat? Comparative trends in retailing sector and AFI ( Paris stock exchange-01/91: index 100)
Sce: Datastream

51
« Cost » of raw materials
? Alimentation – Self sufficiency Alimenta tion – exportation First non food markets Energy -Carburants 1950 2000 2050 Detergents- Clothing.. … Competition from other uses Competition from other countries for food uses GMO issue ACCESSIBILITY HIGH PRICES PRICE VOLATILITY Trade « weapon »

52
Administrative « burden »
Regulatory processes in EU: cost, timeframe Difficulties for companies to deal with A way to differentiate Response to ( some class) of customer expectations Food safety/ confidence: biosafety, traceability, clean products,image, transparency.. Ethics: animal welfare… Provided the chain can afford it
 of customer expectations. Food safety/ confidence: biosafety, traceability, clean products,image, transparency.. Ethics: animal welfare… Provided the chain can afford it.")
53
EU Food regulation Entry ticket
Labelling From 323€ to 6155€/ label Compulsory nutrition labelling NOVEL Food From 4,8mio€ to 35mio€ GM rice: 3,55 / 7,5 moi€ Traçeability non listed soya GMs: 1-2,8 b€ GMO – Zero Tolérance CIAA Règlementation Etiquetage Etiquetage nutritionnel obligatoire: cout significarif pour 62% des entyreprises ss 2 moi eur.. Novel foods: en 2007 environ 7 demandes EU contre 24 en US – Cout d’une application 4 à 24 moi d’EUR incluant cours de RD…Rajouter couts EU efficacité/ décurité de 0,5 à 4,5 moi eur et des couts règlementaitres de 0,3 à 0,75 moi eur Longueur procédure acceptation + 2,5 à 3 ans Couts des incertitudes légales/ délai…. Jusqu’à 5 moi d’EUR OGM – cout estimé EU pour trouver des traces de GM non autorisés Soja est estimé entre 1 et 2,8 mrds dEUR- Incertritude légale importatreurs, Aout 2006 – traces de riz non approuvé - ds US long grain- 90% des imports arretes – Cout pour les TOP 15 Riz EU entre 3,5 et 7,5 moi d€ - Endettement Cost

54
To sum up…. Opportunities & Threats
Fragmented market Cultural differences Societal issues Health & lifestyles Sustainability Animal welfare Increasing income Central & Eastern Europe: new growth poles Ict supply management Low population growth Mature market showing signs of saturation Bargaining power of retailers getting stronger Pressure on SMEs Restriction to RM availability CAP, WTO… Non food demand Volatility of markets EU Food law procedures

55
chain rationalisation
Political & pressures: CAP Reform… Long term demand potential Safety Rising regulatory costs "Zero risk“- Law Emerging markets Outside Inside EU WTO-Rising imports Liberalization of trade Hard Discount & Retail Branding Horizontal & vertical consolidation AFI companies Developped markets Low consumption growth- mature Safety-health Retail driven supply chain rationalisation Trade weapons Social expectations Ethics Retailer concentration & internationalisation Cost reduction Rising feed, labour, fuel aggravated by currency Marketing Segmentation NPD KFC increases their “Halal Trial” in UK to 74 outlets Risk management Higher volatility in feed ingredients and exchange rates conditions 55

56
Challenges in a new globalized environment
Growing populations in emerging countries Shifts in population structures & lifestyles Change in policies Liberalization of trade Low levels of labour productivity INsufficient levels of RD investment Consumer preferences are changing Financial crisis Price volatility Ongoing consolidation of the food supply chain in favour of retailers Consumer concerns about price, food safety and health Social expectations/ ethics ICT Biotechnologies

57
AFI companies Profitability/ sector
Nestle Unilever Conagra Kraft Heinz Danone … Boissons Coca 20%!! BA: Diageo 17%, Perbnod 9% Multiproduit ( 3 à 5 métiers) 25 entreprises sur 100 dt Danone 11%, Kraft 12% Heinz 11% Pas de vorrélation entre Taille marché, profitabilité/ productivité,, technologie/ sophiostication marketing 1) Hypothese de la position dans la filière – Proximité du consommateur ( BA/ BRSA) Strayégie de rapprochement.. On verra plus tard 2) Composirion du portefeuille produit – firmes multriproduidt 3) Compétences managériales Driverfor Profitability …….Position in chain 57
 25 entreprises sur 100 dt Danone 11%, Kraft 12% Heinz 11% Pas de vorrélation entre Taille marché, profitabilité/ productivité,, technologie/ sophiostication marketing. 1) Hypothese de la position dans la filière – Proximité du consommateur ( BA/ BRSA) Strayégie de rapprochement.. On verra plus tard. 2) Composirion du portefeuille produit – firmes multriproduidt. 3) Compétences managériales. Driverfor Profitability …….Position in chain. 57.")
61
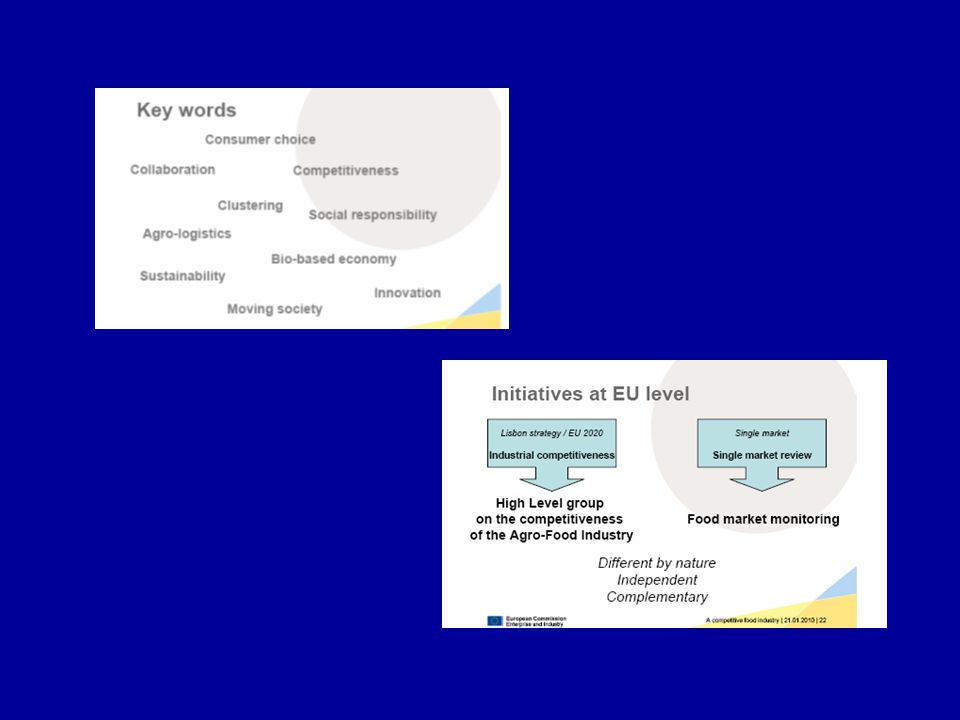
Social responsibility
A few keywords Social responsibility Consumer choice Collaboration AgroLogistics Innovation Sustainability Competitiveness Clustering Moving society

62
Pressuire on SMEs which have persistent lack of resoitce: fnancial K, workforce and time, little RD cap of tyheir own

65
Population & GDP growth
Sce IMF-UN

68
Evolution main areas in GWP parité de pouvoir d’achat 2005
Evolution main areas in GWP parité de pouvoir d’achat 2005* 1960 – 2008 (% GWP)
")
69
Evolution des PIB réels* par habitant 1960 – 2007 – US base 100

70
Major concerns for the future
Globalisation Cheap transport Cheap information transport LOw transactioncosts Structural change Mass production Economies of scale Change in trade patterns EU decrease in shares of the world market: emerging economies, barriers, custom p^roceduires ACess to good quality/ competituvely prived RM Competitoveness? Change in consumer preferences Diversified? High quality, ffordazble Sustanability etcics Biotechnologies

72
AgroFood chain: specificities
Producteurs Ingrédients Transformateurs Distributeurs PUSH PULL

73
Taux de croissance du PIB par tête en parité de pouvoir d’achat 2005
Taux de croissance du PIB par tête en parité de pouvoir d’achat 2005* (en %)
")
78
World exports by product category 1990-2007 -- Mio $ Sce: WTO

79
Power of retailing Value in Agro-Food (EU)
")
80
World exports by region 2007 -- Mio $ Sce: WTO

82
Composition des échanges agro-alimentaires mondiaux
Milliards de dollars courants * Hors échanges internes à l’Union Européenne. Source: FAO-OCDE. 82

83
Specialisation de la France Chelem-CEPII

84
Position de l’UE 15 dans le commerce agro-alimentaire
Milliards de dollars, moyennes 84

85
Composition du commerce agro-alimentaire mondial
Em % da la valeur des exportations tous produits agricoles. 85

86
Part des principaux produits agroalimentaires exportés
en pourcentage de la production mondiale Moyennes des années en %. Source : FAO 86

87
Dynamique de différenciation des produits
Nouvelles exigences des consommateurs (qualité intrinséque et extrinsèque) Certification Intégration de filière Rôle croissant dans l’organisation du commerce mondial de produits agroalimentaires. Internationalisation de la distribution Impératif de traçabilité et segrégation Nouveaux produits (biotechnologies) Intégration de filière 87
 Certification. Intégration de. filière. Rôle croissant dans l’organisation. du commerce mondial de produits. agroalimentaires. Internationalisation. de la distribution. Impératif de. traçabilité et. segrégation. Nouveaux produits. (biotechnologies) Intégration de. filière. 87.")
88
Stakes for Agrifood companies
New consumers Rising expectations Retailers Weight & Internationalisation New products GM Nanotech Product volumes Emerging countries Product quality Certifications ( intl – private) Ageing population Health Norms/ Regulation - EU Safety Traceability/ segregation Reassurance Transparency
 Ageing population. Health. Norms/ Regulation - EU. Safety. Traceability/ segregation. Reassurance. Transparency.")
89
International markets
Energy/ biofuels Social network International markets Speculation Acess to food Production Internationalisation New consumers from emerging countries Concentration Product quality Retailers Certifications ( intl – private) Health Ageing population in developped countries Transparency AFI Processing companies Traceability/ segregation Food Safety Norms/ Regulation – Ex: EU Reassurance Differenciation Choice Brand management Products
 Health. Ageing population in developped countries. Transparency. AFI Processing companies. Traceability/ segregation. Food Safety. Norms/ Regulation – Ex: EU. Reassurance. Differenciation. Choice. Brand management. Products.")
90
Nouveau fonctionnement des filières
Hier Relations traditionnelles de marché entre les opérateurs fondées Sur l’optimisation des coûts et de la logistique Industries d’intrants Agriculteurs Eleveurs Collecte Stockage Industries de transformation Distribution Normes de qualité Procès de production Securité alimentaire Transparence totale Biotechnologie Certification Aujourd’hui Coopération, coordination entre agents, decisions communes, Intégration de filière. Industries d’intrants Agriculteurs Eleveurs Collecte Stockage Industries de transformation Distribution 90

91
Rôle clé des entreprises de la distribution
Coordination des filières Internationalisation Filières intégrées (producteurs agricoles, collecteurs, transformateurs, distributeurs), agents travaillant en concertation pour assurer la traçabilité et organiser le processos de pro- duction em fonction d’um cahier des charges élaboré par le distributeur. Création de mécanismes de Certification internationale Alliances entre groupes de la distribution Altération en profondeur du fonctionnement des Filières internationales. 91
, agents. travaillant en concertation. pour assurer la traçabilité et. organiser le processos de pro- duction em fonction d’um. cahier des charges élaboré par. le distributeur. Création de mécanismes de. Certification internationale. Alliances entre groupes de. la distribution. Altération en profondeur du fonctionnement des. Filières internationales. 91.")
92
Turnover of food processing ind

93
Conditions d’accès au marché de l’Union européenne
Normes légales de production dans l’UE Obligation de respecter : - Législation sur la production agricole et l’élevage. - Interdiction de l’usage de certains intrants (hormônes) Lois sur la protection de l’environnement et le bien-être des animaux. - Obligation de traçabilité. Regime de importação - Normes techniques de l’Union européenne, Inspections vétérinaires et sanitaires, Barrières tarifaires. Législation nationale et européenne Législation européenne Normes complémentaires crées par les distributeurs et les alliances globales de distributeurs Exigences imposées aux fournisseurs Européens et non-européens Première phase : Normes de qualité intrinsèque, HACCP, traçabilité, etc... Nouvelles exigences imposées aux fournisseurs européens et non-européens. (Préservation de l’environnement et de la biodiversité, bien- être des animaux, responsabilité sociale, absence d’OGM, commerce “juste” ou “fair trade”). 93
 Lois sur la protection de l’environnement et le bien-être. des animaux. - Obligation de traçabilité. Regime de importação. - Normes techniques de l’Union européenne, Inspections vétérinaires et sanitaires, Barrières tarifaires. Législation nationale et européenne. Législation. européenne. Normes. complémentaires. crées par les. distributeurs. et les alliances globales. de distributeurs. Exigences imposées aux fournisseurs. Européens et non-européens. Première phase : Normes de qualité intrinsèque, HACCP, traçabilité, etc... Nouvelles exigences imposées aux fournisseurs européens et non-européens. (Préservation de l’environnement et de la biodiversité, bien- être des animaux, responsabilité sociale, absence d’OGM, commerce juste ou fair trade ). 93.")
94
Stratégies de différenciation des produits agricoles.
Première option : diversification de l’offre de dérivés (ex : biodiesel). Seconde option : valorisation des qualités intrinsèques du produit (tendreté, saveur, valeur diététique, éléments organoleptiques) et relier à la région d’origine. Troisième option : valorisation des qualités extrinsèques du produit (impact sur l’environnement, gestion de la biodiversité, responsabilité sociale, bien être des animaux, etc..). Quatrième option : Utiliser les apports des biotechnologies (qualité des aliments, alicaments, aliments-vaccins, qualité des fibres, etc...). Cinquième option : stratégie de marques 94
. Seconde option : valorisation des qualités intrinsèques du produit (tendreté, saveur, valeur diététique, éléments organoleptiques) et relier à la région. d’origine. Troisième option : valorisation des qualités extrinsèques du produit (impact. sur l’environnement, gestion de la biodiversité, responsabilité sociale, bien. être des animaux, etc..). Quatrième option : Utiliser les apports des biotechnologies (qualité des aliments, alicaments, aliments-vaccins, qualité des fibres, etc...). Cinquième option : stratégie de marques. 94.")
95
Essor des classes moyennes urbaines en Chine
Millions de dollars de 2000 Millions de ménages urbains Ménages pauvres (revenu annuel inférieur à 3000 US$). Classe moyenne inférieure (revenu annuel entre 3001 et 4800 US$). Classe moyenne supérieure (revenu annuel entre 4801 et US$). Classes aisées (revenu annuel supérieur à US$). Source: McKinsey company, 2006.
. Classe moyenne inférieure (revenu annuel entre 3001 et 4800 US$). Classe moyenne supérieure (revenu annuel entre 4801 et US$). Classes aisées (revenu annuel supérieur à US$). Source: McKinsey company,")
96
Idfa 2009

97
French Agro-Food Industry
M.Pourrias, Gödöllo, June 2010

98
Meat sector

99
EU-25 Annual sales/ employee-m€ annual sales exc VAT-m € F&V Dairy
Beverages Sugar Meat F&V Grain Fish Added value/ annual sales exc VAT-%

100
Dairy Annual sales/ employee-m€ annual sales exc VAT-m €
Added value/ annual sales exc VAT-%

101
Meat Annual sales/ employee-m€ annual sales exc VAT-m €
Added value/ annual sales exc VAT-%

102
F&V Annual sales/ employee-m€ Added value/ annual sales exc VAT-%

103
Beverages

104
Top players in the agri food industry
11 european companies among top 30 world 2nd- Nestle 6th – Unilever 11th – Anheuser Busch-InBev 12th- Groupe Danone 14th- Heineken NV 541 b euros for top 30 Les 10 fo nt: 181,6 soit 33%

106
Competitiveness of the EU Food industry

107
EU food industry SWOT Weak in economies of scale
WXeak in labour ptroductivity

109
Sources Competitiveness study CIAA 2009

111
Meat Direct export/ annual sales exc VAT-% annual sales exc VAT-m €
Grain Beverages Oth Food Dairy F&V Feed Fish Meat Added value/ annual sales exc VAT-%

114
European Agri Food Sales 2008- 965 b €

115
TON of food ind °03

116
Comparison Zones

117
Production value 2003 moi €

118
France 138871 sur 785244 soit 17,7% Food-no 2 apres DE Meat No1
Fish No 2 ap ES FV 3 apres DE et ES Olis 4 Dairy 1 devant DE Ceraols 1 ex aequo DE Bevergages 2 derrier DE Sigar 1

120
France

121
European Food Industry

123
Eu Main issues ksf Grow labour productivity Develop economies of scope
Encourage product innovation ( eu food law)
")
124
FRANCE

125
France

126
A strong sector – 12% of the value-added of the french industry
Among top 3 Europe players Companies – people- 130 b € and 26b€ value added Performances of SME in AFI are deteriorating, but offset by a handful of large multinationals VA 29 mrds eur personnes incluant artisans ( charcuterie – boulangerie) Germany-France-UK
 Germany-France-UK.")
127
Profiyability of french afi in line with everage for main developed countries,whereas profitabilityof french sm atypical as witnessed by profit ratio and market capitalisations More advantageous positions for largset suppliers ( high mS, product diuifrentiation, sophisticated advertising and brand management strategies)and ones occupyng prpoduct niches
and ones occupyng prpoduct niches.")
128
France Agri Food Main characteristics

129
France Export sales m€ Number of companies Beverages Oth Food Dairy
Meat Grain Last Fats & oils Feed F&V Fish Annual sales exc VAT m€

130
FRance Direct export/ annual sales exc VAT-% annual sales exc VAT-m €
Grain Beverages Oth Food Dairy F&V Feed Fish Meat Added value/ annual sales exc VAT-%

132
per employee of the french food industry

133
Fra,ce rank Among the top 100 agrifood companies WW
Danone, Lactalis, Pernof Ricard, Terrena, In Vivo

134
2009- Fortune ex °+ modif Revenues B$ Profits b$ Profits % FCP FP Bev
Cargill Nestle Unilever Pepsico Kraft Foods Archer Daniel Midlands Bunge Coca Cola Mars Wilmar International Tyson Foods Anheuser busch InBev Groupe Danone Coca Cola Enterprises Heineken Hlg Kirin hlgs 116600 101565 59313 43251 42867 69816 52574 31944 29145 28130 23568 22277 21807 21005 18604 3333 16670 7358 5142 2910 1802 1064 5807 1531 86 1885 1922 -4394 154 776 2,9 16,4 12,4 11,8 6,8 2,6 2 18,2 5,2 0,3 8 8,6 0,7 4,2 RK 48 121 175 177 93 138 259 300 313 387 413 422 442 498

135
Intra EU Competitiveness of the meat processing industry. I
Raw materials. Pigmeat, poultry &beef Volatile markets (animal health situation) Concentration of the slaughter industry. Imports limited Labour productivity. Traditional processes. Small production runs Sales A few EU/world wide appreciated products. Most national/regional products. Very limited number of customers. (Retail concentration) Low return on investment.
 Concentration of the slaughter industry. Imports limited. Labour productivity. Traditional processes. Small production runs. Sales. A few EU/world wide appreciated products. Most national/regional products. Very limited number of customers. (Retail concentration) Low return on investment.")
136
European Revenues B$ Profits b$ Profits % RK 48 121 175 177 93 138 259
300 313 387 413 422 442 498
137
Meat Fish Fresh & processed FV OIls & fats Dairy
( Rabobank 2009) Tyson foods Cargill Nippon Meat Packers Smithfield Danish Crown Vion gp Swift & Co Pilgrim’s pride Sara Lee foods Hormel foods Grampian-13 Glanbia-15 LDC-21 Marine Harvest Icelandic Unilever Young’s Bluecrest Thai union fp Pescanova Trident seafoods Cermaq The Bolton group Alfesca Dole Chiquita Fresh Del Monte Nestle Pomona Bocchi gp/ Univ Bocavor Bonduelle Mc Cain Frans Zentis Rauch Fuchsafte Montedison Spa Nisshin oils meals Bunge int ltd Raisio gp ConAgra inc Ajinomoto co Cargill inc Danone Lactalis Friesland/ Campîna Fonterra Dean foods Dairy Farmers of A Arla Kraft Parmalat Saputo Bongrain Meiji Morinaga Land o Lakes Nordmilch
 Tyson foods. Cargill. Nippon Meat Packers. Smithfield. Danish Crown. Vion gp. Swift & Co. Pilgrim’s pride. Sara Lee foods. Hormel foods. Grampian-13. Glanbia-15. LDC-21. Marine Harvest. Icelandic. Unilever. Young’s Bluecrest. Thai union fp. Pescanova. Trident seafoods. Cermaq. The Bolton group. Alfesca. Dole. Chiquita. Fresh Del Monte. Nestle. Pomona. Bocchi gp/ Univ. Bocavor. Bonduelle. Mc Cain. Frans Zentis. Rauch Fuchsafte. Montedison Spa. Nisshin oils meals. Bunge int ltd. Raisio gp. ConAgra inc. Ajinomoto co. Cargill inc. Danone. Lactalis. Friesland/ Campîna. Fonterra. Dean foods. Dairy Farmers of A. Arla. Kraft. Parmalat. Saputo. Bongrain. Meiji. Morinaga. Land o Lakes. Nordmilch.")
138
Grain & flour Starch Beer Spirits Wine
ADM Cargill ConAgra Bogarasi Soufflet Nisshin VK Muhlen Meneba Intermill Paris Cereal F P General mills Baystate Bunge Rank Hovis Cargill-Cerestar Roquette Avebe Tale & Lyle Corn products National Starch Syral –T&L Agrana In Bev / Anheuser Busch Heineken Sab Miller Carslberg/ Scottish & Newcastle Molson Coors Modelo Tsintao Kirin Diageo Pernod Ricart UB Group Bearn Glob S &W Bacardi Suntory Constellation brd Vands Brown Forman Gruppo Campari E & J Gallo Fosters gp The Wine gp Castel freres Bacardi-Martini Concha y Toro UCCOAR Henkel Soenhlein

140
Sugar Sudzucker Danisco Tereos Royal cosun Nordzucker British sugar
Azucerera Pfeifer & Langen Polski Cukier Co Pro B

141
sources Key issues for the agrifood sector Ministry of Agriculture & Fisheries Agri Food industry margins in France – Tresor-economics -No 53 March 2009

142
The disadvantages of CAP
The intervention systems have been successful and efficient …but so much efficient that they have brought out huge excess of production …and consequently huge expenses for CAP …and critics from third countries due to distorted competition …and critics from consumers and importing countries within the EU Was it good or bad for food industry ?

143
Politically, it was a success
The successes of CAP Europe has become rapidly self-sufficient The productivity of agriculture has been rapidly improved The farm restructuring has been slow, allowing to maintain many middle-size farms Responding to the necessities of land occupation Slowing the rural exodus during the 60’s and 70’s Politically, it was a success

144
R&D - % of industry output for Food & Drink industries

146
EU food & Drink sector’s balance 2005-2008 ( b€)
")
147
Share by sector of international trade ( excl. energy) 1967 – 2007
 1967 – 2007")
148
Main household expenditures in EU

149
Balance AgriFood chain 1967-2006 % of agrifood products trade – Constant price and exchange rate
Sce- CEPII-Chelem

150
Share of the house hold expenditure on Food & Drinks

152
12,9% EU Turnover 965 b € ,2%

153
Turnover of food processing ind

154
Share of the top 3 retailers

155
CAP and Agri Food businesses
2007 90’s Biofuels- Competition for land RM prices booming Consequences of decoupling CAP starts to be reformed Direct subsidies to farmers Lower farm prices Restitutions are limited Again How to compete? New outlets within EU Challenges in nutrition Competitiveness weak on world markets How to compete? Added value Concentration Delocalisation from third countries due to distorted competition No necessity to add value with marketing and innovation Emergence of big co-operatives which deal with subsidies and deliver products to intervention : they only have to manage a strategy of volume, permitted by growth of production Addiction to subsidies Weakness of marketing expenses an R&D : less necessary Few companies invest to create brands and added value, except multinationals High prices for raw material gives an easier return, it favours trade between EU member states For instance : Total world cheese trade : 1,6 MT Intra EU cheese trade : 3,4 MT Similar for sugar The strength of the single market allows small companies to be maintained without external competition The limitation of restitutions changes the scope of food industry : Less competitive on basic products Less access to third countries markets The products with high added value and brands are only able to compete Necessity to turn to EU domestic market But which products to be sold if the company has always dealt with commodities ? Volume strategy Trade between EU members

157
Shares of the major Food & Drink exporters

159
Private label share of retailers

162
Meat consumption per head/ meat type
Sce: FAOstat data

163
EU decreasing competitiveness
Competitiveness of the EU food industry – A, economic and legal assess – European communities 2007

168
Europen Food industry

169
Competitiveness of the EU food industry – A, economic and legal assess – European communities 2007

172
10 most innovative sectors in Europe 2007-2008

173
World AgriFood companies Top 30 by Food & Drink sales WW
Eur Sales – 189 b€ WW Sales – 557,5 b€ 34%

Similar presentations


 European Commission FOODIMA – Food Industry and Methodological.>")


