Download presentation
Presentation is loading. Please wait.

1
Jenna Boyle, Kerry McDermott and Rob Whitehead
The Candy Industry Jenna Boyle, Kerry McDermott and Rob Whitehead

2
Name the Brand?? Taste the rainbow
Melts in your mouth, not in your hand Gimme a break, gimme a break… Nobody better lay a finger on my… There’s no wrong way to eat a…

3
Agenda Industry Overview Advertising Analysis Pivot Table Analysis
Target Market Perceptual Map Advertising Strategies Mars Inc. The Hershey Company “The Elegants” Where the Industry is Going Recommendations

4
Why is it relevant to us? 65% percent of all American branded candy bars have been on the market more than 60 years. Americans eat approximately 25lbs of candy each a year (7.7 billion lbs total), about 60% of which is chocolate Engrained in American culture. Candy is EVERYWHERE!!!
, about 60% of which is chocolate. Engrained in American culture. Candy is EVERYWHERE!!!")
5
Industry Definition Major Products:
The Candy Production industry acquires raw materials such as cocoa, sugar, cornstarch, fruit, preservatives and flavorings to process them into a range of sugar and non-sugar based confectionery products. Major Products: Chocolate candies Sugar candies Sugarless candies Gum

6
Product Segmentation PRODUCTS AND SERVICES SEGMENTATION
Product/Services Share Candy or chocolate bars 32.70% Soft candy 23.40% Block chocolates 12.20% Industrial chocolate 9.40% Hard candy 8.90% Gum 4.70% Chocolate spreads and drinking powders Box chocolates 4.00%

7
Market Segmentation MAJOR MARKET SEGMENTS Market Segment Share
Confectionery wholesalers 61.30% Supermarkets and grocery stores 16.70% Food manufacturers 8.10% Hospitality trade 5.70% Discount stores 4.30% Direct to public 3.90%

8
Cost Structure COST STRUCTURE Item Cost % Purchases 58.30% Wages
10.10% SG&A 6.80% Depreciation 3.50% Rent 1.20% Utilities 1.10% Other 6.70% Profit 12.30% Cost structures can vary widely among industry players, depending on their size and scale of production, ease of access to production inputs, level of

9
The Production of Confectionery

10
Government Regulation
The level of regulation is heavy - All cocoa, chocolate and sugar manufacturers must meet the standards of the FDA. - Manufacturers also must comply with the hygienic regulation - Environmental regulation - Stricter labeling

11
Industry Structure Life Cycle Stage Mature Regulation Level Heavy
Revenue Volatility Low Technology Change High Capital Intensity Medium Barriers to Entry Concentration Level Competition Level

12
CR₄ and HHI The HHI for just the top 4 companies in the industry is The CR ₄ for the industry is 78.1%. Therefore, the industry is highly concentrated with only a few major firms holding a majority of the market share. HHI = 49.5²+21.6²+4²+3²= CR ₄ = = 78.1% *Hershey and Mars Inc. alone hold 71.1% of the market share. -Many mergers occur.

13
Concentration Concentration in this industry is high
This concentration of ownership is primarily a result of an increase in acquisitions, along with natural growth for a majority of major players encouraged by continued product innovation, strong brand loyalty and aggressive marketing. Ways for companies to survive: - adaptability to new trends - economies of scale - product differentiation - successful supply chain management - powerful marketing strategies******

14
Competition Quality Price Distribution Innovation and differentiation
Substitute Products Imports

15
Candy v. Chocolate CANDY HHI (for top 4) = 1141 CR ₄ = 59%
Medium level concentration ->Concentration is increasing! 1,039 businesses overall!! CHOCOLATE HHI (for top 4)= Cr ₄ = 78.1% High level of concentration 518 Businesses overall!!
= Cr ₄ = 78.1% High level of concentration. 518 Businesses overall!!")
16
Revenue for candy v. revenue for chocolate
Chocolate Confectionary Production in US Candy Production in US REVENUE GROWTH Revenue $ million Growth % 2000 16,613.30 N/A 2001 16,563.30 -0.3 2002 15,700.10 -5.2 2003 16,074.00 2.4 2004 16,150.20 0.5 2005 16,366.50 1.3 2006 16,185.50 -1.1 2007 15,200.10 -6.1 2008 13,801.20 -9.2 2009 13,180.10 -4.5 2010 14,861.60 12.8 Substitutes? REVENUE GROWTH Revenue $ million Growth % 2000 7,079.60 3.1 2001 7,201.60 1.7 2002 7,240.50 0.5 2003 6,504.50 -10.2 2004 6,621.70 1.8 2005 7,610.90 14.9 2006 6,763.10 -11.1 2007 6,919.40 2.3 2008 7,082.60 2.4 2009 7,298.10 3 2010 7,621.20 4.4

17
Total Sales for Confectionery Industry

18
Confectionery Seasonal Sales (** in millions of dollars)
projections * Valentine’s Day - $971 $1,036 $1,024 $928 $935* Easter - $1,884 $1,987 $1,846 $1,990 $1,970* Halloween - $2,146 $2,202 $2,209 $2,207 $2,225* Christmas - $1,389 $1,420 $1,376 $1,401 $1,420* * – projections for 2010 VALENTINE’S %* -9.4% -0.2% +6.7% +0.1% % EASTER %* +7.9% -7.1% +5.4% +7.0% % HALLOWEEN %* Even +0.1% +2.6% +2.8% % CHRISTMAS +1.4%* +1.8% -3.1% +2.2% +1.0% % NCA projects a 0.4% increase in 2010 for total seasonal sales

19
2010 US Confectionery Market
Retail Sales $22.5B Imports $4.7B Exports $1.895B Category Retail Sales $ Billions Imports $ billions Exports Total Confections $22.5 $4.7 $1.895 Chocolate $14.862 $3.0 $1.3 Non-Chocolate $7.621 $1.7 $.595 In the past five years, imports have increased. Confectionary and chocolate production has become increasingly globalized over the past decade, and the domestic industry is not immune to these structural changes. Until the recent downturn in the domestic economy, consumers of confectionary products made with purchased chocolate inputs were looking abroad for alternative options. The major sources of imports are from Canada and Mexico, due to favorable trading conditions under NAFTA.

20
2008 Per Capita Retail Sales
According to the US Department of Commerce, the average US consumers spent $93 on confectionery in You can see that chocolate is a bigger sector of the company than non chocolate. But overall, $100 annually is pretty large average consumption. With 300 million Americans that is pretty close to 30B in sales for the industry as a hole.

21
Overview of Industry The recent desire for healthy alternatives has required companies become more innovative. Strong brands and customer loyalty. Economies of scale and value addition during production. Despite recession, consumers still continuously consume the same amount of candy because it is and inexpensive and feel good luxury. Growth segments such as sugar-free confectionery and organic and fair-trade chocolate have shown considerable promise and are expected to continue in the next five years.

22
Demand Determinants Changing Consumer Lifestyles
Pricing and Distribution Presence of Substitutes Product Innovation Culture and Tradition

23
How to Reach Consumers: Advertising
Television Magazines Sweepstakes Radio Theme Parks Newspapers Point of Sale Displays Online

24
2010 Total Advertising Expenditures for Top Players
Hershey $404,092,700 Mars $422,510,500 Lindt $51,094,100 Nestle $743,163,800 Tootsie Roll Tootsie Pop $784,500 Jelly Belly $3,939,900

25
Advertising Analysis (2010)
")
26
Pivot Table Data

27
Adverting Based on Location

28
Advertising Expenditures based on Population
When we control for the population of the cities that were advertised in we see that the most money per capita is spent on Salt Lake City and Honolulu. The cost patterns for the other cities do go up and down but for the most part they are constant. Thus this suggests that the candy industry is further targeting these two cities above others and they are willing to pay much more to do it. It could be possible that these cities just cost more to reach or that they do not watch as much television so in order to get the same level of exposure you may advertise more. However, the more likely option is that these two markets currently do not consume large amounts of candy. Thus the industry may be trying to use a persuasive advertising strategy to try to change consumer tastes and increase demand in the market for candy. On the otherside of the coin, the largest city there which is Los Angeles has the cheapest cost per 1000 people living in the city.

29
Advertising Based on Day of Week
We can see from the following graph that the most money are spent on Tuesday ads and then Monday night ads. Ads are run with fairly consistent expenditure during Monday through Saturday except there is a large decrease in spending on Sunday. This is most likely due to the fact that the programming during the days of the week is better and therefore, they get more exposure by advertising on those days.

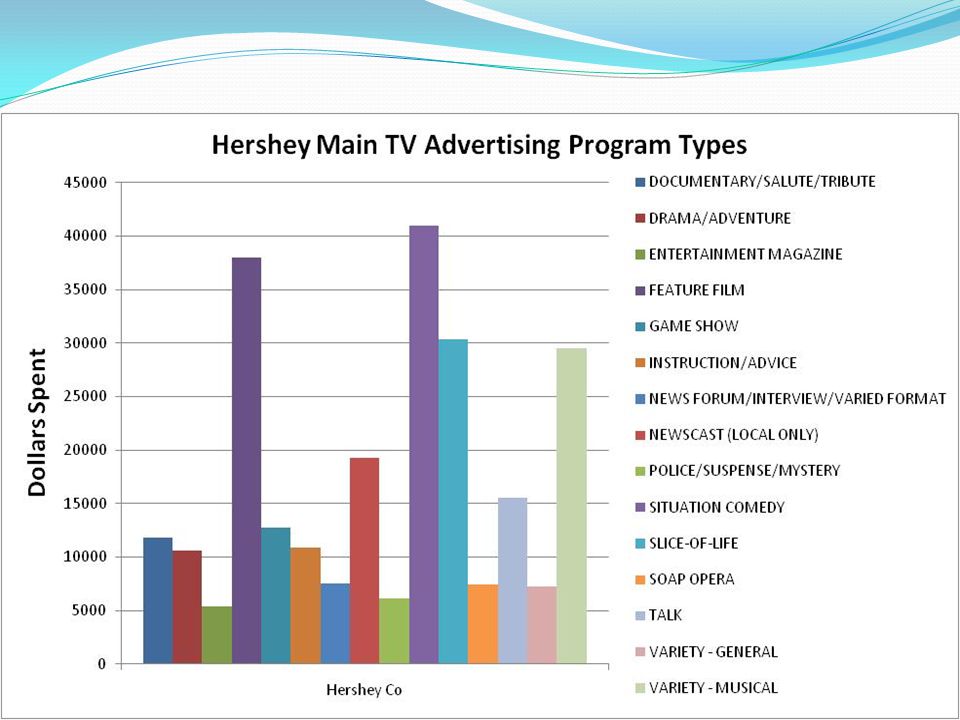
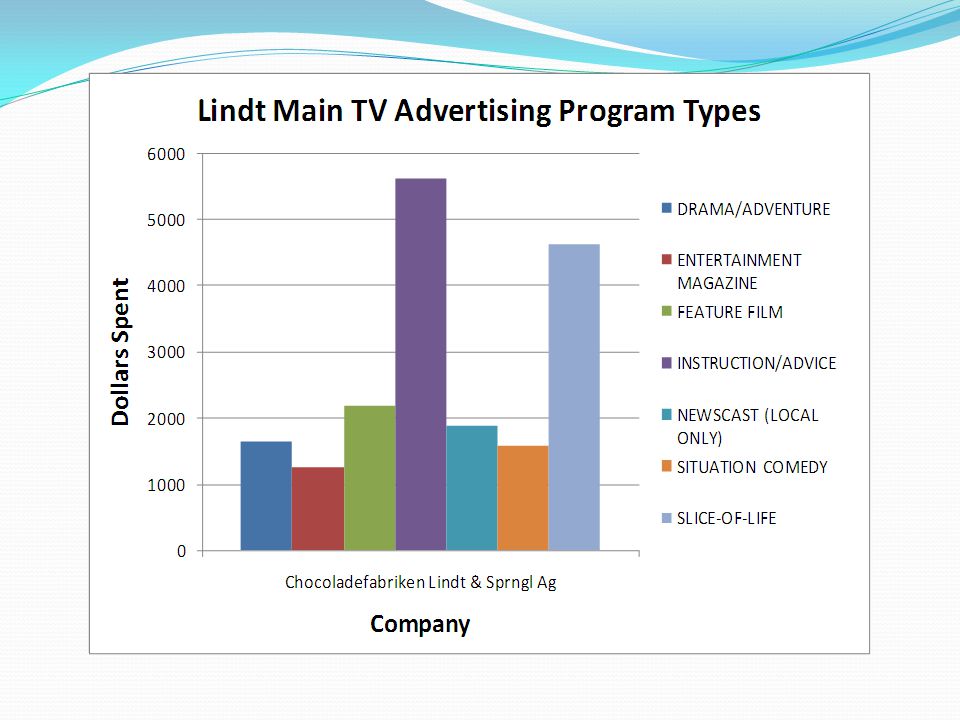
30
Total TV Advertising

32
Mars

34
Target market (based on Pivot Table)
Majority of the Market Children Age 5-24 is main target Health Conscious Parents- also a major target Increased advertising to parents about healthier candy choices, may be why parents are still so heavily targeted Premium Producers- Target educated consumers Sell luxury Target all adults

35
Annual Advertising

36
Advertising to Sales Ratio for 2010
Advertising Expenditure Advertising to Sales Ratio Mars Inc. 28,000,000,000 422,510,500 1.51% The Hershey Company 5,670,000,000 404,092,700 7.13% Lindt 2,740,000,000 51,094,100 1.86%

37
How we’re going to break it down:
Adventurous Classy Family-Oriented Free Spirited Mars Inc. Lindt&Sprungli + Ghirardelli The Hershey Company

38
Brands Adventurous Classy Family-Oriented Free Spirited Skittles
Mars Inc. Twix Hershey Lindt M&Ms Reeses Ghirardelli Snickers Dove Hershey Kisses Kit Kat Hershey Bar

39
Experience Attribute Don’t use informative
Don’t advertise place Don’t advertise price Don’t use combative/comparative Don’t do comparisons to others MEMORY JAMMING HUGE

40
Types of Advertising Used in Industry
Humor appeal Holiday Sweepstakes Point of Sale Pricing Strategy Negative to Positive Heritage Advertising Product Differentiation Brand Identity

41
Mars Overview Mars was founded in 1911 by the Frank C Mars, and the Mars Family remains privately owned to this day. Mars Inc. is one of the world's biggest private companies, with annual sales approaching $30bn. Candies included: Snickers, Twix, M&Ms, Skittles, Starburst, Milky Way, 3 Musketeers etc… Seen as Adventurous and Free-Spirited #18 Advertiser according to Advertising Age Memory Jamming Target Market:

42
Mars Incorporated Advertising
Similar strategies throughout Heritage Advertising Product Differentiation Brand identity Sweepstakes Advertising Pricing Strategy Holiday Advertising Negative to Positive Advertising Humor Appeal Mars now owns Wrigley as of April 2008 49.5%

43
Brand Identity Stick to Roots Spokescandy Huge in Differentitation
Melts in your mouth not in your hand

44
What is real? “Unreal” situations Taste the Rainbow

45
“You’re not you when you’re hungry”
America’s favorite candy bar! Satisfies hunger Celebrity “You’re not you when you’re hungry”

46
Need a moment… … Chew it over with a Twix

47
General Conclusions about Mars Inc.
Stick to roots Differentiation is key Even among own products Starburst: “It’s a juicy contradiction” 3 Musketeers: “A lighter way to enjoy chocolate” Milky Way: “Life’s better the milky way”

48
The Hershey Company Overview
Founded in 1894 Hershey Manufactures chocolate and confectionery products Largest chocolate manufacturer Major brands include:

49
Why Hershey has been so successful?
Strong financial performance Leader in confectionery products in the US due to it’s well-known brands Brand Equity Marketing Strategies (Obtaining Sales) Ability to determine consumer trends
 Ability to determine consumer trends.")
50
Financial Performance
2010 Sales $5.67B 1-Year Sales Growth 7.03% 2010 Net Income $509.80M 2010 Sales % of total US 85 Other countries 15 Total 100

51
Hershey Products Hershey’s Bliss Cookies ‘N’ Crème
Hershey’s Milk Chocolate Hugs Kisses Nuggets Sticks Eat More Good & Heath Jolly Rancher Kit Kat Milk Duds Mounds Mr. Goodbar Payday Pot Of Gold Rolo Special Dark Symphony Take5 Twizzlers Whatchamacallit Whoppers York Zagnut Zero Refreshment products Breath Savers Bubble Yum Ice Breakers York Reese’s Fast Break Nutrageous Peanut Butter Cups Pieces Reesesticks Whipps Other 5th Avenue Almond Joy Cacao Reserve Caramello

52
Hershey’s Brand Equity

53
Harris Interactive Poll
RANK 25 Highest Ranked Brands 1 Hershey's Kisses Chocolate Candy 2 M&M Plain Chocolate Candy 3 Hershey's Milk Chocolate Candy Bars 4 Google.com 5 Duracell Batteries 6 Reese's Peanut Butter Cups Chocolate Candy 7 Heinz Ketchup 8 Kleenex Facial Tissues 9 Oreo Cookies 10 Neosporin Ointment 11 Cheerios Cereal 12 Ritz Crackers 13 Kraft Foods Inc. 14 Arm & Hammer Baking Soda 15 Campbell's Soups 16 Snickers Chocolate Candy 17 Coca-Cola 18 Sharpie 19 Dawn Dish Detergent 20 Johnson & Johnson 21 Energizer Batteries 22 UPS 23 Hershey's Chocolate Chips 24 M&M Peanut Chocolate Candy 25 Hallmark Greeting Cards

54
Advertising Strategies
Brand Image/Identity Holidays Community Amusement Park

55
Brand Identity Old-fashioned Warm Family-Oriented Happy Nostalgic Love
Rascal Flatts Kisses

56
Sticking to Roots 1930s present

57
Hershey’s Slogans “There’s no wrong way to eat a Reese’s”
"Sometimes you feel like a nut, sometimes you don't" (Almond Joy) "Makes mouths happy“ (Twizzlers) "It's more than a mouthful - it's Whatchamacallit” “There’s a smile in every Hershey Bar” “Have a break, have a Kit Kat.”
 Makes mouths happy (Twizzlers) It s more than a mouthful - it s Whatchamacallit There’s a smile in every Hershey Bar Have a break, have a Kit Kat.")
58
Hershey’s Jingles “Hershey’s is the GREAT AMERICAN, GREAT AMERICAN chocolate bar!!!” “Gimme a break, Gimme a break, break me off a piece of that Kit Kat Bar.”

59
Holidays Easter Valentine’s Day Halloween Christmas

60
Community Milton Hershey School American Red Cross
Habitat for Humanity of Central Pennsylvania Children's Literacy Initiative - Lancaster, PA Hershey partners with Children’s Miracle Network

61
Amusement Parks Way for fans of Hershey to interact with the company. Increases revenue for the company Annual Sales: $270.96M Annual Net Income: $6.94M

62
Chocoladefabriken Lindt and Sprungli
Founded in 1845 in Switzerland Leading world producer of premium chocolate Brands carry the name Lindt, Ghirardelli, Caffarel etc.

63
Strengths of the Company
Strong brand name Easily able to penetrate new markets Strong Global Operation with diversified revenue base Effective Use of Advertising

64
Lindt’s Main Marketing Strategies
Product Differentiation Premium Luxury Affordable Public Relations Point of Sale Advertising and Free Samples Bundling

65
Product Differentiation
Premium quality = Premium Ingredients Affordability Public Relations

66
Upcoming Trends Showcasing your value Sugar-free
Who you can advertise too Obesity Healthy Lifestyle Employee Morale Darker Chocolate (higher cocoa content) Exotic Flavorings (e.g. citrus, fruits, spices) More upscale private label chocolate
 Exotic Flavorings (e.g. citrus, fruits, spices) More upscale private label chocolate.")
67
Things Companies Need to Think About:
Age Group Cost of Advertising Health Consciousness Per Capita Disposable Income Price of Inputs

68
Keys to Success in Future:
Our Recommendations Economies of Scale Ability to adapt to change Product Differentiation Brand Loyalty Customer Retention

69
Questions?

Similar presentations
 Entrepreneurship I.>")


