Download presentation
Presentation is loading. Please wait.

1
Accountability & Corruption in Africa Understanding the disconnect between resources and results
Nic Spaull | | nicspaull.com Columbia Teachers College (Guest Lecture) – 8 April 2014
 – 8 April")
2
Main outcomes today Understand why additional resources may not translate into improved outcomes in developing countries. Three important concepts: Accountability and corruption Isomorphic mimicry & the purpose of schooling Accountability and capacity

3
Research-led-teaching = Lecture format
Provide an example of current research and apply theory/lesson to those examples South Africa (background) Accountability & corruption Access & quality in sub-Saharan Africa Isomorphic mimicry
 Accountability & corruption. Access & quality in sub-Saharan Africa. Isomorphic mimicry.")
4
Research example #1: The case of South Africa

5
Background information
Approximately 50 million people Apartheid 11 official languages 98% primary school enrolment (but only 50% reach matric) Most unequal society in world (Gini = 0.63!)
 Most unequal society in world (Gini = 0.63!)")
6
Inequality - SA

8
Not all schools are born equal
? Pretoria Boys High School SA public schools? Different resources (Capacity) Different pressures (Accountability)
 Different pressures (Accountability)")
9
Implications for reporting and modeling??

10
High quality secondaryschool
17% Semi-Skilled (31%) Unskilled (19%) Unemployed (Broad - 33%) Labour Market High quality secondaryschool University/FET Type of institution (FET or University) Quality of institution Type of qualification (diploma, degree etc.) Field of study (Engineering, Arts etc.) High SES background +ECD High productivity jobs and incomes (17%) Mainly professional, managerial & skilled jobs Requires graduates, good quality matric or good vocational skills Historically mainly white High quality primary school Minority (20%) Unequal society Big demand for good schools despite fees Some scholarships/bursaries Vocational training Affirmative action Some motivated, lucky or talented students make the transition Low quality secondary school Majority (80%) Low SES background Attainment Quality Type Low productivity jobs & incomes Often manual or low skill jobs Limited or low quality education Minimum wage can exceed productivity Low quality primary school The QLFS classifies professions as follows: Highly skilled (legislators, senior officials and managers, professionals, technicians and associate profesionals); Semi-skilled (Clerks, service workers and shop and market personnel, skilled agricultural and fishery workers, craft and related trade workers, plant and machinery operators and assembly), Unskilled (Elementary occupations, domestic workers). cf. Servaas van der Berg – QLFS 2011
 Unskilled. (19%) Unemployed. (Broad - 33%) Labour Market. High quality secondaryschool. University/FET. Type of institution (FET or University) Quality of institution. Type of qualification (diploma, degree etc.) Field of study (Engineering, Arts etc.) High SES background. +ECD. High productivity jobs and incomes (17%) Mainly professional, managerial & skilled jobs. Requires graduates, good quality matric or good vocational skills. Historically mainly white. High quality primary school. Minority (20%) Unequal society. Big demand for good schools despite fees. Some scholarships/bursaries. Vocational training. Affirmative action. Some motivated, lucky or talented students make the transition. Low quality secondary. school. Majority (80%) Low SES background. Attainment. Quality. Type. Low productivity jobs & incomes. Often manual or low skill jobs. Limited or low quality education. Minimum wage can exceed productivity. Low quality primary school. The QLFS classifies professions as follows: Highly skilled (legislators, senior officials and managers, professionals, technicians and associate profesionals); Semi-skilled (Clerks, service workers and shop and market personnel, skilled agricultural and fishery workers, craft and related trade workers, plant and machinery operators and assembly), Unskilled (Elementary occupations, domestic workers). cf. Servaas van der Berg – QLFS")
11
NSES question 42 NSES followed about students (266 schools) and tested them in Grade 3 (2007), Grade 4 (2008) and Grade 5 (2009). Grade 3 maths curriculum: “Can perform calculations using appropriate symbols to solve problems involving: division of at least 2-digit by 1-digit numbers” Even at the end of Grade 5 most (55%+) quintile 1-4 students cannot answer this simple Grade-3-level problem. “The powerful notions of ratio, rate and proportion are built upon the simpler concepts of whole number, multiplication and division, fraction and rational number, and are themselves the precursors to the development of yet more complex concepts such as triangle similarity, trigonometry, gradient and calculus” (Taylor & Reddi, 2013: 194) Taylor, N., & Reddi, B. (2013). Writing and learning mathematics. In N. Taylor, S. Van der Berg, & T. Mabogoane, Creating Effective Schools. Cape Town: Pearson. (Spaull & Viljoen, forthcoming)
 quintile 1-4 students cannot answer this simple Grade-3-level problem. The powerful notions of ratio, rate and proportion are built upon the simpler concepts of whole number, multiplication and division, fraction and rational number, and are themselves the precursors to the development of yet more complex concepts such as triangle similarity, trigonometry, gradient and calculus (Taylor & Reddi, 2013: 194) Taylor, N., & Reddi, B. (2013). Writing and learning mathematics. In N. Taylor, S. Van der Berg, & T. Mabogoane, Creating Effective Schools. Cape Town: Pearson. (Spaull & Viljoen, forthcoming)")
12
Expenditure on education 2010/11
Total government expenditure (31% GDP in 2010/11 – R733.5bn) Government exp on education (19.5% of Gov exp: R143.1bn) 17% 5% Figures from 2012 Public Expenditure Analysis report for UNICEF/DBE (Oxford Policy Management / Stellenbosch Economics) Education exp = 6.1% of GDP Personnel exp = 78% of educ exp Personnel exp = 4.8% of GDP
 Government exp on education. (19.5% of Gov exp: R143.1bn) 17% 5% Figures from 2012 Public Expenditure Analysis report for UNICEF/DBE (Oxford Policy Management / Stellenbosch Economics) Education exp = 6.1% of GDP. Personnel exp = 78% of educ exp. Personnel exp = 4.8% of GDP.")
13
Accountability: teacher absenteeism (SACMEQ III – 2007 – 996 teachers)
Western Cape Eastern Cape Limpopo KwaZulu-Natal % absent > 1 week striking 32% 81% 97% 82% Given that SACMEQ was done in September 2007, a maximum of 159 school days could have passed, hence 3 months = 1.3 days a week % absent > 1 month (20 days) 22% 62% 48% 73% % absent > 2 months (40 days) 12% 0% 10% 5% 1.3 days a week
 22% 62% 48% 73% % absent > 2 months (40 days) 12% 0% 10% 5% 1.3 days a week.")
14
Practical examples of corruption…
Bribes Anecdotal evidence that the “going rate” for an HOD position in SA is R85,000 ($8,500) Kickbacks Anecdotal evidence that some principals and teachers arrange to split the teacher’s salary and the teacher is allowed to come only a few days a week. Fraud Ghost teachers teachers who exist only on paper (implications for student:teacher ratio Extortion Teachers who require their students to pay their “tuckshop money” in order to come to school Favoritism Certain ethnic groups can be favored when services (upgrading schools) are being rolled out All of the above have equity considerations given that they are usually more prominent in less affluent communities (which have less parental accountability)
 Kickbacks. Anecdotal evidence that some principals and teachers arrange to split the teacher’s salary and the teacher is allowed to come only a few days a week. Fraud. Ghost teachers teachers who exist only on paper (implications for student:teacher ratio. Extortion. Teachers who require their students to pay their tuckshop money in order to come to school. Favoritism. Certain ethnic groups can be favored when services (upgrading schools) are being rolled out. All of the above have equity considerations given that they are usually more prominent in less affluent communities (which have less parental accountability)")
15
Caveat: NB to remember…
Corruption is a problem but it is often correlated with many other important impediments: Lack of capacity to implement (bureaucrats) Lack of capacity to teach (teachers) Weak civil society Unhelpful norms/standards/expectations Eg of plastic surgeon & receipts in Portugal Quite difficult to isolate causal impact of corruption alone
 Lack of capacity to teach (teachers) Weak civil society. Unhelpful norms/standards/expectations. Eg of plastic surgeon & receipts in Portugal. Quite difficult to isolate causal impact of corruption alone.")
16
Research example #2: Combining access to education (enrolment) and the quality of education (learning)
 and the quality of education (learning)")
17
Access & Quality “Defining the scope of the problem of “lack of education” must begin with the objectives of education – which is to equip people with the range of competencies…necessary to lead productive and fulfilling lives fully integrated into their societies and communities. Many of the international goals are framed exclusively as targets for universal enrolments or universal completion. But getting and keeping children “in school” is merely a means to the more fundamental objectives of…. creating competencies and learning achievement” (Pritchett, 2004, p. 1).
.")
18
Access & Quality “While nearly all countries’ education systems are expanding quantitatively nearly all are failing in their fundamental purpose….. A goal of school completion alone is an increasingly inadequate guide for action…focusing on the learning achievement of all children in a cohort a [Millennium Learning Goal] eliminates the false dichotomy between “access/enrolment” and “quality of those in school”: reaching an MLG depends on both” (Filmer, Hasan, & Pritchett, 2006, p. 1).
.")
19
Status quo OR But not both
The extant literature on education in Africa is bifurcated in that reports either focus on: This is problematic for 2 reasons: The underlying assumption that enrolment and attainment are correlated with learning is often not true; Comparing learning outcomes without taking cognizance of the enrolment and dropout profiles of the countries under review is likely to bias the results. Countries with lower enrolments and higher dropout rates perform better on average, than otherwise similar countries that have higher enrolments and fewer dropouts (UNESCO, 2005, p. 48). Depend on two different data sources (population estimates and school census) NER’s very dependent on whether students are correctly aged or not (low NER due to late enrolment) (See Stukel & Feroz-Zada, 2010 of UIS) Quality of education (SACMEQ/PASEC/ TIMSS/PIRLS) Access to education (MDG/EFA/WB/IMF) But not both OR
. Depend on two different data sources (population estimates and school census) NER’s very dependent on whether students are correctly aged or not (low NER due to late enrolment) (See Stukel & Feroz-Zada, 2010 of UIS) Quality of education (SACMEQ/PASEC/ TIMSS/PIRLS) Access to education (MDG/EFA/WB/IMF) But not both. OR.")
20
Quality of education [SACMEQ] Access to education [DHS]
Current research Quality of education [SACMEQ] Access to education [DHS] Access to literacy/ numeracy Core assumptions: Schooling that does not improve cognitive outcomes is of limited value. Simple enrolment rates overstate the success of education systems in Africa. Children should have acquired basic numeracy and literacy skills by the end of grade 6. Children who do not survive to grade 6 or never enrolled in the first place are functionally illiterate and functionally innumerate.
![Quality of education [SACMEQ] Access to education [DHS]](http://slideplayer.com/slide/2431571/8/images/20/Quality+of+education+%5BSACMEQ%5D+Access+to+education+%5BDHS%5D.jpg "Current research. Quality of education [SACMEQ] Access to education [DHS] Access to literacy/ numeracy. Core assumptions: Schooling that does not improve cognitive outcomes is of limited value. Simple enrolment rates overstate the success of education systems in Africa. Children should have acquired basic numeracy and literacy skills by the end of grade 6. Children who do not survive to grade 6 or never enrolled in the first place are functionally illiterate and functionally innumerate.")
21
(Hanushek & Woessmann, 2008)
(Spaull & Taylor, 2014) (Hanushek & Woessmann, 2008)
 (Hanushek & Woessmann, 2008)")
22
Access-to-literacy & Access-to-numeracy

23
Literacy gaps by gender, location & wealth

24
5 stylized facts about primary education in SSA…

25
1) In all countries the access-to-literacy gap between rich & poor >>> boys & girls
 In all countries the access-to-literacy gap between rich & poor >>> boys & girls")
26
In poorer countries boys have higher access-to-literacy and access-to-numeracy rates than girls, while in wealthier countries girls have higher access-to-literacy and access-to-numeracy rates than boys. 2)
")
27
2b) In looking at gender there is both a pro-boy access component and a pro-boy learning component in poorer (pro-boy) countries. In wealthier countries pro-girl A-to-L rates primarily due to more learning in school than access/survival advantages
 countries. In wealthier countries pro-girl A-to-L rates primarily due to more learning in school than access/survival advantages.")
28
Poor girls in poor countries face a double disadvantage of being socially excluded from education (Lewis & Lockheed, 2007) 3)
")
29
Lesotho is a peculiar case
4)
")
30
Even for the most disadvantaged country/group, INITIAL access is far less of a problem than SURVIVAL to grade 6 5)
")
31
But how does all of this link to corruption/accountability?

32
Accountability & corruption
Increased allocation of resources Increased resources “on-the-ground” Improvement in student outcomes CORRUPTION CORRUPTION Often people speak about these three things interchangeably

33
Pritchett, 2011

34
Embezzlement Bribery Fraud Extortion Favoritism DEFINITION
Theft of public resources by public officials Payment (in money or in kind) given or taken in a corrupt relationship Economic crime that involved some kind of trickery, swindle or deceit Money & other resources extracted by the use of coercion, violence or threats to use force Mechanism of power abuse implying ‘privatization’ and a highly biased distribution of state resources FAMILY OF TERMS Misappropriation, diversion, leakage, capture of funds Kickbacks, gratuities, baksheesh, pay-offs, speed and grease money Forgery, smuggling, counterfeit Blackmail, informal taxation Nepotism, cronyism, clientelism, bias EXAMPLES FROM EDUCATION SECTOR Educational funds used for political campaigns. School funds diverted for private interest. Bribes paid to be recruited as a teacher. Bribes paid to be admitted to university Ghost teachers. Paper mills and diploma mills Illegal fees collected to be admitted to school. Sexual harassment for promotion Recruitment of administrators based on their membership of a political party. Good marks obtained due to favoritism. (Source: Amundsen, 2000 cited in Kurpe, Olive & Reeve 2011)
 given or taken in a corrupt relationship. Economic crime that involved some kind of trickery, swindle or deceit. Money & other resources extracted by the use of coercion, violence or threats to use force. Mechanism of power abuse implying ‘privatization’ and a highly biased distribution of state resources. FAMILY OF TERMS. Misappropriation, diversion, leakage, capture of funds. Kickbacks, gratuities, baksheesh, pay-offs, speed and grease money. Forgery, smuggling, counterfeit. Blackmail, informal taxation. Nepotism, cronyism, clientelism, bias. EXAMPLES FROM EDUCATION SECTOR. Educational funds used for political campaigns. School funds diverted for private interest. Bribes paid to be recruited as a teacher. Bribes paid to be admitted to university. Ghost teachers. Paper mills and diploma mills. Illegal fees collected to be admitted to school. Sexual harassment for promotion. Recruitment of administrators based on their membership of a political party. Good marks obtained due to favoritism. (Source: Amundsen, 2000 cited in Kurpe, Olive & Reeve 2011)")
35
Practical examples: leakages in Uganda
Capitation grant covering non-wage expenditure, financed and run by central govt (using province & district as distribution channels) sending money to schools. In 1995 only 20% of money allocated to the school actually reached the school (funding leaks) Information campaign published budget-flows to districts (incl amounts and dates) in national newspapers incl local-language editions. By % of money allocated to the school actually reached the school. See Reinikka & Svensson (2005, 2006)
 sending money to schools. In 1995 only 20% of money allocated to the school actually reached the school (funding leaks) Information campaign published budget-flows to districts (incl amounts and dates) in national newspapers incl local-language editions. By % of money allocated to the school actually reached the school. See Reinikka & Svensson (2005, 2006)")
36
Practical examples: leakages in CSG

37
Conclusions Important to understand what form/level of corruption we are talking about (limited number of million $ tenders or thousands of small-scale bribes?) Why do/should we care about corruption? To what extent are everyday corrupt behaviors embedded in the institutional/cultural/societal norms and expectations? Important when thinking about remedies. (i.e. is it opportunistic or is it systemic?) Understanding the scale of the problem and where corruption fits into the overall “diagnosis” of the education problem – corruption may not be the binding constraint to progress There is some level of corruption in every country (often it just takes different forms. For the US, highlighting corruption as the most important problem to eliminate in order to improve education is silly, likewise with many developing countries. See these problems in perspective.
 Why do/should we care about corruption To what extent are everyday corrupt behaviors embedded in the institutional/cultural/societal norms and expectations Important when thinking about remedies. (i.e. is it opportunistic or is it systemic ) Understanding the scale of the problem and where corruption fits into the overall diagnosis of the education problem – corruption may not be the binding constraint to progress. There is some level of corruption in every country (often it just takes different forms. For the US, highlighting corruption as the most important problem to eliminate in order to improve education is silly, likewise with many developing countries. See these problems in perspective.")
38
Comments & Questions. Slides & research available at nicspaull
Comments & Questions? Slides & research available at nicspaull.com/research

39
Accountability and the principal-agent problem

40
Principal-Agent Problem
Asymmetric information (Parents do not know what’s going on in the classroom) On behalf of PRINCIPAL (Parents) Accountable to Employs AGENT (Teacher) To perform Task (Teaching)
 On behalf of. PRINCIPAL. (Parents) Accountable to. Employs. AGENT. (Teacher) To perform. Task. (Teaching)")
41
Principal-Agent Problem
Principal (country’s MoE) would like to ensure that its agents (school directors and teachers) deliver schooling that results in learning Difficult because education is: Discretionary Teachers use judgment to decide what to teach and how Variable Teacher must customize services to students with different aptitudes, motivations and learning styles Transaction intensive Repeated & frequent interactions between teachers and students (Bruns, Filmer & Patrinos, 2013: 11)
 would like to ensure that its agents (school directors and teachers) deliver schooling that results in learning. Difficult because education is: Discretionary. Teachers use judgment to decide what to teach and how. Variable. Teacher must customize services to students with different aptitudes, motivations and learning styles. Transaction intensive. Repeated & frequent interactions between teachers and students. (Bruns, Filmer & Patrinos, 2013: 11)")
42
Long route of accountability
Accountability framework Bruns, Filmer & Patrinos (2013) and WDR (2004) The State Long route of accountability Voice/politics Compact See also Short route to accountability Client power Citizens/clients Providers
 and WDR (2004) The State. Long route of accountability. Voice/politics. Compact. See also Short route to accountability. Client power. Citizens/clients. Providers.")
43
WDR 2004

44
Breaks in the chain Often the long-route to accountability involves many links… Citizens government Ministry of education service providers district officials circuit officials principals teachers A break in the chain at any of these levels means that the accountability “chain” is broken. Link 1: Poor people may not have sufficient “voice” to influence politicians lions share of public schooling expenditures may go to urban schools Link 2: Policy-makers may not be able to hold providers accountable eg. absentee teachers

45
Breaks in the chain Often there is a focus on the second link (for example trying to decrease absenteeism using camera’s in classroom’s) but if the first link is broken (dysfunctional politics) nothing will happen Before trying to fix incentives to providers we need to work on incentives facing politicians
 but if the first link is broken (dysfunctional politics) nothing will happen. Before trying to fix incentives to providers we need to work on incentives facing politicians.")
46
Principal-agent problem – multiple principals and multiple agents
Principal-agent problem – multiple principals and multiple agents. Who to please? AGENT PRINCIPAL Government Min of Ed District Principal Teachers Citizen Ministry of Education District officials Parents Depending on who the “agent” sees as their “principal”, they will act differently. Often concerns of parents not major factor. NB power relations between parents and principals in Africa

47
When it’s not corruption: Accountability and capacity

48
Accountability & capacity
Increased allocation of resources Increased resources “on-the-ground” Improvement in student outcomes CAPACITY CAPACITY

49
Accountability and capacity
Many of the arguments put forward by Elmore et al have relevance when discussing the break-down between resources and results in Africa

50
Accountability without capacity
“Accountability systems and incentive structures, no matter how well designed, are only as effective as the capacity of the organization to respond. The purpose of an accountability system is to focus the resources and capacities of an organization towards a particular end. Accountability systems can’t mobilize resources that schools don’t have...the capacity to improve precedes and shapes schools’ responses to the external demands of accountability systems (Elmore, 2004b, p. 117). “If policy-makers rely on incentives for improving either a school or a student, then the question arises, incentives to do what? What exactly should educators in failing schools do tomorrow - that they do not do today - to produce more learning? What should a failing student do tomorrow that he or she is not doing today?” (Loveless, 2005, pp. 16, 26).
. If policy-makers rely on incentives for improving either a school or a student, then the question arises, incentives to do what What exactly should educators in failing schools do tomorrow - that they do not do today - to produce more learning What should a failing student do tomorrow that he or she is not doing today (Loveless, 2005, pp. 16, 26).")
51
Capacity without accountability
“In the absence of accountability sub-systems, support measures are very much a hit and miss affair. Accountability measures provide motivation for and direction to support measures, by identifying capacity shortcomings, establishing outcome targets, and setting in place incentives and sanctions which motivate and constrain teachers and managers throughout the system to apply the lessons learned on training courses in their daily work practices. Without these, support measures are like trying to push a piece of string: with the best will in the world, it has nowhere to go. Conversely, the performance gains achieved by accountability measures, however efficiently implemented, will reach a ceiling when the lack of leadership and technical skills on the part of managers, and curricular knowledge on the part of teachers, places a limit on improved performance. Thus, the third step in improving the quality of schooling is to provide targeted training programs to managers and teachers. To achieve optimal effects, these will need to connect up with and be steered by accountability measures” (Taylor, 2002, p. 17).
.")
52
From a forthcoming report on accountability on the

58
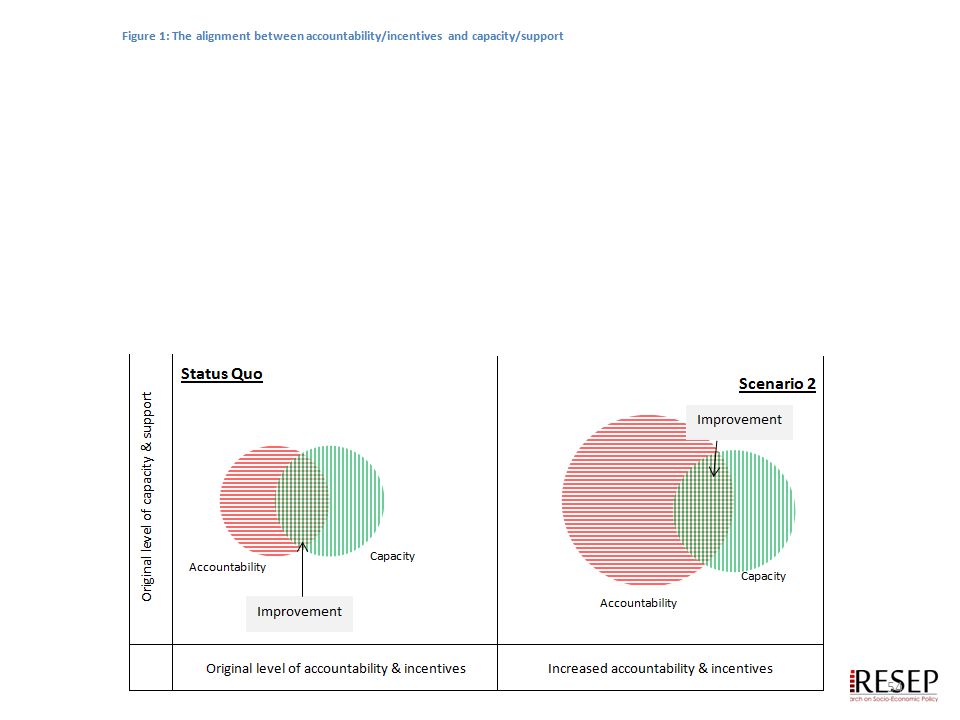
“Only when schools have both the incentive to respond to an accountability system as well as the capacity to do so will there be an improvement in student outcomes.” (p22)
")
59
Why don’t resources translate into results in most African countries?
Principal-agent problem Widespread corruption No accountability (i.e. no consequences for non-performance) Inability/incapacity to implement policy Lack of skills and institutional capacity to implement (sometimes complex) policies. Usually a mixture of all of the above. Example of the Limpopo textbook saga in SA
 Inability/incapacity to implement policy. Lack of skills and institutional capacity to implement (sometimes complex) policies. Usually a mixture of all of the above. Example of the Limpopo textbook saga in SA.")
60
Motivation for increasing resources
Basic dignity rationale (ethics / human rights) Water, sanitation, electricity, brick buildings (Minimum Norms and Standards) Improving learning outcomes rationale (achievement) Existing research in SA shows exceedingly weak link between increased expenditures and improved outcomes Allocation of new resources rarely based on evidence (‘I had a dream’ approach to policymaking) LTSM / workbooks Grade R Libraries and laboratories? (difficult to motivate) Nutrition programs (extending to high school?)
 Water, sanitation, electricity, brick buildings. (Minimum Norms and Standards) Improving learning outcomes rationale (achievement) Existing research in SA shows exceedingly weak link between increased expenditures and improved outcomes. Allocation of new resources rarely based on evidence (‘I had a dream’ approach to policymaking) LTSM / workbooks. Grade R. Libraries and laboratories (difficult to motivate) Nutrition programs (extending to high school )")
61
Pro-poor allocation of resources?
Are there real/significant differences in household SES and school resources between Q1, Q2 and Q3? Rethinking how we measure quintiles Is the allocation of financial resources pro-poor? Allocated resources vs realized resources (differential efficiency) (Taylor 2011) Pre and post parental ‘top-ups’/fees? Is the allocation of human resources pro-poor? How do we incentivize the best teachers to teach in the poorest schools?
 (Taylor 2011) Pre and post parental ‘top-ups’/fees Is the allocation of human resources pro-poor How do we incentivize the best teachers to teach in the poorest schools")
62
Important distinctions
Improved student outcomes Increased resources “on-the-ground” Increased allocation of resources Often these 3 are spoken about interchangeably

63
Important distinctions
Improved student outcomes Increased resources “on-the-ground” Increased allocation of resources Inefficiency / corruption

64
Important distinctions
Improved student outcomes Increased resources “on-the-ground” Increased allocation of resources Inefficiency / corruption Lack of capacity

65
Important distinctions
Improved student outcomes Increased resources “on-the-ground” Increased allocation of resources Inefficiency / corruption Lack of capacity Lack of accountability

66
Accountability & Capacity

67
Conclusion Ensuring that public funding is actually pro-poor and also that it actually reaches the poor. Understanding whether the motivation is for human dignity reasons or improving learning outcomes. Ensuring that additional resources are allocated based on evidence rather than anecdote. The need for BOTH accountability AND capacity.

68
Some questions to think about:
In the South African education system, What are the capacity-building opportunities available to teachers? What consequences (if any) revert in the event of non-performance? How can ANA be used for accountability? Example of balancing the rights and concernes
 revert in the event of non-performance How can ANA be used for accountability Example of balancing the rights and concernes.")
69
Binding constraints approach

73
“The left hand barrel has horizontal wooden slabs, while the right hand side barrel has vertical slabs. The volume in the first barrel depends on the sum of the width of all slabs. Increasing the width of any slab will increase the volume of the barrel. So a strategy on improving anything you can, when you can, while you can, would be effective. The volume in the second barrel is determined by the length of the shortest slab. Two implications of the second barrel are that the impact of a change in a slab on the volume of the barrel depends on whether it is the binding constraint or not. If not, the impact is zero. If it is the binding constraint, the impact will depend on the distance between the shortest slab and the next shortest slab” (Hausmann, Klinger, & Wagner, 2008, p. 17). Hausmann, R., Klinger, G., & Wagner, R. (2008). Doing Growth Diagnostics in Practice: A 'Mindbook'. CID Workinf Paper No Center for International Development at Harvard University.
. Doing Growth Diagnostics in Practice: A Mindbook . CID Workinf Paper No Center for International Development at Harvard University.")
74
Basic Literacy and Numeracy (Gr 6)
What proportion of South African grade 6 children were functionally literate and functionally numerate? Functionally illiterate: a functionally illiterate learner cannot read a short and simple text and extract meaning. Functionally innumerate: a functionally innumerate learner cannot translate graphical information into fractions or interpret everyday units of measurement.

75
Grade 6 Literacy SA Gr 6 Literacy Kenya Gr 6 Literacy 1% 5% 7% 25% 49%
46% Technically it is never enrolled or dropped out before grade 6 (using DHS data) – see Taylor and Spaull (Forthcoming) 39% Public current expenditure per pupil: $1225 Public current expenditure per pupil: $258 Additional resources is not the answer 27%
 – see Taylor and Spaull (Forthcoming) 39% Public current expenditure per pupil: $1225. Public current expenditure per pupil: $258. Additional resources is not the answer. 27%")
76
Accountability: teacher absenteeism (SACMEQ III – 2007 – 996 teachers)
4th/15 Absenteeism here is average between both maths and reading teachers

77
Accountability: teacher absenteeism (SACMEQ III – 2007 – 996 teachers)
15th/15 Absenteeism here is average between both maths and reading teachers

78
$ Benefits of education Economy Health Society Ed H S Ec
Improved human rights Empowerment of women Reduced societal violence Promotion of a national (as opposed to regional or ethnic) identity Increased social cohesion Lower fertility Improved child health Preventative health care Demographic transition Improvements in productivity Economic growth Reduction of inter-generational cycles of poverty Reductions in inequality $ Economy Health Society Specific references: lower fertility (Glewwe, 2002), improved child health (Currie, 2009), reduced societal violence (Salmi, 2006), promotion of a national - as opposed to a regional or ethnic - identity (Glewwe, 2002), improved human rights (Salmi, 2006), increased social cohesion (Heyneman, 2003), Economic growth – see any decent Macro textbook, specifically for cognitive skills see (Hanushek & Woessman 2008)
 identity. Increased social cohesion. Lower fertility. Improved child health. Preventative health care. Demographic transition. Improvements in productivity. Economic growth. Reduction of inter-generational cycles of poverty. Reductions in inequality. $ Economy. Health. Society. Specific references: lower fertility (Glewwe, 2002), improved child health (Currie, 2009), reduced societal violence (Salmi, 2006), promotion of a national - as opposed to a regional or ethnic - identity (Glewwe, 2002), improved human rights (Salmi, 2006), increased social cohesion (Heyneman, 2003), Economic growth – see any decent Macro textbook, specifically for cognitive skills see (Hanushek & Woessman 2008)")
79
Accountability: teacher absenteeism
Teacher absenteeism is regularly found to be an issue in many studies 2007: SACMEQ III conducted – 20 days average in 2007 2008: Khulisa Consortium audit – HSRC (2010) estimates that days of regular instructional time were lost due to leave in 2008 2010: “An estimated 20 teaching days per teacher were lost during the 2010 teachers’ strike” (DBE, 2011: 18) Importantly this does not include time lost where teachers were at school but not teaching scheduled lessons A recent study observing 58 schools in the North West concluded that “Teachers did not teach 60% of the lessos they were scheduled to teach in North West” (Carnoy & Chisholm et al, 2012) Also see Chisholm (2005) and Shisana et al (2005) quoted in HSRC (2010)
 estimates that days of regular instructional time were lost due to leave in : An estimated 20 teaching days per teacher were lost during the 2010 teachers’ strike (DBE, 2011: 18) Importantly this does not include time lost where teachers were at school but not teaching scheduled lessons. A recent study observing 58 schools in the North West concluded that Teachers did not teach 60% of the lessos they were scheduled to teach in North West (Carnoy & Chisholm et al, 2012) Also see Chisholm (2005) and Shisana et al (2005) quoted in HSRC (2010)")
80
Two school systems not one?
Socioeconomic Status Grade 6 [2007] Data: SACMEQ (Spaull, 2011)
")
81
Gr 1 - Gr 2 - Gr 3 – Gr 4 – Gr 5 – Gr 6 – Gr 7 – Gr 8 – Gr 9 - Gr 10 – Gr 11 – Gr 12
Foundation Phase Intermediate Phase Senior Phase FET Phase PIRLS 2006 – see Shepherd (2011) prePIRLS 2011 Grade 4 – all 11 languages 433 schools, students ____________________________________ Underperformance 29% of gr4 students did not reach the low international benchmark – they could not read SA performs similarly to Botswana, but 3 years learning behind average Columbian Gr4 Inequality Linguistic inequalities: Large differences by home language – Xitsonga, Tshivenda and Sepedi students particularly disadvantaged PIRLS (2006) showed LARGE differences between African language schools and Eng/Afr schools Howie et al (2011) *Data now available for download
 prePIRLS Grade 4 – all 11 languages. 433 schools, students. ____________________________________. Underperformance. 29% of gr4 students did not reach the low international benchmark – they could not read. SA performs similarly to Botswana, but 3 years learning behind average Columbian Gr4. Inequality. Linguistic inequalities: Large differences by home language – Xitsonga, Tshivenda and Sepedi students particularly disadvantaged. PIRLS (2006) showed LARGE differences between African language schools and Eng/Afr schools. Howie et al (2011) *Data now available for download.")
82
3 biggest challenges - SA
Failure to get the basics right Children who cannot read, write and compute properly (Functionally illiterate/innumerate) after 6 years of formal full-time schooling Often teachers lack even the most basic knowledge Equity in education 2 education systems – dysfunctional system operates at bottom of African countries, functional system operates at bottom of developed countries. More resources is NOT the silver bullet – we are not using existing resources Lack of accountability Little accountability to parents in majority of school system Little accountability between teachers and Department Teacher unions abusing power and acting unprofessionally
 after 6 years of formal full-time schooling. Often teachers lack even the most basic knowledge. Equity in education. 2 education systems – dysfunctional system operates at bottom of African countries, functional system operates at bottom of developed countries. More resources is NOT the silver bullet – we are not using existing resources. Lack of accountability. Little accountability to parents in majority of school system. Little accountability between teachers and Department. Teacher unions abusing power and acting unprofessionally.")
83
Way forward? Acknowledge the extent of the problem Focus on the basics
Low quality education is one of the three largest crises facing our country (along with HIV/AIDS and unemployment). Need the political will and public support for widespread reform. Focus on the basics Every child MUST master the basics of foundational numeracy and literacy these are the building blocks of further education – weak foundations = recipe for disaster Teachers need to be in school teaching (re-introduce inspectorate?) Every teacher needs a minimum competency (basic) in the subjects they teach Every child (teacher) needs access to adequate learning (teaching) materials Use every school day and every school period – maximise instructional time Increase information, accountability & transparency At ALL levels – DBE, district, school, classroom, learner Strengthen ANA Set realistic goals for improvement and hold people accountable
. Need the political will and public support for widespread reform. Focus on the basics. Every child MUST master the basics of foundational numeracy and literacy these are the building blocks of further education – weak foundations = recipe for disaster. Teachers need to be in school teaching (re-introduce inspectorate ) Every teacher needs a minimum competency (basic) in the subjects they teach. Every child (teacher) needs access to adequate learning (teaching) materials. Use every school day and every school period – maximise instructional time. Increase information, accountability & transparency. At ALL levels – DBE, district, school, classroom, learner. Strengthen ANA. Set realistic goals for improvement and hold people accountable.")
84
When faced with an exceedingly low and unequal quality of education do we….
A) Increase accountability {US model} Create a fool-proof highly specified, sequenced curriculum (CAPS/workbooks) Measure learning better and more frequently (ANA) Increase choice/information in a variety of ways B) Improve the quality of teachers {Finnish model} Attract better candidates into teaching degrees draw candidates from the top (rather than the bottom) of the matric distribution Increase the competence of existing teachers (Capacitation) Long term endeavor which requires sustained, committed, strategic, thoughtful leadership (something we don’t have) C) All of the above {Utopian model} Perhaps A while we set out on the costly and difficult journey of B??
 Increase accountability {US model} Create a fool-proof highly specified, sequenced curriculum (CAPS/workbooks) Measure learning better and more frequently (ANA) Increase choice/information in a variety of ways. B) Improve the quality of teachers {Finnish model} Attract better candidates into teaching degrees draw candidates from the top (rather than the bottom) of the matric distribution. Increase the competence of existing teachers (Capacitation) Long term endeavor which requires sustained, committed, strategic, thoughtful leadership (something we don’t have) C) All of the above {Utopian model} Perhaps A while we set out on the costly and difficult journey of B")
Similar presentations


 2008 The McGraw Hill Companies Redesigning Teacher Salary Structures School Finance: A Policy Perspective, 4e Chapter 12.>")
 pantry survey found that.>")


 Grants Chapter 6.>")


