Download presentation
Presentation is loading. Please wait.

1
Quality assurance & control
Beyond the Basics Jaleh Gholami MD,MPH, PhD candidate

2
Accuracy of research The inferences made from results of epidemiologic research depends on the accuracy of its methods and procedures.

3
Quality Assurance & Quality Control
The activities to ensure quality of the data before data collection are regarded as quality assurance. Quality Control: The efforts to monitor and maintain the quality of data during the conduct of the study are regarded as quality control.

4
Quality Assurance Study protocol :
consist of a description of the general components of the investigation (10 steps).
.")
5
Key features of the design of an epidemiologic study
Formulation of study’s main hypothesis/ hypotheses (QA) A priori specification of potential confounding variables (QA). Definition of the characteristics of the study population for external validity (generalizability) purposes (QA). Definition of the design strategy (e.g., cohort, case-control, case-cohort) and the groups to be compared, and specification of selection procedures of internal validity. (QA) Definition of the design strategy and samples for studies of reliability and validity (QA/QC)
 A priori specification of potential confounding variables (QA). Definition of the characteristics of the study population for external validity (generalizability) purposes (QA). Definition of the design strategy (e.g., cohort, case-control, case-cohort) and the groups to be compared, and specification of selection procedures of internal validity. (QA) Definition of the design strategy and samples for studies of reliability and validity (QA/QC)")
6
Key features of the design of an epidemiologic study
6. specification of the study power necessary to detect the hypothesized association(s) at a given level of significance (QA). 7. standardization of procedures (QA) activities during data collection, including analysis of quality control and remedial actions (QC). Data Analysis Reporting of data
 at a given level of significance (QA). 7. standardization of procedures (QA) activities during data collection, including analysis of quality control and remedial actions (QC). Data Analysis. Reporting of data.")
7
Key features of the design of an epidemiologic study
Formulation of study’s main hypothesis/ hypotheses (QA) Specify: the independent variable(risk factor) the dependent variable (disease) the potential effect modifiers
 Specify: the independent variable(risk factor) the dependent variable (disease) the potential effect modifiers.")
8
Key features of the design of an epidemiologic study
2. A priori specification of potential confounding variables (QA). Review of pertinent literature helps: identifying the main confounding variables choosing the most appropriate study design selecting the data that need to be collected.
. Review of pertinent literature helps: identifying the main confounding variables. choosing the most appropriate study design. selecting the data that need to be collected.")
9
Key features of the design of an epidemiologic study
3. Definition of the characteristics of the study population for external validity (generalizability) purposes (QA). Whether findings are applicable to other population (distribution of effect modifiers and population characteristics). فراوانی اعتیاد، تغذیه و نظایر آن در دانش آموزان 12 تا 18 ساله در مدارس قابل تعمیم به جامعه نمی باشد.
 purposes (QA). Whether findings are applicable to other population (distribution of effect modifiers and population characteristics). فراوانی اعتیاد، تغذیه و نظایر آن در دانش آموزان 12 تا 18 ساله در مدارس قابل تعمیم به جامعه نمی باشد.")
10
Key features of the design of an epidemiologic study
4. Definition of the design strategy (e.g., cohort, case-control, case-cohort) and the groups to be compared, and specification of selection procedures of internal validity. (QA) - prevention of selection bias, search for confounders, ..
 and the groups to be compared, and specification of selection procedures of internal validity. (QA) - prevention of selection bias, search for confounders, ..")
11
Key features of the design of an epidemiologic study
5. Definition of the design strategy and samples for studies of reliability and validity (QA/QC) - gold standard and samples for studies of repeat measurements.
 - gold standard and samples for studies of repeat measurements.")
12
Key features of the design of an epidemiologic study
6. specification of the study power necessary to detect the hypothesized association(s) at a given level of significance (QA). - sample size determinant to have sufficient power at a given alpha error level.
 at a given level of significance (QA). - sample size determinant to have sufficient power at a given alpha error level.")
13
Key features of the design of an epidemiologic study
7. standardization of procedures (QA) - preparation of written manuals that contain a detailed description of the procedures for selection of the study population and data collection, as well as training and certification of staff.
 - preparation of written manuals that contain a detailed description of the procedures for selection of the study population and data collection, as well as training and certification of staff.")
14
Key features of the design of an epidemiologic study
8. activities during data collection, including analysis of quality control and remedial actions (QC). - ongoing monitoring of data collection procedures, as well as conducting studies on samples to assess validity and reliability of measurements, which may result in retraining and recertification of study staff.
. - ongoing monitoring of data collection procedures, as well as conducting studies on samples to assess validity and reliability of measurements, which may result in retraining and recertification of study staff.")
15
Key features of the design of an epidemiologic study
9. Data Analysis - establish analytic strategies in advance (e.g., the choice of "cutoff" points)
")
16
Key features of the design of an epidemiologic study
10. Reporting of data - findings should be reported as soon as possible after data collection activities are finished so as to preserve the timeliness of the study .To void publication bias , data should be reported regardless of the direction of findings.

17
Quality Assurance Study protocol :
provides a global picture of the strategies leads to the development of more detailed manuals of operation describes the general design and procedures and assists the staff in understanding the context in which their specific activities are carried out

18
Quality Assurance Manuals of operation:
detailed descriptions of exactly how the procedures specific to each data collection activity are to be carried out : Measurements Interviews Categorizations Derived variables maximizes the likelihood the tasks will be performed as uniformly as possible (esp., in multicenter studies)
")
19
Development or choice or modification the previously used one?
Quality Assurance Data collection instrument: Questionnaires: Development or choice or modification the previously used one? Validity and reliability are sometimes known Comparing findings of the study with those of previous studies

20
Quality Assurance Training of staff:
Familiarizing them with the procedures under his or her responsibility data collection processing procedures setting up appointments for interviews or visits preparing materials for the interviewers and other data collectors calibrating instruments assigning interviewers to study participants certification of the staff member to perform the specific procedure periodic retraining and recertification (QC)
")
21
Quality Assurance Pretesting and pilot studies:
feasibility and efficiency pretest: to try to assessing specific procedures on a grab or convenience sampling in order to detect major flaws. pilot study: is a formal rehearsal of study procedures that attempt to reproduce the entire flow of operations in a sample as similar as possible to study participants .

22
Pretesting and pilot studies
Assess participant recruitment Assess data collection procedures A questionnaire can assessed: flow of questions presence of sensitive questions appropriateness of categorization of variables clarity of wording to the respondent and the interviewer clarity of the "question- by question" instructions to the interviewer Evaluating alternative strategies for participant recruitment and data collection

23
Quality Assurance Quality assurance Steps: Specify study hypothesis.
Specify general design (study protocol) Choose or prepare instruments, develop procedures for data collection and processing (Develop manuals) Train staff, Certify staff. Using certified staff, pretest and pilot-study data collection and processing instruments and procedures; pilot-study alternative strategies for data collection
 Choose or prepare instruments, develop procedures for data collection and processing (Develop manuals) Train staff, Certify staff. Using certified staff, pretest and pilot-study data collection and processing instruments and procedures; pilot-study alternative strategies for data collection.")
24
Quality control Quality control strategies include observation of procedures performed by staff members, which allows the identification of obvious protocol deviations.

25
Observation Monitoring and Monitoring of Trends
"over-the-shoulder" observation statistical assessment of trends over time, after adjustment for age, sex, and other relevant characteristics, for each technician or observer digit preference (e.g. age, blood pressure) external or internal standards (e.g. lab data)
 external or internal standards (e.g. lab data)")
26
statistical assessment

27
digit preference

28
Validity studies A compromise between accuracy on the one hand and costs and participants' burden on the other is often necessary.

29
Validity studies Validity studies in subsamples of participants who undergo both the study-wide procedure and a more accurate procedure serving as a "gold standard" allow assessing the impact of these errors on the study estimates.

30
laboratory Measurements
External quality control program conducted in a masked fashion. using the same biological (e.g., serum) pool to compare measurements obtained from applying study procedures with those resulting from the application of the gold standard procedures. The biological pool can be external or internal to the study.
 pool to compare measurements obtained from applying study procedures with those resulting from the application of the gold standard procedures. The biological pool can be external or internal to the study.")
31
laboratory Measurements

32
Example: serum cholesterol
Screening measurements: blood obtained by the finger stick method in a nonfasting state Gold standard measurements: The standard measurements were done in fasting state under carefully controlled conditions and assayed in a nationally recognized standard laboratory

33
temporal drift: differential bias over time

34
Questionnaires Comparing with the gold standard:
information given by participants and physicians about treatment food frequency questionnaire and a 1-week diet diary It is important to assess samples of both "positive" and "negative" answers (estimation of both sensitivity and specificity) and collect Information separately for the groups being compared (cases and controls or exposed and unexposed) to evaluate misclassification (nondifferential or differential)
 and collect Information separately for the groups being compared (cases and controls or exposed and unexposed) to evaluate misclassification (nondifferential or differential)")
35
Availability of Validity Data from Previous Studies
National Health and Nutrition Examination Survey III (NHANES III): the actual blood pressure levels measured (gold standard) and reports of antihypertensive medication use (self-reported hypertension) Lipid Research Clinics (LRC) Family Study: self-reported anthropometric variables in participants, whose weights and heights were both self-reported and measured.
: the actual blood pressure levels measured (gold standard) and reports of antihypertensive medication use (self-reported hypertension) Lipid Research Clinics (LRC) Family Study: self-reported anthropometric variables in participants, whose weights and heights were both self-reported and measured.")
36
Importance of Validity Studies
the knowledge of the validity of exposure, outcome, main confounding variables, and effect modifiers is important in the causal inferential process. many variables, even those considered "objective," have a relatively poor validity. (sensitivity and specificity)
")
37
Limitations of Validity Studies
the "gold standard" itself may not be entirely valid. validity studies samples frequently constitute a selected group of volunteers (may not be representative). usually small sample size of validity studies resulting statistical imprecision. sensitivity and specificity of the procedure may vary according to certain characteristics of the study population. extrapolating the results of a validation study from one population to another, particularly if the data collection instrument is a questionnaire.
. usually small sample size of validity studies resulting statistical imprecision. sensitivity and specificity of the procedure may vary according to certain characteristics of the study population. extrapolating the results of a validation study from one population to another, particularly if the data collection instrument is a questionnaire.")
38
conclusion Then the "corrected" estimate may be even less "correct" than the original one.

39
Reliability Studies reliability studies assess the extent to which results agree when obtained by different observers, study instruments or procedures, or by the same observer, study instrument, or procedure at different points in time. Ideally, the only source of variability in a study should be that between study participants.

40
Other sources of variability
Variability due to imprecision of the observer or the method, which can be classified in two types: Within-observer (or intra-observer) or within-method variability, Between-observer (or interobserver) or between-method variability Variability within study participants
 or within-method variability, Between-observer (or interobserver) or between-method variability. Variability within study participants.")
41
Within individual variability
the within-individual variability masks the between-individual variability

42
Control the variability
quality assurance procedures prevent or minimize within- and between-observer or method variability physiologic within-individual variability is not amenable to prevention. Solution: standardizing the timing of data collection for measures with known temporal fluctuations (levels of cortisol or blood pressure) standardizing measurement conditions for variables affected by stress or activity (blood pressure) collect data at several points in time and use the average of all values.
 standardizing measurement conditions for variables affected by stress or activity (blood pressure) collect data at several points in time and use the average of all values.")
43
Reliability studies obtaining random repeat measurements Masked or not?

44
Reliability study

45
misclassification If the sample size is of sufficient size, it is important to assess whether reliability estimates obtained for a sample of study participants differ according to relevant characteristics, which may result in differential levels of misclassification.

46
Indices of Validity and Reliability

47
Sensitivity and Specificity

48
Sensitivity and Specificity
Sensitivity and specificity are fixed properties of the test (or diagnostic criteria or procedure) itself, regardless of the characteristics of the study population. Do you agree on this?
 itself, regardless of the characteristics of the study population. Do you agree on this")
49
Sensitivity and Specificity
1. dependence of sensitivity and specificity estimates on the cutoff level (arbitrariness in assessing and reporting the validity) 2. the sensitivity and specificity of a given definition of a condition (based on a cutoff in a continuous distribution) depend on the distribution of the severity of the condition.
 2. the sensitivity and specificity of a given definition of a condition (based on a cutoff in a continuous distribution) depend on the distribution of the severity of the condition.")
50
Sensitivity and Specificity

51
Sensitivity and Specificity
3. The validity of a test can vary from population to population when the test is not a direct marker of the condition (OB and prevalence of Peptic ulcer, PPD and prevalence of atypical mycobacterium)
")
52
Sensitivity and Specificity
4. sensitivity and specificity can vary according to the characteristics of individuals (limitation to the generalizability). if these variables represent the exposures of interest or are correlated with them, differential misclassification may arise.
. if these variables represent the exposures of interest or are correlated with them, differential misclassification may arise.")
53
Sensitivity and Specificity

54
Youden 's J Statistic J = Sensitivity + Specificity Maximum value of the index =1 When there is perfect agreement Minimum value of the index =0 When sensitivity and specificity = 0.5 Theoretically the value of J can be negative

55
% Agreement = (20 + 60) / 100 = 80 % Percent Agreement MD#1 Yes No
30 60 70 100 % Agreement = ( ) / 100 = 80 %
 / 100 = 80 %")
56
Percent Agreement Although the percent agreement is a reliability indice, it can be also used to assess validity (the agreement between the test and gold standard) the simplest method of summarizing agreement for categorical variables it can be calculated for any number of categories, not just two
 the simplest method of summarizing agreement for categorical variables. it can be calculated for any number of categories, not just two.")
57
Percent Agreement

58
Percent agreement= 95% Percent Agreement MD#1 Yes No MD#2 1 3 2 94
43 3 2 52 Percent agreement= 95%

59
limitation of the percent agreement
its values tend to be high whenever the proportion of negative-negative results is high (resulting from a low prevalence of positivity in the study population), particularly when the specificity is high.
, particularly when the specificity is high.")
60
Percent Positive Agreement
Chamberlain’s percent positive agreement: the number of occurrences for which both observers report a positive result, out of the average number of positives by either observer. the number of occurrences for which both observers report positive results out of the total number of observations for which at least one observer does SO

61
Calculate PA, PPA, CPPA

62
Kappa statistic kappa statistic is defined as the fraction of the observed agreement not due to chance in relation to the maximum nonchance agreement.

63
Example MD#1 Yes No Total MD#2 43 3 46 2 52 54 45 55 100

64
Calculate the expected values (chance)
ACTUAL MD #1 Yes No MD#2 46 54 45 55 100

65
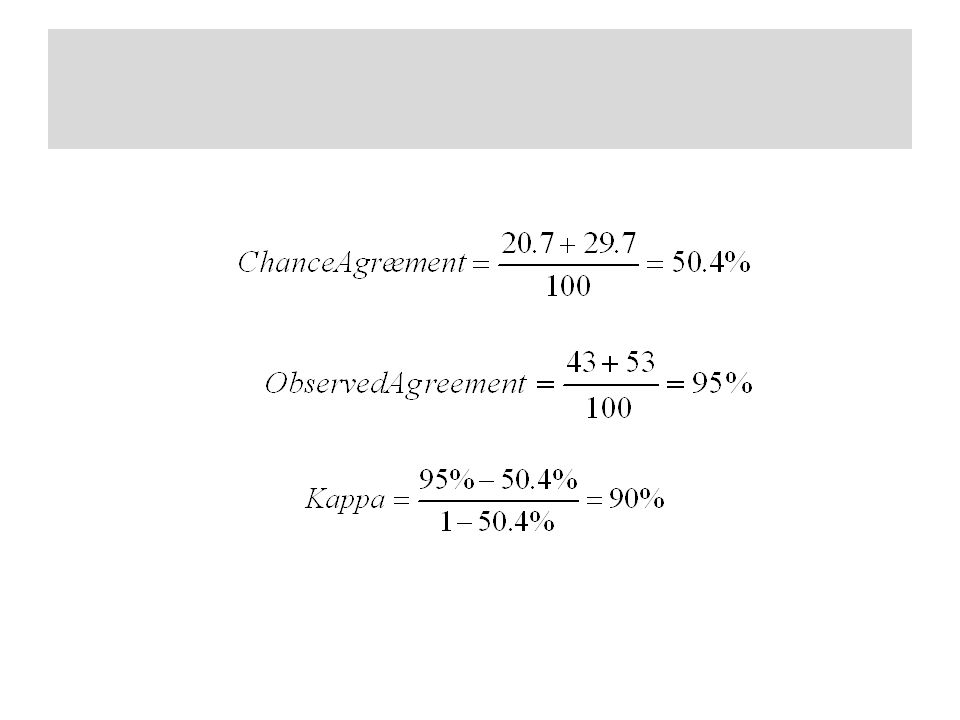
Calculate the chance agreement and Kappa
ACTUAL MD #1 Yes No MD#2 20.7 25.3 46 24.3 29.7 54 45 55 100

67
KAPPA + 1 means that the two observers are perfectly reliable. They classify everyone exactly the same way. 0 means there is no relationship at all between the two observer’s classifications, above the agreement that would be expected by chance. - 1 means the two observers classify exactly the opposite of each other. If one observer says yes, the other always says no.

68
Interpretation of Kappa

69
Weighted Kappa

70
weaknesses of Weighted Kappa
The weights assigned to cells, although somewhat arbitrary, on the basis of the investigators' perception of how serious the disagreement is.

71
Dependence of Kappa on Prevalence

72
Dependence of Kappa on Prevalence
for the same sensitivity and specificity of the observers, the kappa value is greater in the population in which the prevalence of positivity is higher. kappa tends toward 0 as the prevalence approaches either 0 or 1.

73
conclusion comparisons of kappa values among populations may be unwarranted. kappa should be used and interpreted with caution. Use it in conjunction with other measures of agreement, such as the percent agreement . take into consideration its variability as a function of the prevalence of the condition and of the degree of similarity between observers with regard to the prevalence of positivity.

74
Indices of Validity/Reliability for Continuous Data: Correlation Graph (Scatter Diagram)
the 45° lines, intercept = 0, regression coefficient = 1.0 unit It is not as sensitive as alternative graphic techniques

75
Correlation Coefficient
Pearson's r is probably one of the most frequently used measures of agreement for continuous variables . it is also one of the least appropriate! 1. It is insensitive to systematic differences (bias) between two observers or readings and it is misleading assessment of agreement.
 between two observers or readings and it is misleading assessment of agreement.")
76
Correlation Coefficient
2. the value of r is very sensitive to the range of values. (broader distribution) 3. Pearson's correlation coefficient is unduly sensitive to extreme values (outliers)
 3. Pearson s correlation coefficient is unduly sensitive to extreme values (outliers)")
77
Vb = variance between individuals Vt = total variance
lntraclass Correlation Coefficient (ICC) or reliability coefficient (R) Vb = variance between individuals Vt = total variance Ve = unwanted variance (error)
 or reliability coefficient (R) Vb = variance between individuals. Vt = total variance. Ve = unwanted variance (error)")
78
lntraclass Correlation Coefficient (ICC)
The ICC is equivalent to the kappa statistic for continuous variables. The range of ICC is from -1.0 (more realistically from 0) to + 1.0 ICC is affected by the range of values in the study population (like Pearson's correlation coefficient)when Vb is small, ICC also will be small. This is particularly important in studies within populations in which the exposure values are either very high or very low.
 to ICC is affected by the range of values in the study population (like Pearson s correlation coefficient)when Vb is small, ICC also will be small. This is particularly important in studies within populations in which the exposure values are either very high or very low.")
79
Calculation of ICC from ANOVA table
K is the number or repeat readings n is the number of individual studies or specimens being studied

80
Coefficient of Variability
This calculation would have to be repeated for all pairs of measurements, and the overall coefficient of variability would be the average of all pair-wise coefficients of variability.

81
Bland-Altman Plot

82
it is much easier to assess:
Bland-Altman Plot the difference between the paired measurements (A - B in the ordinate) and their mean value [(A + B)/2, in the abscissa). it is much easier to assess: The magnitude of disagreement (including systematic differences) Outliers Any trend
 and their mean value [(A + B)/2, in the abscissa). it is much easier to assess: The magnitude of disagreement (including systematic differences) Outliers. Any trend.")
Similar presentations


 MPH(BPKIHS)>")


