Download presentation
Presentation is loading. Please wait.

1
Standard Work Workshop

2
Agenda Time Topic/Activity Day 1 8:00 AM Opening 8:05 AM Introduction
8:15 AM Module 1 Continuous Improvement Approach (15) 8:35 AM Module 2 Standardization (19) 9:00 AM Break 9:15 AM Exercise 1 – Break-out Observe Video & Do Line Layout 10:15 AM Report-outs 10:35 AM Module 3 Standard Work (36) 11:15 AM Exercise 2 – Video Data Collection (Takt Time, Target Cycle Time, Machine Times/Capacity, Manual time, Walk Time, Wait Time, & Actual Cycle Time 12:00 PM Lunch 12:45 PM Break-out Continues 1:45 PM Report-outs 2:15 PM Module 4 Standard Work Tools (39) 3:00 PM Exercise 3 – Break-out (SWCT, Staffing Bar Graph & Staffing Chart 4:30 PM Report-outs 5:00 PM Adjourn
 8:35 AM Module 2 Standardization (19) 9:00 AM Break. 9:15 AM Exercise 1 – Break-out Observe. Video & Do Line Layout. 10:15 AM Report-outs. 10:35 AM Module 3 Standard Work (36) 11:15 AM Exercise 2 – Video Data Collection (Takt Time, Target Cycle Time, Machine Times/Capacity, Manual time, Walk Time, Wait Time, & Actual. Cycle Time. 12:00 PM Lunch. 12:45 PM Break-out Continues. 1:45 PM Report-outs. 2:15 PM Module 4 Standard Work Tools (39) 3:00 PM Exercise 3 – Break-out (SWCT, Staffing Bar. Graph & Staffing Chart. 4:30 PM Report-outs. 5:00 PM Adjourn.")
3
Agenda Time Topic/Activity Day 2 8:00 AM Introduction Day 2
8:15 AM Module 5 Product Mix (14) 8:30 AM Exercise 4 Break-out (Visit Line, Observe, Takt Time, Target Cycle Time, Manual/Machine Time, Walk/Wait Time & SWCT 12:00 PM Lunch 12:45 PM Module 6 Improvement Activity Form (5) 1:00 PM Exercise 5 – Break-out 1:45 PM Break 2:00 PM Module 7 Implementation (10) 2:15 PM Exercise 6 – Break-out 3:00 PM Report-outs 4:00 PM Adjourn Exercise 4: Suggested time sequence Visit Line: 45 minutes Watch Video: 45 minutes Capture Information: 90 minutes Prepare final report out material: 30 minutes
 8:30 AM Exercise 4 Break-out (Visit Line, Observe, Takt Time, Target Cycle Time, Manual/Machine. Time, Walk/Wait Time & SWCT. 12:00 PM Lunch. 12:45 PM Module 6 Improvement Activity Form (5) 1:00 PM Exercise 5 – Break-out. 1:45 PM Break. 2:00 PM Module 7 Implementation (10) 2:15 PM Exercise 6 – Break-out. 3:00 PM Report-outs. 4:00 PM Adjourn. Exercise 4: Suggested time sequence. Visit Line: 45 minutes. Watch Video: 45 minutes. Capture Information: 90 minutes. Prepare final report out material: 30 minutes.")
4
Standard Work Workshop
Name Years Service Current Position

5
Points To Be Revisited Definition:
Question Or Subject That Will Be Addressed At A Later Time Point Is Scheduled To Be Covered Later In The Workshop Additional Time Is Needed To Clarify Point Additional Research Is Needed (We Don't Know) Point Is Beyond Scope Of Workshop (Subsequent Investigation Is Needed) Ensure That Unresolved Issues & Questions Are Addressed Instructor Determines When A Point Needs To Be Revisited Participant Writes Point On Wall Chart Criteria: Purpose: Method:
 Point Is Beyond Scope Of Workshop (Subsequent Investigation Is Needed) Ensure That Unresolved Issues & Questions Are Addressed. Instructor Determines When A Point Needs To Be Revisited. Participant Writes Point On Wall Chart. Criteria: Purpose: Method:")
6
Obstacles Definition:
An Obstacle Is Anything That Impedes Or Prevents The Implementation Of Continuous Improvement Tools Purpose: Ensure That Obstacles Are Raised And Addressed (On Last Day) Method: Participant Writes Obstacles On Wall Chart At Any Time
 Method: Participant Writes Obstacles On Wall Chart At Any Time.")
7
Continuous Improvement Approach
Module 1 Continuous Improvement Approach

8
Definition of Continuous Improvement
Continuous Improvement simply means: Improving every aspect of every activity every day - forever Think of continuous improvement as a journey rather than a destination

9
Introduction to Continuous Improvement
Implementation of the AM Performance System has helped AM become much more competitive However, the vehicle OE and replacement marketplaces have become more difficult every year To continue to keep and grow business, we have no choice but to improve While we have done a good job with ArvinMeritor Performance System, it is not sufficient to keep doing what we have been doing. We have to keep on the razor’s edge, moving forward. We have to learn to improve our cost. That does not mean everybody working harder. As you will see, we are going to get more waste out of our system and help improve our profitability. This will help us to be stronger and more competitive as a company. Standard Work is based on elimination of waste, it’s not anything more difficult than that. We have to improve to generate money for tooling and new equipment. In order to keep and grow the business, we have no choice but to improve.

10
Introduction to Continuous Improvement
This is not a new program - Continuous Improvement is an integral part of AM Performance System Continuous Improvement is a part of “people supportive practices”, one of the 14 AMr Performance System points provides new skills to employees, empowering them to design and improve their own work by standardizing on a new method, it gives people the ability to reduce variation This is not a new program. It is absolutely not a shift from what we have been doing. It is a logical extension. In fact, three years ago the company was not ready to do what you are going to see in this workshop. The company now is ready. You know what? There are not very many companies in the world that are ready to do this. That puts ArvinMeritor in a totally different class of companies. You couldn’t just walk into any company and teach this class. I truly believe that we are ready for these tools and we can make them work. People supportive practices are certainly part of this workshop. What we are essentially going to do is give you the skills and empower you to design and set up your own workplace in a very professional, world class, and cost effective manner. That’s really the skills we are going to give you, so you can set up the work unit so that they are highly competitive. The other thing we are going to do is standardize on the methods, which gives you a way to reduce variability. When you hear the word standardization, don’t be afraid. It’s not like having an industrial engineer out on the floor with a stop watch, although you may see some of that, but it will be you with the stop watch. What we are talking about here, if you could just picture, the night shift is doing it one way and the day shift is doing it another, and each one swearing, their way is the best way. The output is not going to be the same. I’m sure we all know of examples of this, particularly with machine settings. Day shift has their settings and night shift theirs.

11
Introduction to Continuous Improvement
Standardization is really just a systematic and disciplined approach to doing things We will be using the same skills for supplier development Standardization is really just a systematic and disciplined approach to doing things. You find yourself on the line getting into the groove of doing your work, and you are really developing a systematic way . You are producing good quality, because you are doing it the same way every time, assuming you are being supplied good parts each time. What we are talking about is doing things in a systematic way. The best way has not yet been found. Yes, you can make improvements, but that is not the end of it; beyond that level there is always room for another improvement. Perfection essentially is never obtainable, but we are going to get it better each time. As long as we get it better, we are going to stay ahead of our competition. We will be using the same skills from this class with our suppliers. There will be openings for suppliers in each of our classes, just as there was in ArvinMeritor Performance System. In addition, we intend to use some of our best people from the work unit that have really learned this stuff and applied it. We will give them another level of training so that they can work on teams that will go to the supplier and help them apply these concepts. Our suppliers must become better, and are key to us reducing costs to our customers. We are going to send continuous improvement teams out to the suppliers to identify waste in their systems and reduce costs at that level. How many people like the measure that we are currently using- “labor to sales”? We have heard a lot of complaints that at the cell level, “we have no control over sales.” “The cell next door has a higher margin, so they are certainly going to look better than us. It is out of our control.” If you really want to look good on labor to sales, you farm out the work. The measure will look good, but that is not what we want to do. We do not want to fall into that trap. So, at the work cell level we will be showing you a better measure that we think is fair.

12
Introduction to Continuous Improvement
Why Standardize? “Variability is the breeding ground of defects, and of high costs.” We must standardize to eliminate variability. Variability causes not only defects and high cost, but also accidents and unbalanced work loads. Before we can improve the process we must have a standard method.

13
Introduction to Continuous Improvement
Shared Plan AM invests in training AM Empowers Employees Design their own work Rearrange their work place Employees follow THEIR plan Do work according to plan Same way every time We’re “offering a deal.” You get to “make the recipe,” but you must follow the recipe. Standardize the work. Unless we standardize, there will be no improvement, nor will we be competitive.

14
Introduction to Continuous Improvement
Manufacturing performance is like physical conditioning - you can go only one of two directions you can relax and get out of shape you can improve continuously and stay truly competitive Continuous Improvement develops standardized ways of doing things: you cannot do it right the first time without a standard every standard and every measure cries out for a better way and better performance - getting in better shape Manufacturing performance is like physical conditioning. I know a lot of you may be on programs such as jogging or working out. You can only go in two directions. You can relax and watch all the football games and basketball on TV, or you can improve continuously and stay competitive. It is virtually impossible to stay the same if you are truly challenging your body. We should be doing the same with our manufacturing. We must develop standardized ways of doing things. First of all, if you can’t measure it and you don’t have a standardized way of doing things, how do you know if you are getting better or if you made improvements. Without a standard for reference, you don’t know if there was an improvement.

15
Continuous Improvement is needed:
Increased competition Customer demands for lower prices Expectations for higher quality Changing technologies Need for more employee control of workplace Need for improved participation and self-direction Wider base of knowledge Safer, better workplace Zero accidents Continuous improvement is needed as we have talked about because of increased competition and customer demand for lower prices. Expectations for higher quality are certainly real. We received some negative feedback from one of our major OE customers. They expect better performance in PPM period !!! We must deliver. We hope that this workshop and the tools you learn will help you and us in doing this. Changes in technology, such as benders changing from servo controls to electronic, are the things we need to be pushing. Also in the area of product design, stamped mufflers, tourniquet wrap converters etc. You have been trained in employee involvement and we want you to have more control of the workplace or your specific cell. Every cell should be considered its own business and self directed, running its own show and improving continuously. Read others and provide comments.

16
Work Unit 20 Keys 1 2 3 4 5 Level Key #10 - Work Standards
A few standardized work procedures are in place in the work unit. 2 Team members are familiar with formal work instruction sheets. A few activities have been analyzed by team members. At least 50% of team members have been trained in Standard Work. 3 Standard work patterns have been developed by team members. All team members are following standard work patterns. Takt Time and Target Cycle Time have been established for the work unit. Labor utilization graphs or other visual tools are displayed to show balance and work distribution of team members. At least 75% of team members have been trained in Standard Work. 4 All activities in the work unit have been analyzed with Standard Work Charts (SWC). Standards have been established and used for all team member training. Efforts to reduce unnecessary motion and waiting in the work unit are documented. Balanced work plans have been established for all part numbers and/or families within the work unit. Work patterns for +/- 1 team member have been developed. 100% of team members have been trained in Standard Work. 5 Standard work patterns are established for new processes and products prior to release for production to the work unit. All unnecessary motion and waiting in the work unit have been eliminated. Team members are involved in making adjustments to labor utilization levels, based on customer requirements. Continuous improvement is needed as we have talked about because of increased competition and customer demand for lower prices. Expectations for higher quality are certainly real. We received some negative feedback from one of our major OE customers. They expect better performance in PPM period !!! We must deliver. We hope that this workshop and the tools you learn will help you and us in doing this. Changes in technology, such as benders changing from servo controls to electronic, are the things we need to be pushing. Also in the area of product design, stamped mufflers, tourniquet wrap converters etc. You have been trained in employee involvement and we want you to have more control of the workplace or your specific cell. Every cell should be considered its own business and self directed, running its own show and improving continuously. Read others and provide comments.
. Standards have been established and used for all team member training. Efforts to reduce unnecessary motion and waiting in the work unit are documented. Balanced work plans have been established for all part numbers and/or families within the work unit. Work patterns for +/- 1 team member have been developed. 100% of team members have been trained in Standard Work. 5. Standard work patterns are established for new processes and products prior to release for production to the work unit. All unnecessary motion and waiting in the work unit have been eliminated. Team members are involved in making adjustments to labor utilization levels, based on customer requirements. Continuous improvement is needed as we have talked about because of increased competition and customer demand for lower prices. Expectations for higher quality are certainly real. We received some negative feedback from one of our major OE customers. They expect better performance in PPM period !!! We must deliver. We hope that this workshop and the tools you learn will help you and us in doing this. Changes in technology, such as benders changing from servo controls to electronic, are the things we need to be pushing. Also in the area of product design, stamped mufflers, tourniquet wrap converters etc. You have been trained in employee involvement and we want you to have more control of the workplace or your specific cell. Every cell should be considered its own business and self directed, running its own show and improving continuously. Read others and provide comments.")
17
Workshop Goals Work as a team Have fun!!
Understand Continuous Improvement Steps Standardized work Takt time Work as a team Have fun!! We’re going to address these areas specifically in this workshop.

18
9 Continuous Improvement Process Steps
1. Observe current method 2. Document current method 3. Identify improvements (steps to eliminate) 4. Implement improvements 5. Validate quality and productivity of new method 6. Standardize new method 7. Document “Before” and “After” conditions 8. Recognize achievements 9. Look for next improvement
 4. Implement improvements. 5. Validate quality and productivity of new method. 6. Standardize new method. 7. Document Before and After conditions. 8. Recognize achievements. 9. Look for next improvement.")
19
Continuous Improvement is an integral part of AM Performance System
Achieving World Class certification is of no benefit if the performance cannot be maintained There are only two choices deteriorating performance or CONTINUOUS IMPROVEMENT !!!!!!!!!!!!

20
Continuous Improvement is an integral part of AM Performance System
To achieve World Class levels, we must excel at continuously improving processes and work methods in every work unit, in every business group, at every facility, and at every supplier. Every day In order to become World Class, certain skills will be required.

21
Standard Work & Takt Time Production Tools.
Our focus will be on the following tools: Ergonomics Standard Work Balance Boards Measurements Standard Work & Takt Time Production Tools We will focus on these four tools. The other tools are supported by other training courses. One of the most important skills involves standardized work. (next speakers name) will now discuss standardized concepts with you.
 will now discuss standardized concepts with you.")
22
Module 2 Standardization
Standardization, or standardized operations is an area that was covered only briefly during ArvinMeritor Performance System. Those of you that have been through Cycle Time Reduction have had more exposure. I will introduce you to the concept in this module, but later you will receive in-depth instructions on the application of standardization. The ultimate purpose of ArvinMeritor Performance System is to reduce cost relating to production. To do so, ArvinMeritor has worked to eliminate production inefficiencies such as unnecessary inventories and other types of waste. The first step in reducing these inefficiencies is identifying and developing a discipline of standardization. Standard operations apply to: 1. Working efficiently without wasteful motions. 2. Achieving line balancing among all processes in terms of production timing. 3. The minimum quantity of work-in-process.

23
Standard operations apply to:
Working efficiently without wasteful motions Achieving line balancing among all processes in terms of production timing The minimum quantity of work-in-process Standardization - the best way Standardization - eliminating variation Standardization - the same sequence and method each time When we think of standardization, do these ideas come to mind? The best way - the best practice Eliminating variation by following a developed standard A standardized way of performing a task or cycle

24
Standard operations apply to:
Standardization makes it easy to see and check operational problems Standardization ensures that the results will be predictable and repeatable If there is an operational problem, it will be there each and every time the operation is performed. It will stand out and can be done easily identified.

25
Standardization Results in the following improvements:
Safety Quality Efficiency Productivity Standard Work Safety Quality Efficiency Productivity Standardization has an effect on each of these. If we deviate from the standard, safety could be jeopardized, quality could be affected because we did not follow the standard, which in turn, effects efficiency and productivity.

26
Standardization is a key to improving
The standard method must be established and should be regarded as a “good” method But the standard method is only “good” - not “best”. Each method challenges us for a better way Continuously improved “The best way has not yet been found” Read slide.

27
The 8 Types of Waste Overproduction Correction
Material Movement/Transportation Excess Processing Inventory Waiting Motion Lack of Employee Involvement Ask the group to give examples of the 8 types of waste. Overproduction - Example would be producing 500 when the customer needs 450, or running components at a much faster rate than the assembly, if the component line supports only that assembly line. Correction - premium freight, rework, scrap Material Movement / Transportation - extra fork trucks, drivers have unbalanced work schedule, multiple storage areas. Excess Processing - excessive approvals, redundant processes, reports with too much information, reports that you don’t use. Inventory - stagnated material flow, fish instead of fifo, massive rework campaigns when problems surface, long lead times, slow response to changes in customer demands. Waiting - man waiting for machine, man waiting on man, machine waiting for man, unbalanced operations (work), unplanned downtime. Motion - excessive walk time, tools not in easy reach or not stored at equipment, unpacking and rearranging of parts by the operator, container too large for worksite. Lack of Employee Involvement, no suggestion scheme, not listening to the ideas of the employees.
, unplanned downtime. Motion - excessive walk time, tools not in easy reach or not stored at equipment, unpacking and rearranging of parts by the operator, container too large for worksite. Lack of Employee Involvement, no suggestion scheme, not listening to the ideas of the employees.")
28
Some Causes of Waste Incapable processes
Engineering changes without process changes Lack of Customer input concerning requirements Inconsistent work methods Excessive variation Incapable suppliers Lack of communication Long changeovers Inconsistent schedules A key to standardized work and to eliminating waste is the importance of workplace improvements.

29
Standard Movements Safety & Quality
Standardization of work movement that supports our goals of: Safety Quality Efficiency Productivity Safety & Quality We have said that standardization results in improvements in these four areas. Now we would like to focus on a supporting strategy that addresses these same goals in relation to our people rather than our processes. The primary purpose of following Standard Work Movements is to support and protect the employee.

30
Safety and Ergonomics Make safety and ergonomics a number one concern when making improvements in the workplace Definition of Ergonomics: Designing work to minimize physical stress and discomfort. Points to check when doing Continuous Improvement The safety of our workers is always our number one concern. It is important that we all keep safety and ergonomics in the forefront. Once we have assured ourselves that work movements are both safe and ergonomically correct, we should focus on improving these areas: Quality of movements Efficiency of movements Productivity of movements

31
3 Work Movement Goals 1. Reduce the number of basic movements
2. Make work movements easier 3. Improve the quality of movement One of the easiest ways to evaluate work movements is by making a video tape of work in the cell. A video can be a valuable tool for a work team meeting where all cell members can review and discuss work movements. 1. To reduce the number of basic movements, start by looking for non value added movement. Try to eliminate walks and the number of times the part is handled or carried. Think about how fixtures might be used to eliminate part movement or part handling. 2. To make work movements easier, minimize the size of movements required. Keep movements level; use the force of gravity, when possible. Remember the optimum work height is waist level. 3. To improve the quality of work movements, eliminate difficult angles, reduce excessive reaching, stretching, and bending. Try to reduce the size and degree of difficulty of movements.

32
Standard Movements Look at feet and leg movements
Look at hand and arm movements Look at the part Look at the worker’s eyes Improve the quality of movement Use both hands Eliminate wasted movements Make the work rhythmical Whether watching a video tape or observing work as it is performed, checking these points may lead to additional improvements. Repetitive motion strain occurs most frequently in the wrists, shoulders, elbows, and hands. It is important to evaluate how much movement is required to get the job done. Are there better ideas we can use that could eliminate painful and costly repetitive motion injuries? As you visit the floor and observe the work being done, think about how we can make jobs easier. Remember, safety is our number one concern. Safety should never be compromised as we look for improvements.

33
Work Movements Checklist
Job: Line: Process: Worker: Date:_ ____________ Check Item How often Problem Movement Improvement Are the arms stretched out too far? Size Are the arms moving above the heart level? of Is there any bending at the waist? Movement Are there any sudden rotations? Is there any stretching (on tiptoe) or bending down? Movement Is the right or left hand not being used? of Are both arms stretched farther than twice the distance Both between shoulders? hands Are hands moving alternately rather than simultaneously? (waiting) Are things transferred from one hand to the other? Do the hands cross? Are up, down, forward, backward, left, right motions too Wasted large for movement to the next position? Movement Start buttons in line with the flow of hand movements? Are parts stored in line with the flow of hand to hand movements? Are both hands not used while the worker is walking? Making Does the worker stop and stand? the Work This Work Movements Checklist is a useful tool to help you evaluate improvements. As you visit the floor during this workshop, use this sheet as a reference tool to identify possible problem areas. In the back pocket of your CIT Workbook you will find 3 pages of Work Movement Principles. Improving work movements not only will make work easier and safer, but will also help us reach the productivity, quality, and efficiency goals we want to achieve. Standardization in the workplace is people supportive. In order to have a standardized workplace, we need workplace organization. Our next speaker will now expand on this subject. Is the part automatically unloaded or done by worker? Rhythmical Can the part be loaded with one touch? (simplified loading) Is there continued holding of part at the finish? Finishing Can the worker load and unload the part in one try? Point Can the worker move to the next process right away? Can the worker pick up the part for the next process right away? Preparations for the next task completed while working? O T H E R Average Cycle Time Before: _______ seconds. No. times cycle measured: Average Cycle Time After: ________ seconds Form No. 5-A
 or bending down Movement. Is the right or left hand not being used of. Are both arms stretched farther than twice the distance. Both. between shoulders hands. Are hands moving alternately rather than simultaneously (waiting) Are things transferred from one hand to the other Do the hands cross Are up, down, forward, backward, left, right motions too. Wasted. large for movement to the next position Movement. Start buttons in line with the flow of hand movements Are parts stored in line with the flow of hand to hand movements Are both hands not used while the worker is walking Making. Does the worker stop and stand the Work. This Work Movements Checklist is a useful tool to help you evaluate improvements. As you visit the floor during this workshop, use this sheet as a reference tool to identify possible problem areas. In the back pocket of your CIT Workbook you will find 3 pages of Work Movement Principles. Improving work movements not only will make work easier and safer, but will also help us reach the productivity, quality, and efficiency goals we want to achieve. Standardization in the workplace is people supportive. In order to have a standardized workplace, we need workplace organization. Our next speaker will now expand on this subject. Is the part automatically unloaded or done by worker Rhythmical. Can the part be loaded with one touch (simplified loading) Is there continued holding of part at the finish Finishing. Can the worker load and unload the part in one try Point. Can the worker move to the next process right away Can the worker pick up the part for the next process right away Preparations for the next task completed while working O T H E R. Average Cycle Time Before: _______ seconds. No. times cycle measured: Average Cycle Time After: ________ seconds. Form No. 5-A.")
34
AM Performance System Workplace Improvements
Safety and Ergonomics Small containers Minimal material handling Job rotation to minimize repetitive motions “Poka Yoke” pinch points (error proofing) Minimize bending/reaching Eliminate contamination (leaks, smoke, flash) Clean workplaces Containers that do not require lift trucks. Forty pounds or less. Job rotation increases our job skills but is also safer. Constant repetitive motions increase the chances of repetitive stress injuries. Error Proof - so we can’t make a bad part, but also think of it in a safety aspect; so we can’t put ourselves in danger. Eliminate or contain contamination. ATPM - try something simple first to see if it will work.
 Minimize bending/reaching. Eliminate contamination (leaks, smoke, flash) Clean workplaces. Containers that do not require lift trucks. Forty pounds or less. Job rotation increases our job skills but is also safer. Constant repetitive motions increase the chances of repetitive stress injuries. Error Proof - so we can’t make a bad part, but also think of it in a safety aspect; so we can’t put ourselves in danger. Eliminate or contain contamination. ATPM - try something simple first to see if it will work.")
35
Improvements Cont. “U” shaped work unit Eliminates isolated islands
Integrates processes Reduces transport and handling of parts Enhances teamwork Increases visibility Enhances cross training Permits flex-manning Improves safety Reduces inventory What is an isolated island? One person that may be in a cell that cannot see or have any communication with the cell they are providing parts to. If the main cell goes down they continue to run parts or inventory.

36
Work Sequence Sequence of activities that each operator performs to complete one cycle Does not necessarily represent the part routing Requires multi-skilled workers 6 5 3 2 Raw Materials Operator #1 7 Operator #2 8 9 4 1 Raw Materials Finished Goods Finished Goods

37
Improvements Cont. Minimize/Eliminate In-line Inventory One piece pull
Kanban signals Value Added/Non-Value Added Analysis Eliminate non-value added activities Moving material Inspection Waiting Unnecessary activities A key to operating with less inventory is having quick and consistent set-ups, or changeover times. Certainly VA/NVA analysis should be provided on set-up times. Lets examine some specific approaches to reducing set-up times.

38
Report Out 1 Deliverables
1- Complete the Standard Work Chart # 1 We are now ready for our first Break Out Session. Each team will have a video tape to view for this exercise. Your facilitators will give you further instructions on how to complete the Standard Work Chart using information you obtain from the video. Instructions on the Standardized Work Chart are found in your work book. Each team will return to this room to present the Standard Work Chart for their Report Out. (State time teams should return to main training room.) Watch the video tape to complete this exercise
 Watch the video tape to complete this exercise.")
39
WALK PATH WITH PART WITHOUT PART STANDARDIZED WORK CHART Part No.
Part Name Line # of Members Takt Time Target Cycle Time Standard In-Process Stock Date Member Manual Time Walk Wait Total Cycle Auto Time Manual Time Daily Customer Demand Shifts Bottleneck Scheduled Breaks/Day Allowances/day for WALK PATH WITH PART WITHOUT PART

40
Standard Work Example F G H I 3 # 1 # 2 2 E B C A D S.I.P.S.
STANDARDIZED WORK CHART Part No. Part Name Line # of Members Takt Time Target Cycle Time Standard In-Process Stock Date Member Manual Time Walk Wait Total Cycle Auto Time Manual Time Daily Customer Demand Shifts Bottleneck Scheduled Breaks/Day Allowances/day for # 1 I E C # 2 3 2 S.I.P.S. Standard Work Example A H G B D F

41
Module 3 Standardized Work

42
Standardized Work Clearly visible production and people supported activities that are standardized to reduce process variation and match customer needs Synchronized flow Simplified practices Consistent methods Applying better ideas Leveled work loads What is standardized work? Standardized work is an important tool for manufacturing high-quality products with fewer work processes. It concentrates on human movements, setting up the best work sequence for each production and assembly process. Once the most efficient sequence has been determined, it is always repeated in exactly the same way, so that workers can always avoid unnecessary motion and wasted effort. And besides maintaining quality and efficiency, standardized work guarantees safety, and prevents equipment damage.

43
Standardized Work Clearly visible production and people supported activities that are Standardized to reduce process variation and match Customer needs Traditional: Standardized: High Variability Consistency, Control First Shift First Shift Second Shift Second Shift There is always a standardized work sequence for each worksite, but it is not something which is fixed from the beginning and then followed blindly. Standardized work is a living, flexible tool that can be changed and improved along the way. Standardizing the work process is thus the first step toward improvement. Third Shift Third Shift

44
Who Knows More About What You Do ??
Standardized Work Who Knows More About What You Do ?? We have talked about the identification of waste, now we’ll spend a little time to discuss the elimination of waste. It won’t just go away - we must have a simple, effective plan. First, it must be a cross functional activity, involve everyone affected, assign responsibility to measure and evaluate. Perform “root cause analysis” to be sure that we are working on the right things. Plan to a time line - stay on schedule - check results. Standardize and document improvements. Require performance to a new level.

45
Standardized Work YOU DO !!

46
Whose Idea Will You Try First ??
Standardized Work Whose Idea Will You Try First ?? The idea of this slide is to show that it should be the teams idea. They should not depend on someone else to come up with idea’s or goals for them. They should strive to be self-directed.

47
Leveled Production In the production work site generally, the bigger the fluctuations either in part flow or production quantity the greater the waste In order to standardize, we need leveled production and continuous flow. A fluctuating production quantity or irregular manufacturing pace in any process will cause the production process as a whole to change in a disorderly fashion, resulting in confusion, work errors, line stoppages, quality defects and lowered efficiency. In this way, it has a serious effect on the preceding and following processes. To cope with production fluctuations, the company must always have in readiness the equipment, employees and other auxiliary production items to meet the maximum possible workload. The more the work load falls below the maximum, the greater the delay among employees and equipment. And this has a serious effect on efficiency and cost. Also, if the pull quantity of the following process fluctuates, the preceding process must reserve enough stock to meet the maximum possible part withdrawal to avoid part shortages. This situation worsens the farther back one goes along the preceding processes.

48
Continuous Flow Processing
The ideal, ultimately, is to achieve leveled, sequential production without accumulation of parts within a process or between processes Exhaust manufacturing comprises many processes, from raw material processes of stamping and making tubing, to the processes of welding, to the final process of final assembly. The degree of leveling that can be achieved by integrating all these processes so they flow together equals the degree of improvement in overall plant efficiency. Eliminating the congestion of parts within a process or between processes and achieving sequential flow production is called “continuous flow processing.”

49
Standardized Work Optimum conditions for standardized work: Up-Time
Repetitive operations Uniform work quality Level Schedule Capable Processes Does our customer always give us level schedules? If not, we should level at finished goods inventory. Example, customer wants 20,000 parts over the next 4 weeks (or 1,000 per day). However, his requirements may be 2,000 some days, 500 some days, etc. We need to use Kanban to level our schedule from finished goods inventory to 1,000 per day.
. However, his requirements may be 2,000 some days, 500 some days, etc. We need to use Kanban to level our schedule from finished goods inventory to 1,000 per day.")
50
Standardized Work Takt time Target cycle time Actual cycle time
Terms to know: Takt time Target cycle time Actual cycle time Manual time Walk time Wait time Unassigned time Machine cycle time We will define and discuss each of these.

51
Standardized Work Takt Time: The amount of time required to produce one piece of the customer demand

52
Standardized Work Takt Time Calculation:
Available Daily Operating Time (Seconds) Total Average Daily Production Requirements (Pieces) Available time includes all time available, except for breaks. Use a four week customer planning requirement when figuring production requirements. Example follows on next slide.
 Total Average Daily Production Requirements (Pieces) Available time includes all time available, except for breaks. Use a four week customer planning requirement when figuring production requirements. Example follows on next slide.")
53
Standardized Work Takt Time Calculation Example:
Work Unit (Two shift operation) Customer demand = 1504 / per day Available work time = 16 hours = 960 min/day Less 4 breaks per 10 min. each = 40 min Total Available Time = 920 min 920 minutes X 60 seconds = 55,200 seconds Takt Time = 55,200sec / 1504 units = 36.7 seconds We need to net 1 unit every 36.7 seconds In this example our customer is requesting 1504 parts per day. We have a total of 6 people manning this cell(3 per shift). On Takt Time calculation we only subtract breaks and possibly lunch. In this example we have 920 minutes of available time. We multiply 920 times 60 and get 55,200 seconds of available time. We then divide the 55,200 seconds by 1504 units that the customer requires and we get a Takt time of 36.7 seconds. We need to net 1 unit every 36.7 seconds.
 Customer demand = 1504 / per day. Available work time = 16 hours = 960 min/day. Less 4 breaks per 10 min. each = 40 min. Total Available Time = 920 min. 920 minutes X 60 seconds = 55,200 seconds. Takt Time = 55,200sec / 1504 units = 36.7 seconds. We need to net 1 unit every 36.7 seconds. In this example our customer is requesting 1504 parts per day. We have a total of 6 people manning this cell(3 per shift). On Takt Time calculation we only subtract breaks and possibly lunch. In this example we have 920 minutes of available time. We multiply 920 times 60 and get 55,200 seconds of available time. We then divide the 55,200 seconds by 1504 units that the customer requires and we get a Takt time of 36.7 seconds. We need to net 1 unit every 36.7 seconds.")
54
Standardized Work Takt Time Calculation Example:
Work Unit (Two shift operation) Customer demand = 1100 / per day Available work time = 16 hours = 960 min/day Less 4 breaks per 10 min each = 40 min Total Available Time = 920 min 920 minutes X 60 seconds = 55,200 seconds Takt Time = 55,200sec / 1100 units = 50.2 seconds We need to net 1 unit every 50.2 seconds This example is very similar to the last one. Everything is the same except the customer has lowered his requirements to 1100 parts per day. So we use the same available daily time and divide that by our new requirement of 1100 parts. We need to net 1 part every 50.2 seconds.
 Customer demand = 1100 / per day. Available work time = 16 hours = 960 min/day. Less 4 breaks per 10 min each = 40 min. Total Available Time = 920 min. 920 minutes X 60 seconds = 55,200 seconds. Takt Time = 55,200sec / 1100 units = 50.2 seconds. We need to net 1 unit every 50.2 seconds. This example is very similar to the last one. Everything is the same except the customer has lowered his requirements to 1100 parts per day. So we use the same available daily time and divide that by our new requirement of 1100 parts. We need to net 1 part every 50.2 seconds.")
55
Standardized Work Takt Time Calculation Exercise:
Work Unit (Two shift operation) ’ breaks/shift 4 Week Customer Requirements: Week 1 = 6000 units Week 2 = 5800 units Week 3 = 6200 units Week 4 = 6000 units Takt Time = ? Read slide and give audience a few minutes to calculate.
 ’ breaks/shift. 4 Week Customer Requirements: Week 1 = 6000 units. Week 2 = 5800 units. Week 3 = 6200 units. Week 4 = 6000 units. Takt Time = Read slide and give audience a few minutes to calculate.")
56
Standardized Work Takt Time Calculation Exercise:
Work Unit (Two shift operation) ’ breaks/shift 4 Week Customer Requirements: 24,000/20 days = 1200 2 x 8 hrs. = 16 hrs. x 60’ = 960’ - 40’ breaks = 920’ 920’ x 60” = 55,200” Takt Time = 55,200”/1200 = 46” How many participants got the right answer?
 ’ breaks/shift. 4 Week Customer Requirements: 24,000/20 days = x 8 hrs. = 16 hrs. x 60’ = 960’ - 40’ breaks = 920’ 920’ x 60 = 55,200 Takt Time = 55,200 /1200 = 46 How many participants got the right answer")
57
Target Cycle Time Target Cycle Time = Takt Time - Special Allowances
Takt time as we discussed, is an ideal condition, only allowing for breaks. Target cycle time will allow for such items as meetings, PM, changeovers, etc. because these are real and they happen. The cell is not operating to produce parts to Takt schedule during these times. Target cycle time is takt time minus these special allowances.

58
Target Cycle Time Target Cycle Time may include planned,
repetitive operations - Examples of Special Allowances Team Meetings Preventive Maintenance Changeover Planned, repetitive allowances will be determined by each Business Group

59
Target Cycle Time Changeover time should be continuously improved
Building a flat allowance is wrong Initial time built-in must be improved

60
Target Cycle Time Example
Production Requirement: parts per day P.M minutes X 2 shifts = 30 min. EI Meeting 12 minutes X 2 shifts = 24 min. 54 min. 54 minutes X 60 seconds = 3240 seconds 3240/ 1504 = 2.15 seconds lost for Special Allowances Target Cycle Time = 36.7(Takt) – 2.15(SPA) = sec. In this example, our customer requires 1504 parts per day. Remember that our Target Cycle Time calculation is our Takt Time minus Special Allowances. In this example, our Takt time is 36.7 seconds minus our Special Allowances of 2.15 seconds. Our Target cycle time is seconds.
 – 2.15(SPA) = sec. In this example, our customer requires 1504 parts per day. Remember that our Target Cycle Time calculation is our Takt Time minus Special Allowances. In this example, our Takt time is 36.7 seconds minus our Special Allowances of 2.15 seconds. Our Target cycle time is seconds.")
61
Target Cycle Time Example
Production Requirement: parts per day P. M minutes X 2 shifts = 30 min. EI Meeting 12 minutes X 2 shifts = 24 min. 54 min. 54 minutes X 60 seconds = 3240 seconds 3240 / 1100 = 2.95 seconds lost for Special Allowances Target Cycle Time = 50.2(Takt) – 2.95(SPA) = sec. Again, this example is the same as the last one with the exception of requirements. This makes our Takt time different as well as our Target Cycle time. We take our Takt time of 50.2 seconds minus our Special Allowance time of 2.95 seconds and get a Target Cycle time of seconds.
 – 2.95(SPA) = sec. Again, this example is the same as the last one with the exception of requirements. This makes our Takt time different as well as our Target Cycle time. We take our Takt time of 50.2 seconds minus our Special Allowance time of 2.95 seconds and get a Target Cycle time of seconds.")
62
Target Cycle Time Exercise
Production Requirement: parts per day Takt Time = 46” P. M minutes X 2 shifts = 30 min. EI Meeting 12 minutes X 2 shifts = 24 min. 54 min. Target Cycle Time = ? Read slide and give audience a few minutes to calculate.

63
Target Cycle Time Exercise
Production Requirement: parts per day Takt Time = 46” P. M minutes X 2 shifts = 30 min. EI Meeting 12 minutes X 2 shifts = 24 min. 54 min. 54 minutes X 60 seconds = 3240 seconds 3240 / 1200 = 2.7 seconds lost for Special Allowances Target Cycle Time = 46(Takt) – 2.7(SPA) = 43.3 sec. How many participants got this answer?
 – 2.7(SPA) = 43.3 sec. How many participants got this answer")
64
Manual time + Walk Time + Wait Time
Standardized Work Actual Cycle Time = Manual time + Walk Time + Wait Time

65
Standardized Work Actual Cycle Time = Manual time +Walk time +Wait time Longest operator’s actual cycle time tells us how many parts the cell is capable of running Actual Cycle Time is the time it takes an operator to complete one cycle of his/her standard work Determine actual cycle time by a point to point recording. Usually we are looking at cells with more than one operator. The longest time determines how many parts the cell is capable of running. (Refer to the video)
")
66
Standardized Work Manual Time: The time required for an operator to perform the physical tasks for one cycle of operation (Inspecting, loading / unloading, and gauging) Give examples. Does not include walking and waiting time. These will be handled separately.
 Give examples. Does not include walking and waiting time. These will be handled separately.")
67
Standardized Work Walk Time: The time required for the physical movement from one point to another, with or without a part

68
Standardized Work Wait Time: The time the operator waits while the machine completes its function If the operator must hold a part while the machine is running, it is NOT wait time, but is part of manual time. An example would be a sizer or end-forming operation on a tube. If the operator can release part, but simply stands there and waits, it is wait time.

69
Standardized Work Unassigned Time The difference between your actual
cycle time and your target cycle time

70
Standardized Work Machine Cycle Time: The time required by a machine to complete one cycle of operation *Machine cycle time may also be referred to as Auto Time Does not include loading and unloading unless it is part of automatic cycle. Manual loading and unloading are included in manual time.

71
Target Work Unit Staffing
Total Manual Time+ Total Walk Time Target Cycle Time # Of Members = This is the formula used for cell staffing. The top portion is the cycle time of the cell. The bottom must always be continuously improved upon. For improvements to be made, we need to track information so that we will know exactly where our problems are. If we do not have any indication of where or what the root cause of problems are, how can we fix them.

72
Elements Comments Operation Name Date: # 1 2 3 4 5 H L Element Times
Tubing to bender Walk to bender Load bender Bender cycles Unload bender This sheet will be used to get your machine cycle times and your manual time. Remember, by definition, machine cycle time is the time required by a machine to complete one cycle of operation. Machine Cycle Time does NOT include loading and unloading unless part of automatic cycle of a machine. Your operator or Manual Time is the time required for an operator to complete one cycle of operation. (Inspecting, loading, unloading, and gauging) This is sometimes known as Point to Point. You will time 5 cycles for each process. Refer to your workbook on pages 79 & 80. Form #: 3-A
 This is sometimes known as Point to Point. You will time 5 cycles for each process. Refer to your workbook on pages 79 & 80. Form #: 3-A.")
73
Standardized Production
SEQ. PROCESS NAME ASSET NUMBER MANUAL TIME MACHINE TIME AUXILIARY TIMES TOTAL PROCESS CAPACITY COMMENTS Standardized Production Capacity Sheet Totals 1 Tubing to bender 2 3 4 5 6 7 Bender Sizer Inlet welding operation Outlet welding operation Leak test / gauge, etc. Finished Goods 38 35 30 10 234567 234561 023456 234569 234555 31 43 13 41 36 16 641 673 2123 1725 766 Date Cell # Part# We want to analyze our capacity limitations. Obviously, a machine can limit our capacity. The Standardized Production Capacity Sheet illustrates the machine limits on our capacity. In other words, even if we had no manual, walk, or wait times, what would be our maximum capacity. Process Capacity = Total available time / automatic + manual time. (Automatic time is same as Machine Time). On this sheet, we want to list each process of our operation. Then using our Element sheet we will put in our manual times and automatic times on each process. The special allowance columns are for use when we have a variation from the standard process. What is the capacity of this cell? 641 is our lowest number telling us that this will be the most parts we can get; it is our bottle neck. We get 641 by dividing our available daily time (seconds) by the Automatic + Manual Time. 27,600 / 43 = or 641 pcs We are now going to put our manual and auto time on the Standardized Work Chart form. Let’s see what our capacity or bottle neck is; machine wise.
. On this sheet, we want to list each process of our operation. Then using our Element sheet we will put in our manual times and automatic times on each process. The special allowance columns are for use when we have a variation from the standard process. What is the capacity of this cell is our lowest number telling us that this will be the most parts we can get; it is our bottle neck. We get 641 by dividing our available daily time (seconds) by the Automatic + Manual Time. 27,600 / 43 = or 641 pcs. We are now going to put our manual and auto time on the Standardized Work Chart form. Let’s see what our capacity or bottle neck is; machine wise.")
74
Report Out 2 Deliverables
1- Standard Work Chart 2- Exercise #2 Report Out # 2 We are now ready for our second Break Out Session. Each team will use the same video tape as before to complete this exercise. Your facilitators will give you further instructions on how to complete the Elements Sheet, and the Standardized Production Capacity Sheet using information you will get from the video. You will also be adding information to the SWC that you prepared in your first Break Out session. The 2 sheets we will want to see on overheads are the SWC and the Exercise #2 Report Out sheet. (State time teams should return to main training room.) Watch the video tape to complete this exercise
 Watch the video tape to complete this exercise.")
75
5 4 3 2 7 6 1 S.I.P.S. 18 30 38 10 STANDARDIZED WORK CHART Part No.
Part Name Line # of Members Takt Time Target Cycle Time Standard In-Process Stock Date Member Manual Time Walk Wait Total Cycle Auto Time Manual Time Daily Customer Demand Shifts Bottleneck Scheduled Breaks/Day Allowances/day for 5 4 3 2 7 6 1 10 S.I.P.S. 30 18 38

76
Exercise 2 Report Out Takt Time: ________________ Target Cycle Time:
Form No. 2 Exercise 2 Report Out ( Video Exercise ) Takt Time: ________________ Target Cycle Time: Longest Machine Cycle Time: Machine Capacity vs Customer Requirement ____________ vs ____________ Total Work Unit Manual Time: ___ _____________ Total Work Unit Walk Time: Total Work Unit Wait Time: Target Work Unit Staffing: Longest Operator Actual Cycle Time: Longest Operator Actual Cycle Time vs Target Cycle Time Again, your facilitators are ready to assist you in this break out. There are several worksheet forms you will use during this break out. However, the only two sheets you should prepare an overhead transparency of are: 1) The Standardized Work Chart with the additional information you will add to it during this break out, and 2) The Exercise # 2 Report Out form.
 Takt Time: ________________. Target Cycle Time: Longest Machine Cycle Time: Machine Capacity vs Customer Requirement. ____________ vs ____________. Total Work Unit Manual Time: ___. _____________. Total Work Unit Walk Time: Total Work Unit Wait Time: Target Work Unit Staffing: Longest Operator Actual Cycle Time: Longest Operator Actual Cycle Time vs Target Cycle Time. Again, your facilitators are ready to assist you in this break out. There are several worksheet forms you will use during this break out. However, the only two sheets you should prepare an overhead transparency of are: 1) The Standardized Work Chart with the additional information you will add to it during this break out, and 2) The Exercise # 2 Report Out form.")
77
Standardize Work Tools
Module 4 Standardize Work Tools

78
Standardized Work Tools
Standardized Work Analysis Labor Requirements S W C T - Standardized Work Combination Table Staffing Graph Balance Board Now that we’ve done the layout of our cell and developed times, we want tools that will help us improve. How do we better analyze elemental work times? How do we balance labor requirements in a cell? These are 3 tools we will use to make improvements. W e will discuss each one and show examples.

79
STANDARDIZED WORK CHART
Finished Goods STANDARDIZED WORK CHART Part No. Part Name Line # of Members Takt Time Target Cycle Time Standard In-Process Stock Date Member Manual Time Walk Wait Total Cycle A B C Auto Time Manual Time Daily Customer Demand 30” 28.6” 4 Shifts 2 4440 1840 08/30/99 CC3330 Exhaust Assembly Bottleneck Scheduled Breaks/Day 40’ Allowances/day for Target Cycle Time 42.9’ D 9” 6” 8” 12” 27” 3” 2” 19” 20” 14” Orbital Welder Spinner Stuffer Stamp Press Lockseamer Flare Press 1 3 5 1” 5” 4” 26” 10” Bender Sizer Cutoff Heads Guts Steel Tubes 21” The following SWCTs were created from this standard work chart.

80
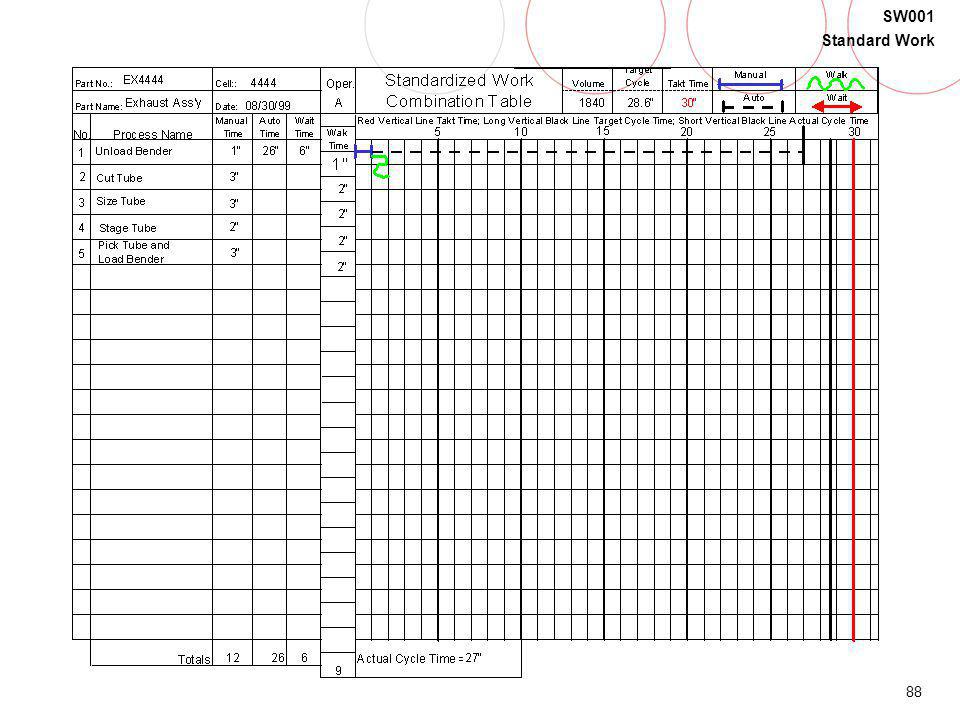
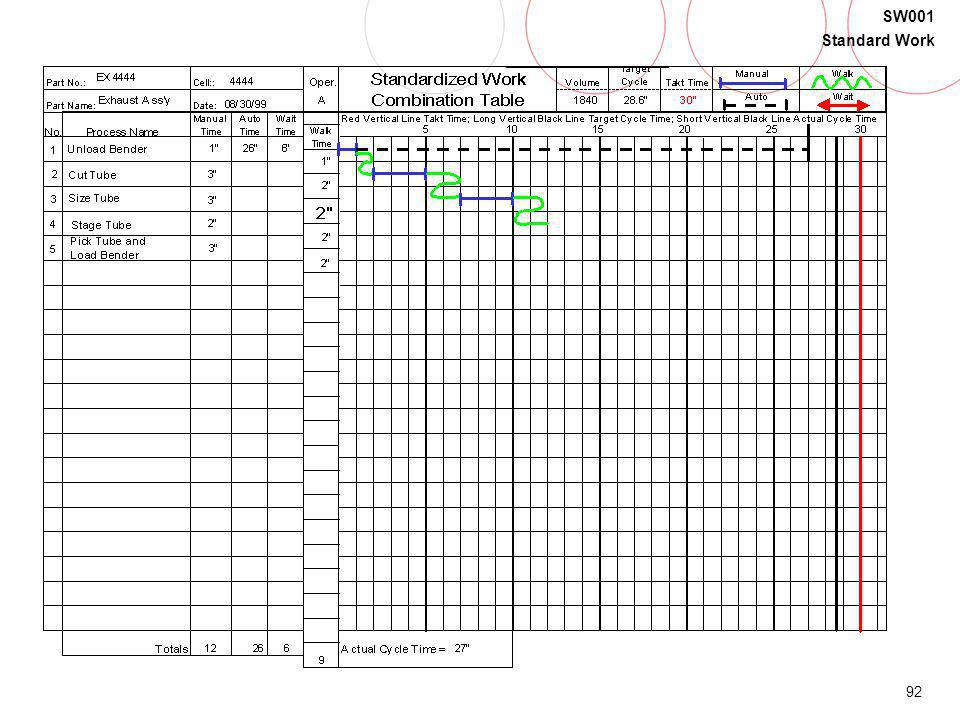
Standardized Work Combination Table
Don’t let this tool confuse you. It is a simple flow tool that illustrates what one operator does with a combination of tasks. Let’s look at an example, and walk through it.

101
Do I Need To Fill Out More Than One SWCT?
Make a separate SWCT for each product family with a unique process or with over 2 seconds of work difference PRESENTERS - The following slides are discussed AFTER Report Outs. For Exercise 3, these slides are designed to reinforce learning from the Exercise.

102
Target Work Unit Staffing
Total Manual Time + Total Walk Time Target Cycle Time # Of Members = Remember the calculation for Standard Labor? We’re now going to do Standard Manning from the video taped line. Remember, in case of a decimal, always round up to the nearest whole number. Example: if your calculation answer is 9.3 people, round up to 10 people.

103
Balance Board Shows whether or not line is balanced
Is a visual tool to help us better balance the work load Is to be used by the work team Brain Storm. Play around with the magnetic blocks. Move from operator to operator. This is the team’s tool to improve the line.

104
BALANCE BOARD Operator A 27 seconds Operator B 19 seconds Operator C
Takt Time 30” Target Cycle Time 28.6” Wait On Bender Walk to Unload 2.0 Walk to F.P Walk to Stage Walk to Steel Pick Tube & Load Bender Stage Part Pack Part Load & Act. FP 2.0 Walk to F.G Walk to F. P Walk to Stage Walk to Tubes Unload L. S Unload Spin Pick Part Stage Tube Wait on L. S Wait on Spin Walk to Stage Load & Act Size Tube Load Lockseam 1.0 Load Spinner Walk to Sizer Walk to L.S Walk to Spinner 2.0 The completed Balance Board should look something like this. Again, this is another tool for the team to use to better balance their line. Cut Tube Stamp Steel Load Unload S 3.0 Wait on Welder 1.0 Walk to Cutoff 1.0 Walk to Press Walk to Stuffer Walk to Welder 1.0 Unload bender 1.0 Pick Steel Unload F.P Pick Pipe & Muff 2.0 Operator A 27 seconds Operator B 19 seconds Operator C 20 seconds Operator D 21 seconds

105
Staffing Graph Once we have analyzed each operation in detail, we can take a look at labor requirements. Let’s look at required labor in a cell. How can we determine how many operators are needed?

106
Operator Total Manual Time Total Walk Time Total Wait Time Actual Cycle Time Target Cycle Time Unassigned Time A B C D Total In this case, there are four operators, with their cycle times varying from 19 seconds to 27 seconds. The Target Cycle Time is 28.6 seconds. The difference between the Target Cycle Time and Actual Cycle Time is called Unassigned Time. If the total unassigned time is greater than the target, then the cell needs to look at the staffing levels.

107
4 Members – Work Unit 3000 50 45 40 35 30 25 20 15 10 5 Wait Time
Takt Time 30 Target Cycle Time 25 20 Wait Time 15 Walk Time Look at this graph, based on our example Is the work balanced? What else do you notice? What if B & C did D’s work? Look back at the charted times. Our total unassigned time was 27.4 seconds, longer than any other operator’s Actual Cycle Time. 10 Manual Time 5 A B C D

108
4 Members – Work Unit 3000 Balanced but not to Target Cycle Time 50 45
40 35 Takt Time 30 Target Cycle Time 25 20 Wait Time 15 Walk Time This is what normally happens, but all we are doing is balancing the unassigned time. 10 Manual Time 5 A B C D

109
4 Members – Work Unit 3000 Balanced to Target Cycle Time 50 45 40 35
Takt Time 30 Target Cycle Time 25 20 Wait Time 15 Walk Time This is what should take place. All operators are balanced close to target cycle time. 10 Manual Time 5 A B C D

110
3 Members – Work Unit 3000 Eliminated Wait and Balanced to Target
Cycle Time 50 45 40 35 Takt Time 30 Target Cycle Time 25 20 Wait Time 15 Walk Time By eliminating the wait, this is the next step. Are we ready to let operators work this way? This will drive the need for the next improvement. 10 Manual Time 5 A B C D

111
Eliminated Wait, Reduced Walk & Balanced to Target Cycle Time
2 Members – Work Unit 3000 Eliminated Wait, Reduced Walk & Balanced to Target Cycle Time 50 45 40 35 Takt Time 30 Target Cycle Time 25 20 Wait Time 15 Walk Time With a slight reduction in walk, the next step may result in this. The improvement process doesn’t stop here. 10 Manual Time 5 A B C D

112
SWCT Exercise 1) Pick tube and load auto loader: 3”
2) Walk to front of bender: 1” 3) Wait for bender to complete cycle: 6” 4) Unload bender: 1” 5) Bender auto time: 26” 6) Walk to cutoff: 2” 7) Cut tube: 3” 8) Walk to sizer: 2” 9) Size tube: 3” 10) Walk to stage: 2” 11) Stage pipe: 2” 12) Return to tubing: 2” Auto Time Walk Time Develop Standard Work Combination Table using these work elements and times. Manual Time Wait Time
 Walk to front of bender: 1 3) Wait for bender to complete cycle: 6 4) Unload bender: 1 5) Bender auto time: 26 6) Walk to cutoff: 2 7) Cut tube: 3 8) Walk to sizer: 2 9) Size tube: 3 10) Walk to stage: 2 11) Stage pipe: 2 12) Return to tubing: 2 Auto Time. Walk Time. Develop Standard Work Combination Table using these work elements and times. Manual Time. Wait Time.")
113
How many tables look like this?
Notice the wrap around effect of the auto time of the bender. The auto time cannot extend past the actual cycle time. The wait time is the result of the bender completing its cycle.

114
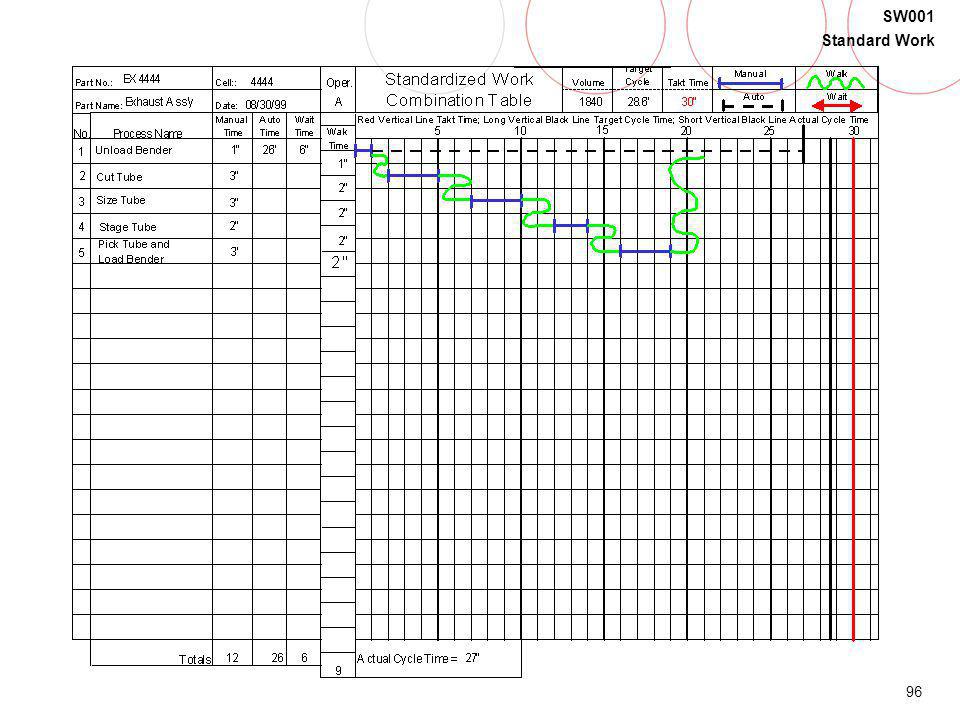
This example shows what the SWCT will look like if you begin at a different starting point.
No wrap around effect of the auto time of the bender required. Once again, the six seconds of wait is on the bender.

115
Report Out 3 Deliverables
1-Standard Work Combination Table 2-Staffing Bar Graph 3-Staffing Chart # 3 We are now ready for our next Break Out Session. We are still using the video tape to view for this exercise. Your facilitators will give you further instructions on how to complete the Standard Work Combination Table (SWCT) using information you obtain from the video. Each team will return to this room to present the SWCT, a Staffing Bar Graph, and Staffing Chart for their Report Out. (State time teams should return to main training room.) PRESENTERS NOTE: There are several slides you will discuss AFTER these Report Outs. Watch the video tape to complete this exercise
 using information you obtain from the video. Each team will return to this room to present the SWCT, a Staffing Bar Graph, and Staffing Chart for their Report Out. (State time teams should return to main training room.) PRESENTERS NOTE: There are several slides you will discuss AFTER these Report Outs. Watch the video tape to complete this exercise.")
116
Module 5 Product Mix How does Product Mix affect manning?
If you run more than one product in your cell, do they all have the same Takt times? Require the same manning? Let’s look at two ways to handle these cases.

117
Product Mix Example Product A + B + C = 876 total units
A = 219 units/876 total units = .25 or 25% B = 307 units/876 total units = .35 or 35% C = 350 units/876 total units = .40 or 40% 876 total units = % Here are 3 products, with different requirements. The total units required per day are 876; and, based on that, Standard Manning is 9.2 But it varies from part to part. Also, remember to round up to nearest whole number. (10)
")
118
{ Product Mix Example A = 219 = 25% B = 307 = 35% C = 350 = 40%
Product A + B + C = 876 A = 219 = 25% B = 307 = 35% C = 350 = 40% 876 = 100% Total Daily Available Time Avg. Daily Units Required(A,B,C) TAKT = Total Available Time: 8 hours X 60’= 480’-20’(2-10’ breaks)=460’X60”=27,600” 27600”/876 daily units required = 31.5” Takt Time Here are 3 products, with different requirements. The total units required per day are 876; and, based on that, Standard Manning is 9.2 But it varies from part to part. Also, remember to round up to nearest whole number. (10)
 TAKT = Total Available Time: 8 hours X 60’= 480’-20’(2-10’ breaks)=460’X60 =27, /876 daily units required = 31.5 Takt Time. Here are 3 products, with different requirements. The total units required per day are 876; and, based on that, Standard Manning is 9.2 But it varies from part to part. Also, remember to round up to nearest whole number. (10)")
119
Target Cycle Time Calculation
Target Cycle Time = Takt Time - Special Allowances Takt Time = 31.5” Special Allowances = 10’ TPM + 12’ Team Meeting Special Allowances = 22’ X 60” = 1320” Special Allowance per cycle = 1320”/876 units = 1.5” 31.5”(Takt Time) - 1.5”(Special Allowance) = 30.0” TCT
 (Special Allowance) = 30.0 TCT.")
120
Fixed Staffing Method Consistent Staffing Level

121
Product Mix Example Calculation of Avg. Target Staffing Product A B C
Manual 306” 260” 200” Walk 50” 40” Total 356” 300” 240” % Mix 25% 35% 40% Part A ” x .25 = 89” Part B ” x .35 = 105” Part C ” x .40 = 96” 290” Weighted Average For each product, we have totaled the Manual and Walk times. We have calculated the average total based on product mix. Thus, these three products have Manual and Walk times ranging from 240 seconds to 356 seconds, but the weighted average is 290 seconds. 290 seconds divided by Target Cycle time of 30” equals 9.6 operators. (Round up to nearest whole number - 10)
")
122
Target Staffing Example
Total Manual Time + Total Walk Time 290” 30.0” = = = 9.6 Target Cycle Time We round to the next full person and use 10 people

123
Fixed Staffing/Flex TCT
Product A B C Manual 306” 260” 200” Walk 50” 40” Total 356” 300” 240” % Mix 25% 35% 40% Part A 356”/9.6 = 37.08” Target Cycle Time Part B 300”/9.6 = 31.26” Target Cycle Time Part C 240”/9.6 = 25.00” Target Cycle Time For each product, we have totaled the Manual and Walk times. We have calculated the average total based on product mix. Thus, these three products have Manual and Walk times ranging from 240 seconds to 356 seconds, but the weighted average is 290 seconds. 290 seconds divided by Target Cycle time of 30” equals 9.6 operators. (Round up to nearest whole number - 10)
")
124
Fixed Target Cycle Time Method
Consistent Target Cycle Time

125
Fixed TCT/Flex Staffing
Product A B C Manual 306” 260” 200” Walk 50” 40” Total 356” 300” 240” % Mix 25% 35% 40% 356”/30.0” = 11.8 Target Staffing 300”/30.0” = 10.0 Target Staffing 240”/30.0” = Target Staffing For each product, we have totaled the Manual and Walk times. We have calculated the average total based on product mix. Thus, these three products have Manual and Walk times ranging from 240 seconds to 356 seconds, but the weighted average is 290 seconds. 290 seconds divided by Target Cycle time of 30” equals 9.6 operators. (Round up to nearest whole number - 10)
")
126
Product Mix Example Fixed TCT Fixed Staffing Target Cycle Target
B ” ” C ” ” Gross ” ” Now if this is a Paced Line, where the 30 seconds will be the same for all three products, then we need to flex the staffing: Part A will average 11.3 (12) people, Part B will average 9.5 (10) people. However, if the line is not paced, we can change Target Cycle time, we then leave manning fixed. So, in example 2, we always use 9.2 (10 operators), but have different Target Cycle times.
 people, Part B will average 9.5 (10) people. However, if the line is not paced, we can change Target Cycle time, we then leave manning fixed. So, in example 2, we always use 9.2 (10 operators), but have different Target Cycle times.")
127
LINE EXERCISE So far, we’ve established all our times based on a video. A video is good. We should use them whenever practical. However, often you will need to evaluate your cell, and possible improvements, without a video. So, how do you establish element times? With a Stop watch. Prior to our floor exercise, let’s examine how we’ll use the stop watch.

128
Report Out 4 Deliverables
1-Standard Work Chart 2-Staffing Bar Graph 3-Exercise # 4 Report Out 4-SWCT Report Out # 4 We are now ready for our next Break Out Session. In this exercise you will need to gather information from the floor. Each team will have a cell or line to view for this exercise. You will use the techniques and tools that we learned from earlier exercises to complete the Standard Work Chart, Staffing Bar Graph, Balance Boards, and Exercise #4 Report - Out sheet. Each team will return to this room to present overheads of the SWC, Manning Bar Graph, Balance Board, and Exercise #4 Report - Out sheet. (State time teams should return to main training room.) This Report Out based on data gathered from visit to work unit or next video
 This Report Out based on data gathered from visit to work unit or next video.")
129
Exercise 4 Report Out Takt Time: ________________ Target Cycle Time:
(Work Unit Data) Takt Time: ________________ Target Cycle Time: ________________ Longest Machine Cycle Time: ________________ Machine Capacity vs Customer Requirement ____________ vs ____________ Total Work Unit Manual Time: ___ _____________ Total Work Unit Walk Time: ________________ Total Work Unit Wait Time: ________________ Target Work Unit Staffing: ________________ Longest Operator Actual Cycle Time: ________________ Longest Operator Actual Cycle Time vs Target Cycle Time ____________ vs ____________ Form No. 4
 Takt Time: ________________. Target Cycle Time: ________________. Longest Machine Cycle Time: ________________. Machine Capacity vs Customer Requirement. ____________ vs ____________. Total Work Unit Manual Time: ___. _____________. Total Work Unit Walk Time: ________________. Total Work Unit Wait Time: ________________. Target Work Unit Staffing: ________________. Longest Operator Actual Cycle Time: ________________. Longest Operator Actual Cycle Time vs Target Cycle Time. ____________ vs ____________. Form No. 4.")
130
Before / After Improvements
Module 6 Before / After Improvements As we discover opportunities for improvements, one of the things we will want to do is document a record of the Before and After conditions. The tool we will use to keep track of improvements we implement is simple to use. It is called the Before / After Improvement Sheet. Example on next slide.

131
W. O. # Before Improvement After Improvement Work Unit Team Facility
Idea # Problem Implemented Item Date Submitted Date Required Date Completed Champion Team Contact W. O. # Effect As each section appears, explain. As you can see from this form we have a standard tool which will capture the important details of improvement ideas.

132
GROUP: TEAM LOCATION: FRANKLIN LINE: NS 6520 DATE: 1/20/97
PROBLEM IMPLEMENTED ITEM EFFECT Loading three different parts Build staging rack to hold 1. Improve ease of operation. into Melton takes too long components in assembled 2. Decrease SWCT by 5 seconds (9”) position. AFTER IMPROVEMENT BEFORE IMPROVEMENT Deburr / Sizer Operator inserts tubes into Resonator and stages assembly on table Resonator Assembly comes down chute in three pieces to Melton Operator Another example. The team decreased SWCT by 5 seconds.
 position. AFTER IMPROVEMENT. BEFORE IMPROVEMENT. Deburr / Sizer Operator inserts tubes. into Resonator and stages assembly on. table. Resonator Assembly comes down. chute in three pieces to Melton. Operator. Another example. The team decreased SWCT by 5 seconds.")
133
Before Improvement After Improvement
GROUP: 6540 EI TEAM LOCATION: FRANKLIN LINE: NS DATE: 1/7/97 Before Improvement After Improvement Six-Shooter Control Panel Control Panel End Cap Six-Shooter Long Awkward Walk Path Air Check Air Check Pack-Out Crate Pack-Out Crate Shorter Easier Walk Pattern This is a real example of Before / After documentation at our Franklin, Indiana plant. Let’s walk through the details. PROBLEM IMPLEMENTED ITEM EFFECT Operator must walk to end of Move control panel towards 1. Shortened walk distance (10 ft) air check fixture to other end of air check. 2. Provided ease of movement pick up protective end cap Move six- shooter to area 3. Reduced standard work cycle time 4 sec’s for pack-out process after where control panel was located. cycling air check.
 air check fixture to other end of air check. 2. Provided ease of movement. pick up protective end cap Move six- shooter to area 3. Reduced standard work cycle time 4 sec’s. for pack-out process after where control panel was located. cycling air check.")
134
Report Out 5 Deliverables
Present Before & After Improvement Sheets Report Out # 5 Before Improvement After Improvement Problem Implemented Item Team Contact W. O. # Date Submitted Date Required Date Completed Champion Effect Team Line Facility Idea # Our next Break Out Session we are going back out to the floor to do some Before & After Improvement Sheets. Each team will return to this room to present the Before & After Improvement Sheets for their Report Out. (State time teams should return to main training room.) 7
 7.")
135
Module 7 Implementation
Over the next 4 weeks we want to implement Improvements on your work unit, tracking those improvements.

136
Where do we go from here? Over the next 4 weeks we want to implement Improvements on your work unit, tracking those improvements.

137
Implementation Learn by doing on the shop floor
Identify and solve “root cause” conditions Implement low and no cost improvements Promote personal and team growth Work based on need for improvement

138
9 Continuous Improvement Process Steps
Observe current method Document current work elements/steps Identify improvements (steps to eliminate) Implement improvements Validate quality and productivity of new method Standardize new method Document “before” and “after” conditions Recognize achievements Look for next improvement
 Implement improvements. Validate quality and productivity of new method. Standardize new method. Document before and after conditions. Recognize achievements. Look for next improvement.")
139
Implementing Standard Work
Train the work unit members in Standard Work & Takt Time Production. Calculate Takt and Target Cycle Time Develop standard work charts with flex staffing, plus and minus one operator Create Standard Work Combination Tables Create a Balance Board as a tool for improvement

140
Implementing Standard Work
Create a Staffing Graph to identify the opportunities for improvement to target cycle time Identify the Target Work Unit Staffing Calculate Daily PI Create a plan to maintain an active Standard Work & Takt Time Production program.

141
Report Out 6 Deliverables
Form No. 8 Exercise 6 Report Out Work Unit Implementation Plan IMPLEMENTATION OBJECTIVES: Begin immediately; Involve Work Unit Operators Capture Before Condition Calculations Select Key Measurables for B.O.S. Identify Areas of Greatest Opportunity Activities Week 1 : Activities Week 2 Activities Week 3 Report Out # 6 Present Work Unit Implementation Plan ( 4 week plan ) Activities Week 4 : Key Support People:
 Activities Week 4. : Key Support People:")
142
Exercise 6 Report Out Work Unit Implementation Plan
Form No. 8 Exercise 6 Report Out Work Unit Implementation Plan IMPLEMENTATION OBJECTIVES: Begin immediately ; Involve Operators Select Key Measurables Capture Before Condition Calculations Identify Areas of Greatest Opportunity Activities Week 1 : Activities Week 2 Activities Week 3 Activities Week 4 Key Support People:

143
Before and After Continuous Improvement Record
ITEM BEFORE AFTER WIP % UPTIME THRU-PUT TIME MACHINE CYCLE TIME PROCESS STEPS PIECES PER MAN-HOUR % REWORK % SCRAP CUSTOMER PPM % FTSY MT / TAKT % PART FLOW DISTANCE WAIT / TAKT % OTHERS

144
Lean Enterprise Success
Five Key Factors for Lean Enterprise Success 1. A Strategic Vision 2. Strong Line Management 3. Expert Training and Support 4. Aggressive Performance Targets 5. Impatience Based from the book, “Lean Transformation”. Explain each of the five topics, and ask the audience, where we fit each.

Similar presentations


 Hainan c agGY Ia-1 (2) Anhui agGY Ia-2 (3) agGY Ia-1 2 2 WD-2 WD-8 WD-36 agGY Ia-2 3 3.>")


