Download presentation
Presentation is loading. Please wait.

4
Chapter 9 Scatter Plots and Data Analysis LESSON 1 SCATTER PLOTS AND ASSOCIATION

5
Scatter Plots and Association I can construct a scatterplot. I can describe the association, if any, among the observed data. I can construct and interpret a scatterplot. 8.11(A)
.")
6
Vocabulary Bivariate data Scatter plot Positive association Negative association No association Linear association Non-linear association

7
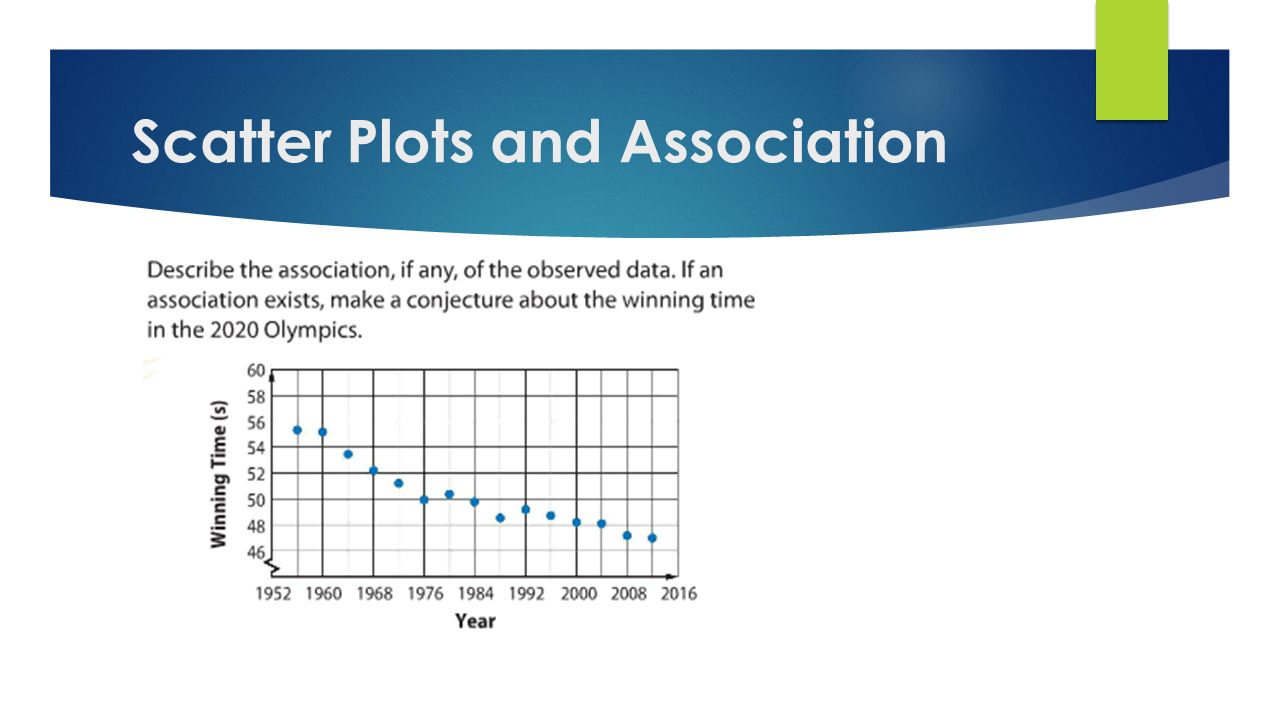
Scatter Plots and Association Data with two variables, or pairs of numerical observations, are called bivariate data. A scatter plot shows the relationship between bivariate data graphed as ordered pairs on a coordinate plane.

8
Scatter Plots and Association

10
Two sets of data have a linear association when the data points lie close to a line. When data points do not lie close to a line, the data have a non-linear association.

11
Scatter Plots and Association

12
Clusters or outliers can also be identified.

13
Scatter Plots and Association Variable Association – what is the relationship between the variables? Linear Association – is it linear or non- linear? Are there clusters or outliers?

14
Scatter Plots and Association

Similar presentations

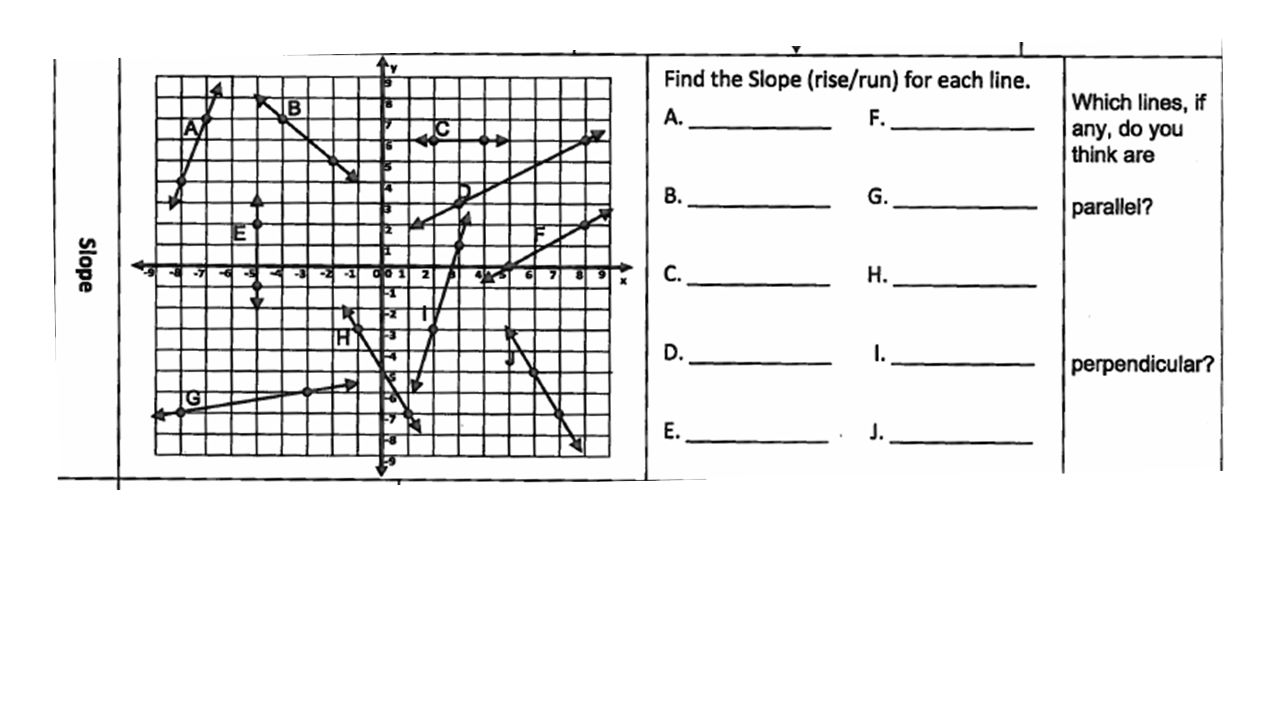


 2. B(–3, 3) 3. C(–2, –1) 4. D(0, –3) 5. E(1, 0) 6. F(3, –2)>")


