Download presentation
Presentation is loading. Please wait.

1
A Sediment Budget for Two Reaches of Alameda Creek (1900s through 2006) Paul Bigelow, Sarah Pearce, Lester McKee, and Alicia Gilbreath
 Paul Bigelow, Sarah Pearce, Lester McKee, and Alicia Gilbreath")
2
Study Questions Are the study reaches supplying a major source of sediment to the flood control channel? What are the dominant processes, and what are the rates of erosion and amount of storage? What proportion of total sediment load at Niles is derived from the study reaches? How has the channel changed through time?

3
Alameda Creek Watershed

4
Area Behind Dams

5
Study Area

6
Brief Watershed History Pre-1900: channel ditching, groundwater wells, small dams 1900: Ditching and draining of Tulare Lake 1911: ADLL incision rate of 6 in/yr

7
1925: Calaveras Dam, gravel mining 1950s: Four largest flood events on record 1964: San Antonio Dam 1968: Del Valle Dam 1970s: Flood Control Channel construction 1980s to 2000s: Flood Control Channel dredging Oblique view of Pleasanton and Dublin (looking west) during the 1955 flood
 during the 1955 flood")
8
Historical Flow Changes

9
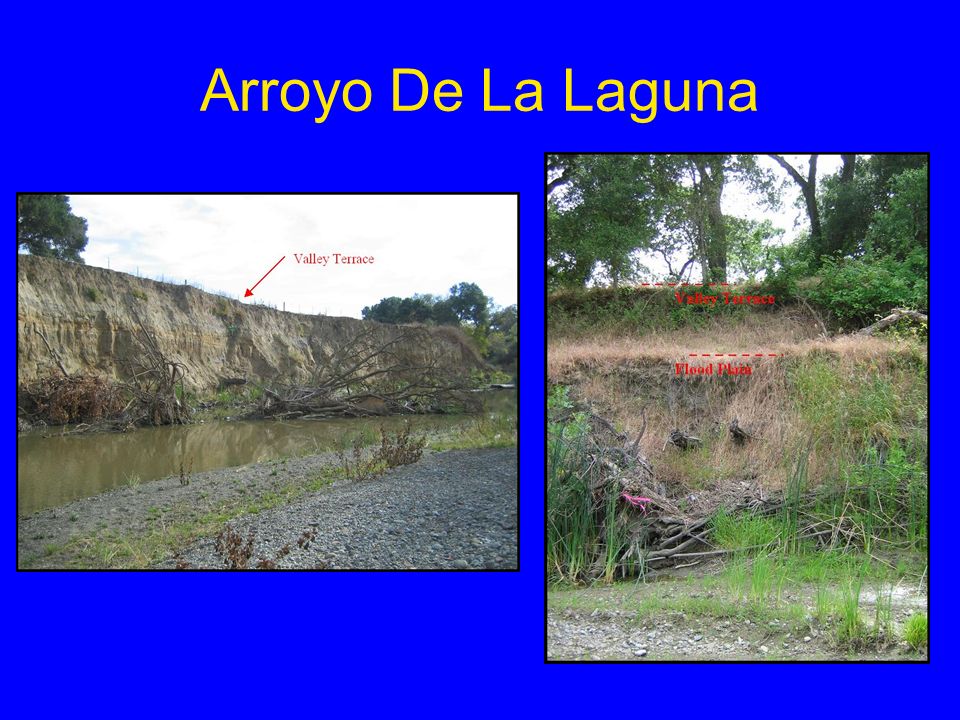
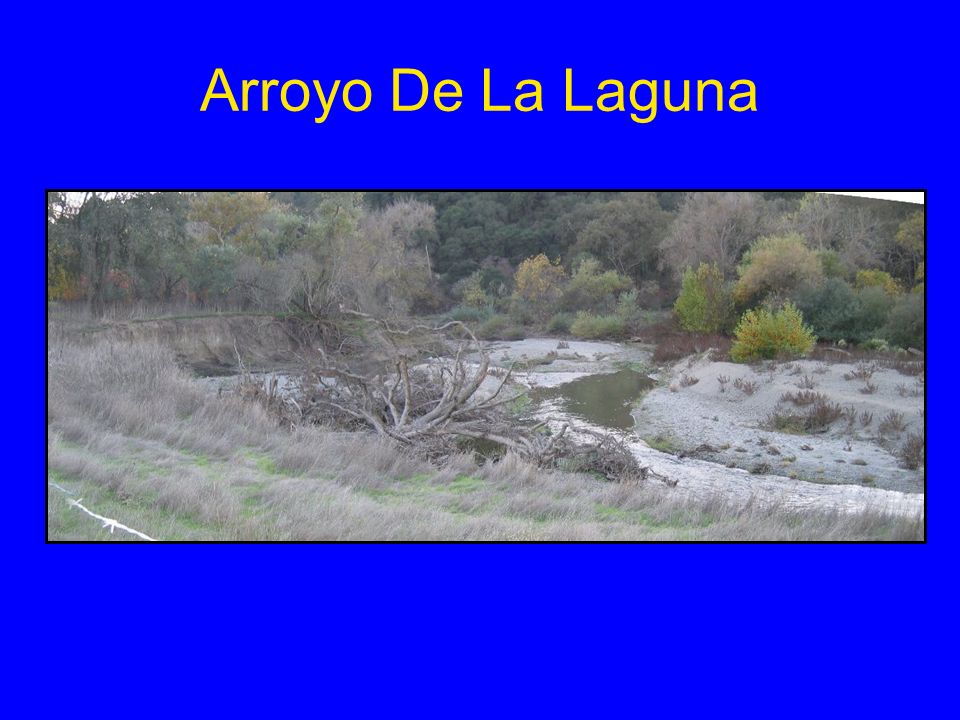
Lower Subreach Upper Subreach Arroyo De La Laguna

12
Alameda Creek

13
Sediment Budget Methods Incision – bed elevation surveys 1959, 1971, 2007 Bank Erosion & Bar Storage – field surveys and air photo analysis Cross Section Surveys – historical and current Flood Plain Storage – field surveys -Only subset of data collected for Alameda Creek Reach (little incision, 90% of drainage area above dams)
")
14
Compare Reaches w/ Watershed Balance the Budget Estimate Yield at Gages (rating curves) Estimate Yield for Ungaged tributaries (reservoir sedimentation rate) Compare Reaches w/ Niles Gage +Verona Gage +Welch Gage +Study Reaches +Ungaged Tribs = Niles Gage?
 Estimate Yield for Ungaged tributaries (reservoir sedimentation rate) Compare Reaches w/ Niles Gage +Verona Gage +Welch Gage +Study Reaches +Ungaged Tribs = Niles Gage")
15
Sediment Budget Periods 1901 – 1959 1959 – 1971 1971 – 1993 1993 – 2006

16
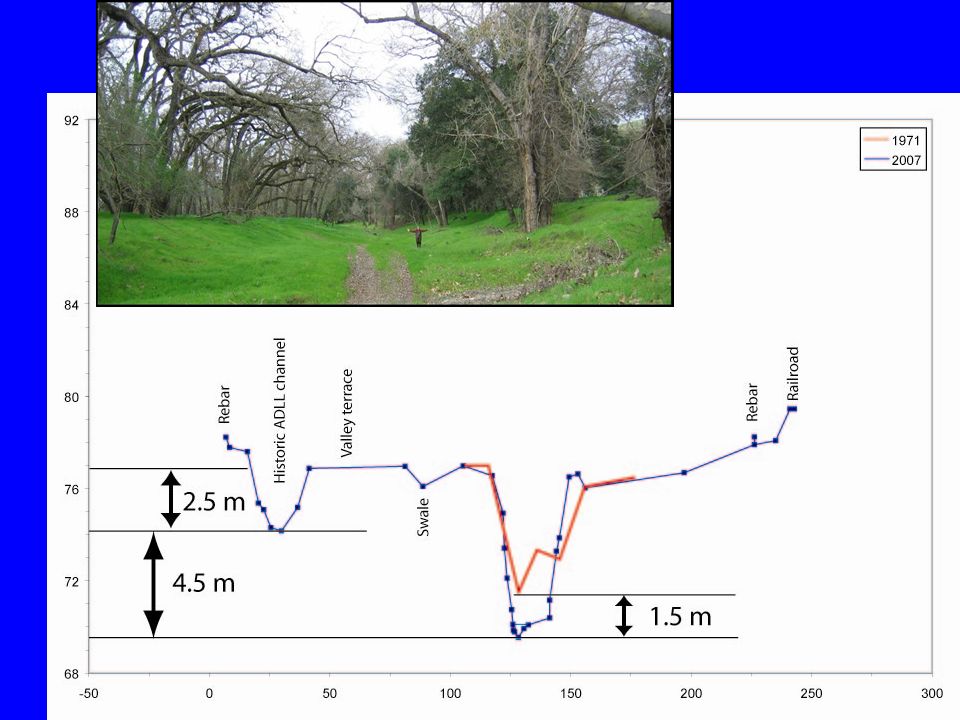
4.5 m ave total incision depth 6 – 10 cm/yr Results Long Profiles Arroyo De La Laguna Bed Elevation ~1901 – 1959

17
1-2 m incision depth 7 – 15 cm/yr 1959 to 1971 Bed Elevation

18
1971 to 2007 Bed Elevation 0.5 – 0.8 m incision 2 – 6 cm/yr 0.75 m aggradation

19
Incision Pattern Over Time Incision Migrating Upstream

20
Further Upstream

21
Bank Erosion & Bar Storage Aerial Photograph Analysis Assessed entire study reach Focused on four locations Four time periods Quantified bank erosion and bar storage

22
1939 Photo

23
1950 Photo

24
1966 Photo

25
1993 Photo

26
2005 Photo

27
Area (m 2 ) 0 1735 1390 5837 8962 Location C 2005 Photo 1939-1950 1950-1966 1966-1993 1993-2005 Retreat rate 0.0 m/yr Retreat rate 0.9 m/yr Retreat rate 0.6 m/yr Retreat rate 3.8 m/yr
 Location C 2005 Photo Retreat rate 0.0 m/yr Retreat rate 0.9 m/yr Retreat rate 0.6 m/yr Retreat rate 3.8 m/yr")
28
Erosion Location Time Period ABCD 1939-1950120000 1950-19663206208300 1966-1993420300400290 1993-20051,9001,4203,7001,050 Bank erosion (metric tonnes/yr)
")
29
Channel Cross Sections

30
5-6 m

32
Flood Plain Storage

33
Sediment Budget by Process - ADLL

34
Alameda Creek Reach

35
Overall Watershed Comparison for Recent Period (1994 – 2006) Sediment Yield Areatonnes/year% of Total ADLL at Verona Gage104,00063 Alameda Creek near Welch Ck Gage3,4002 Arroyo de La Laguna Study Reach8,4005 Alameda Creek Study Reach3200.2 Ungaged areas47,90829 All Areas above Niles Gage164,000 Alameda Creek at Niles Gage156,000 Within 5%
 Sediment Yield Areatonnes/year% of Total ADLL at Verona Gage104,00063 Alameda Creek near Welch Ck Gage3,4002 Arroyo de La Laguna Study Reach8,4005 Alameda Creek Study Reach Ungaged areas47,90829 All Areas above Niles Gage164,000 Alameda Creek at Niles Gage156,000 Within 5%")
36
Study Reaches Comparison to Niles Gage Time Period Niles Gage (tonnes/yr) Study Reaches Combined (tonnes/yr)% of Niles 1959-197174,00019,30026 1972-199390,0003200.4 1994-2006156,0008,7006
 Study Reaches Combined (tonnes/yr)% of Niles ,00019, , ,0008,7006")
37
Study Area Sediment Yield Comparison to Regional Values

38
Sediment Budget Take Home Points Sediment budget has adjusted over several periods of land use alteration and disturbance from floods Budget dominated by incision in earlier periods, now adjusting through bank erosion ADLL sediment yield is high for a short reach (0.25% of total stream network length) But ADLL comprises a small portion of watershed sediment yield (6% of total yield)
 But ADLL comprises a small portion of watershed sediment yield (6% of total yield)")
39
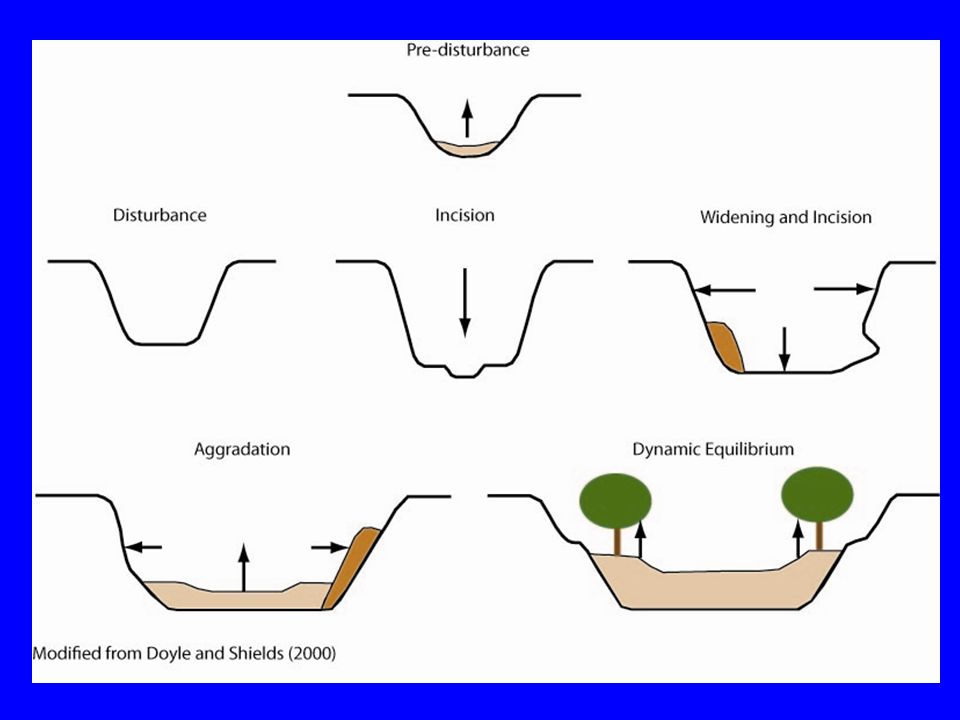
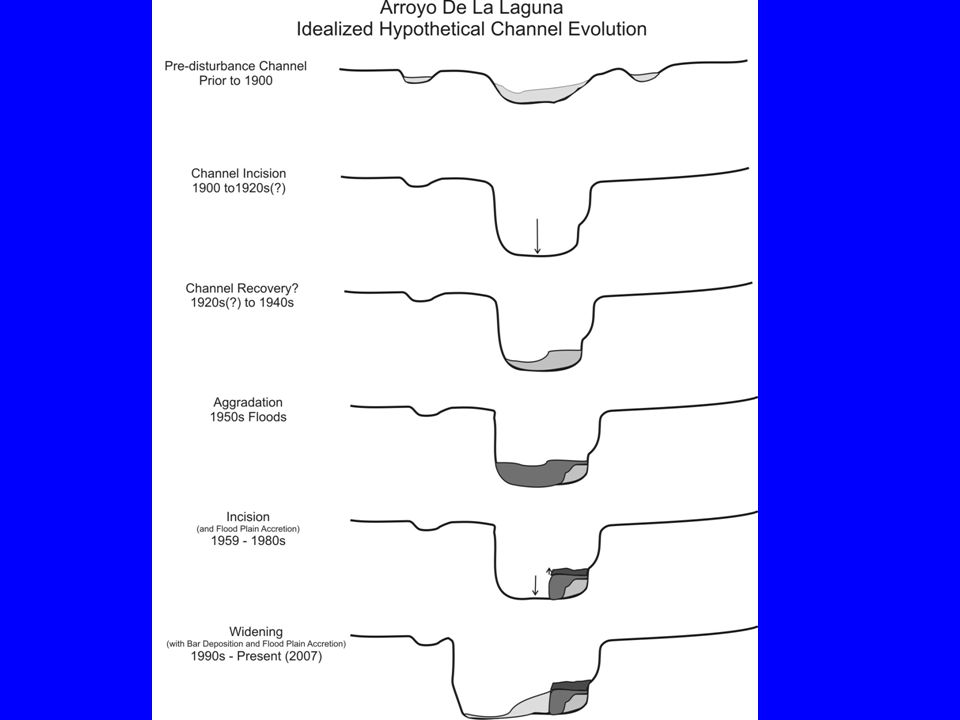
Future Channel Evolution Channel Evolution Models Process-based classification Describe channel form as it responds to a disturbance Shows typical channel adjustments to return a balance of sediment transport capacity

42
Future Response of ADLL Conceptual Scenarios: A (incision) B (aggradation) C (most probable) Peak Discharge Sediment Load Predicted Sediment Supply Response from reach ~ 50% ~ 200% ~ 10%
 B (aggradation) C (most probable) Peak Discharge Sediment Load Predicted Sediment Supply Response from reach ~ 50% ~ 200% ~ 10%")
43
Next Steps - Recommendations Monitor future channel adjustment in ADLL, and continue to stabilize the reach Given management changes on Alameda Creek, monitor future channel response for sediment supply increase Conduct a phased watershed sediment budget –Phase 1: Quantitatively (on public lands) and qualitatively (on private lands) assess feasibly manageable sediment –Phase 2 (if needed): Quantitative evaluation of manageable sediment on private lands Conduct numerical modeling to understand sediment routing to and deposition within the Flood Control Channel
 and qualitatively (on private lands) assess feasibly manageable sediment –Phase 2 (if needed): Quantitative evaluation of manageable sediment on private lands Conduct numerical modeling to understand sediment routing to and deposition within the Flood Control Channel")
Similar presentations


 Analysis of Arroyo de la Laguna Associated with Zone 7’s StreamWISE Program Alameda Creek Watershed Sediment.>")

 Length of Tributary Streams - 264 miles Residential.>")


>")


