Download presentation
Presentation is loading. Please wait.

1
2014-2015 MCC MCA Data Discoveries

2
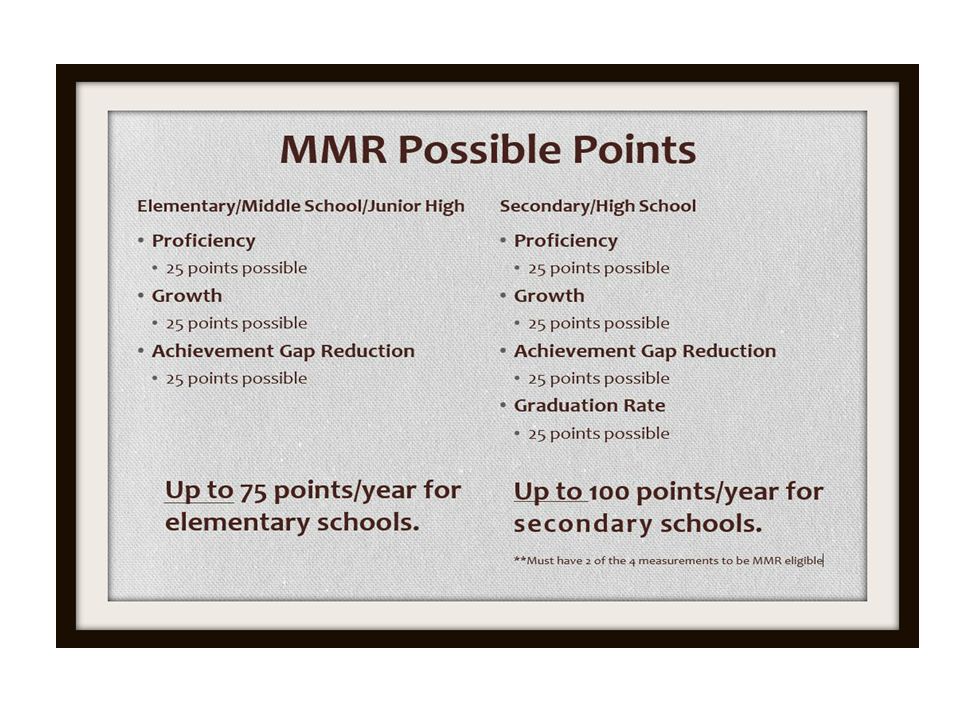
What does Minnesota think is important? What do we want kids to do? Pass important tests “Be Proficient” Grow in their knowledge “Growth” Have equal opportunity to learn Close the “Achievement Gap” Graduate from high school “Graduation” Minnesota believes each of the above things are equally important so…

4
Because each of these things are equally important, they should be treated that way… Pieces of the MMR Pie for High Schools

5
Elementary and Middle Schools don’t graduate students so for them the pie looks like this… Pieces of the MMR Pie for Elementary and Junior High Schools

6
Focus Rating Consists of: Focused Proficiency Achievement Gap Reduction

7
Title I schools can fall into 5 groups based on MMR and FR Reward Schools: These schools are the top 15 percent of Title I schools based on the MMR. They represent the highest-performing schools on the four domains in the MMR. Celebration Eligible: These are the 25 percent of schools directly below the Reward school cutoff. These schools may apply to be Celebration schools, and MDE selects approximately 10 percent of Title I schools to receive the Celebration school recognition. Continuous Improvement: These are the bottom 25 percent of Title I schools that have not already been identified as Priority or Focus. Continuous Improvement schools must work with their districts to create and implement improvement plans as well as set aside 20 percent of Title I funds to support school improvement efforts. Focus: All Minnesota schools receive a Focus Rating (FR) that measures their contribution to the state’s achievement gap. The 10 percent of Title I schools with the lowest FR are identified as Focus Schools. Focus schools are required to set aside 20 percent of Title I funds to support school improvement efforts. These schools are identified every three years. Some Focus schools are identified for persistent low graduation rates. These are schools with a six-year graduation rate, averaged over three years, below 60 percent. This separate group of low graduation rate Priority: These are the 5 percent most persistently low-performing Title I schools based on the MMR. Priority schools are required to set aside 20 percent of Title I funds to support turnaround efforts, and these schools are also identified every three years.
 that measures their contribution to the state’s achievement gap. The 10 percent of Title I schools with the lowest FR are identified as Focus Schools. Focus schools are required to set aside 20 percent of Title I funds to support school improvement efforts. These schools are identified every three years. Some Focus schools are identified for persistent low graduation rates. These are schools with a six-year graduation rate, averaged over three years, below 60 percent. This separate group of low graduation rate Priority: These are the 5 percent most persistently low-performing Title I schools based on the MMR. Priority schools are required to set aside 20 percent of Title I funds to support turnaround efforts, and these schools are also identified every three years..")
8
MCC MMR HS DATA

10
District Demographics subgroup StateMCC American Indian2.4%0.8% Asian7.2%0.8% Hispanic8.4%3.3% Black11.5%0.8% White70.5%94.3% English Learners8.3%0.9% Special Education14.9%12.3% Free/Reduced Price Lunch 38.3%33%

12
Reading Attention: First year assessed on the reading mca-iii 2013 for 3 rd -8 th grades & 10 th grade 2013 for 3 rd -8 th grades & 10 th grade

13
2015 District Reading Proficiency

14
District Reading Proficiency Trends

15
Elementary Reading Proficiency Trends

16
High School Reading Proficiency Trends

17
Subgroup Reading Proficiency Data Looking at our demographics, is there a sub- group that makes up a significant part of our student population?

18
SpEd vs. Non-SpEd Trend Data

19
FRP vs. non-FRP Trend Data

20
Cohort Proficiency Trend Data Helps Identify: Possible gaps in student learning Possible instructional gaps WE ARE COMPARING THE SAME STUDENTS FROM YEAR TO YEAR. MCA III TESTS ONLY

21
Cohort Trend Data Cohort follows the same group of students from year to year. Class of 2017 are 11 th graders in 15-16

22
Cohort Trend Data Cohort follows the same group of students from year to year. The class of 2019 are 9 th graders in 15-16

23
Cohort Trend Data Cohort follows the same group of students from year to year. The class of 2020 are 8 th graders in 15-16

24
Cohort Trend Data Cohort follows the same group of students from year to year. The class of 2021 are 7 th graders in 15-16

25
Cohort Trend Data Cohort follows the same group of students from year to year. The class of 2022 are 6 th graders in 15-16

26
Cohort Trend Data Cohort follows the same group of students from year to year. The class of 2023 are 5 th graders in 15-16

27
Cohort Trend Data Cohort follows the same group of students from year to year. The class of 2024 are 4 th graders in 15-16

28
Grade Level Proficiency Trend Data Helps Identify: Possible gaps in instructional practices Possible gaps in curriculum and resources

29
3 rd Grade Reading Proficiency Trend Data

30
4th Grade Reading Proficiency Trend Data

31
5th Grade Reading Proficiency Trend Data

32
6th Grade Reading Proficiency Trend Data

33
7th Grade Reading Proficiency Trend Data

34
8th Grade Reading Proficiency Trend Data

35
10th Grade Reading Proficiency Trend Data

36
2015 MCA Reading Strand Data

37
District Wide Action Plan Complete: – Current Curriculum and Instruction Data for Reading – Reading Action Plan

39
Math Attention: First year assessed on the math mca-iii 2011 for 3 rd -8 th grades 2011 for 3 rd -8 th grades 2014 for 11 th Grade 2014 for 11 th Grade

40
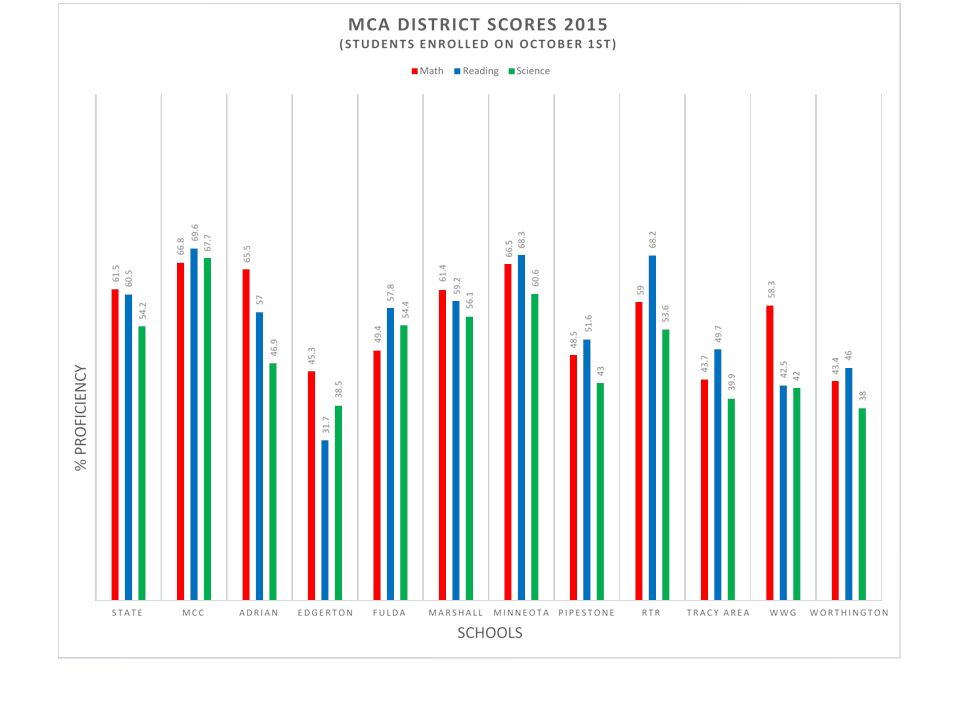
District Math Proficiency

41
District Math Proficiency Trends

42
Elementary Math Proficiency Trends

43
High School Math Proficiency Trends

44
Subgroup Math Proficiency Data Looking at our demographics, is there a sub- group that makes up a significant part of our student population?

45
SpEd vs. Non-SpEd Trend Data

46
FRP vs. non-FRP Trend Data

47
Cohort Proficiency Trend Data Helps Identify: Possible gaps in student learning Possible instructional gaps

48
Cohort Trend Data Cohort follows the same group of students from year to year. The class of 2016 are seniors in 15-16

49
Cohort Trend Data Cohort follows the same group of students from year to year. The class of 2019 are freshman in 15-16

50
Cohort Trend Data Cohort follows the same group of students from year to year. The class of 2020 are 8 th graders in 15-16

51
Cohort Trend Data Cohort follows the same group of students from year to year. The class of 2021 are 7 th graders in 15-16

52
Cohort Trend Data Cohort follows the same group of students from year to year. The class of 2022 are 6 th graders in 15-16

53
Cohort Trend Data Cohort follows the same group of students from year to year. The class of 2023 are 5 th graders in 15-16

54
Cohort Trend Data Cohort follows the same group of students from year to year. The class of 2024 are 4 th graders in 15-16

55
Grade Level Proficiency Trend Data Helps Identify: Possible gaps in instructional practices Possible gaps in curriculum and resources

56
3 rd Grade Math Proficiency Trend Data

57
4th Grade Math Proficiency Trend Data

58
5th Grade Math Proficiency Trend Data

59
6th Grade Math Proficiency Trend Data

60
7th Grade Math Proficiency Trend Data

61
8th Grade Math Proficiency Trend Data

62
11th Grade Math Proficiency Trend Data

63
2014 MCA Math Strand Data

64
District Wide Action Plan Complete: – Current Curriculum and Instruction Data for Math – Math Action Plan

66
Science Attention: First year assessed on the SCIENCE mca-iii 2012 for Grades 5, 8, & 10 2012 for Grades 5, 8, & 10

67
District Science Proficiency

68
District Science Proficiency Trend Data

69
10 th Grade Science Proficiency Trend Data

70
8 th Grade Science Proficiency Trend Data

71
5 th Grade Science Proficiency Trend Data

73
Graduation Rate Report The 2014 Graduation Rate is used for calculation on the 2015 MMR. This is because 2015 Graduation Rates will not be released until February/March 2016 & the 2015 MMR is calculated in September 2015.

74
Graduation Trend Data Year% Students Graduated 201185.3% 201292.2% 201387.1% 201497.7% 2015 * 98.2% *(Unofficial %) State goal is that all districts have 90% graduation rate by 2017, with no sub-group less than 85%.
 State goal is that all districts have 90% graduation rate by 2017, with no sub-group less than 85%.")
75
Testing in 2015-16 Districts need to hold ACT contract directly with ACT – deadline was AUGUST 14 Testing limits – Grades 1 – 6 max 10 hrs per year – Grades 7 – 12 max 11 hrs per year – State required tests are not to be included in this Writing Assessment – TBD HS Graduation requirements – no GRAD ACCESS available online

76
Next steps Goals for 2015-2016 District: Elementary: High School:

Similar presentations


 Information August 6,2013.>")


 Board Presentation March 25, 2008.>")


 Michigan Department of Education Office of Psychometrics, Accountability, Research, & Evaluation Summer.>")


 – Initial Designation.>")