Download presentation
Presentation is loading. Please wait.

1
2013-2014 Review 2014-2015 Planning Faribault Public Schools DATA DAY

2
RATING SYSTEMS

3
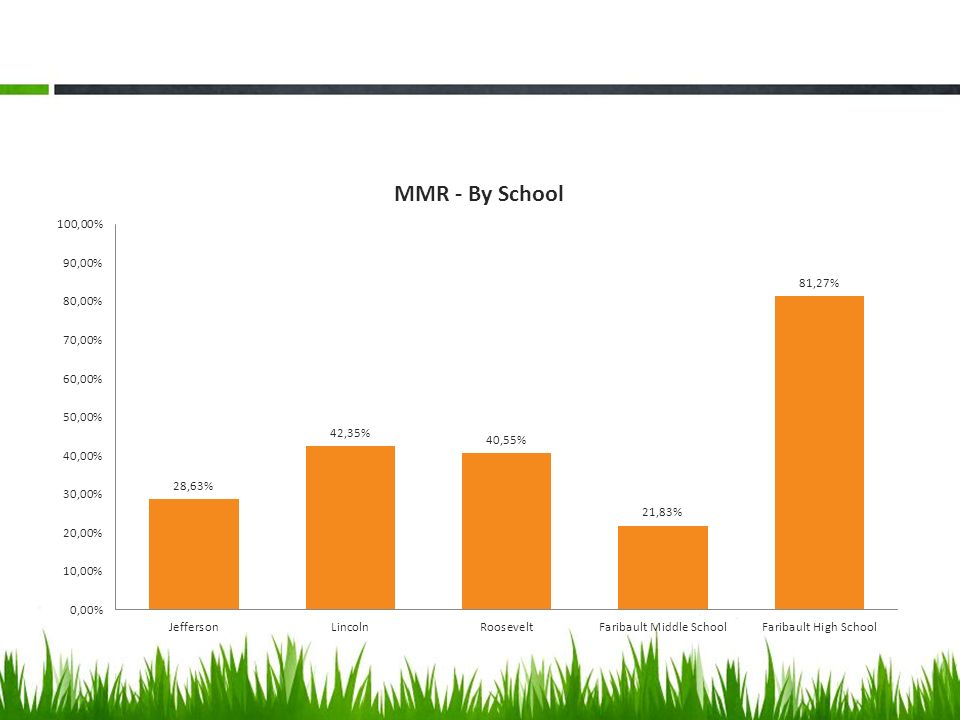
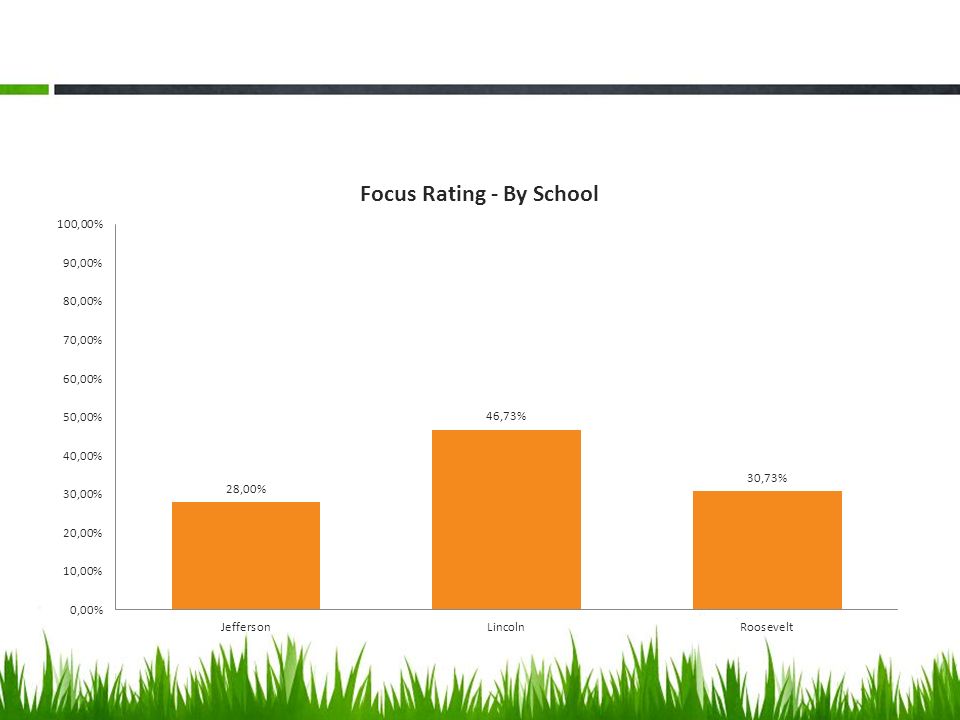
RATING SYSTEM MMR = multiple measurement rating – percentage of points earned in each category: proficiency, student growth, achievement gap reduction, and graduation rates (HS only) FR = focus rating – combining the proficiency and growth of the seven subgroups for which there is an achievement gap (Black, Hispanic, Asian, American Indian, Free/Reduced Price Lunch, Special Education, and English Learners)
 FR = focus rating – combining the proficiency and growth of the seven subgroups for which there is an achievement gap (Black, Hispanic, Asian, American Indian, Free/Reduced Price Lunch, Special Education, and English Learners)")
4
MMR 4 Categories – Proficiency (25 points) – Growth (25 points) – Achievement Gap Reduction (25 points) Elementary/Middle School Total = 75 points – Graduation (25 points) **High School only High School Total = 100 points
 – Growth (25 points) – Achievement Gap Reduction (25 points) Elementary/Middle School Total = 75 points – Graduation (25 points) **High School only High School Total = 100 points")
5
Focus Rating 2 Categories – Focused Proficiency (25 points) – Achievement Gap Reduction (25 points)
 – Achievement Gap Reduction (25 points)")
6
How MDE Identifies Schools

7
NEW RATING SYSTEM Reward – highest-performing 15% of Title I schools in the state / MMR (yearly) Celebration – roughly defined as the next 10% (yearly) Continuous Improvement – Roughly defined as the bottom 25% AND not Focus or Priority; plan similar to AYP but with more flexibility and completed at the district level without MDE support; plan does not need to be submitted to MDE but needs to be available at the request of MDE (yearly) Focus – 10% of Title I schools making the biggest contribution to the state’s achievement gap and high schools with graduation rates of less than 60% / lowest FR or grad rate (every 3 years) Priority – 5 % most-persistently low-performing schools in the state / SIG or lowest MMR (every 3 years)
 Celebration – roughly defined as the next 10% (yearly) Continuous Improvement – Roughly defined as the bottom 25% AND not Focus or Priority; plan similar to AYP but with more flexibility and completed at the district level without MDE support; plan does not need to be submitted to MDE but needs to be available at the request of MDE (yearly) Focus – 10% of Title I schools making the biggest contribution to the state’s achievement gap and high schools with graduation rates of less than 60% / lowest FR or grad rate (every 3 years) Priority – 5 % most-persistently low-performing schools in the state / SIG or lowest MMR (every 3 years)")
8
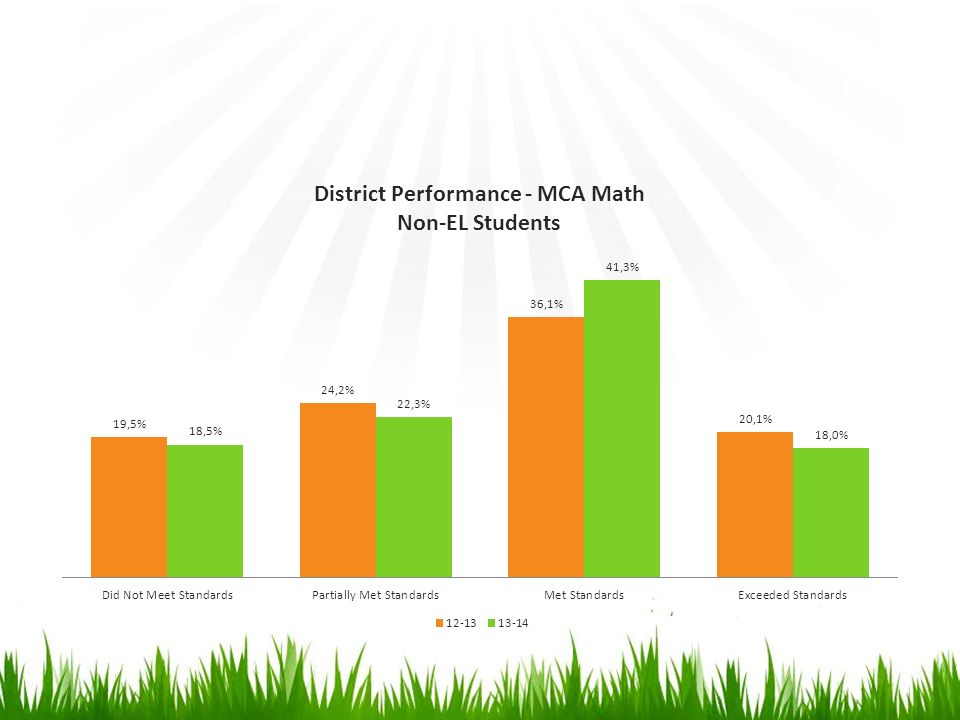
Calculations of Each Group Proficiency – Measure of students that are proficient on standardized assessments – Based on weighted subgroups – Based on existing AYP marks Growth – Average of standardized growth obtained from same test year to year Achievement Gap Reduction – Difference in growth scores for targeted subgroups with statewide average growth of non-targeted subgroups Graduation – Uses existing AYP marks to determine what subgroups are meeting graduation targets

9
Achievement Gap Reduction Calculations The comparisons use the following: – Indian average compared to statewide White average – Asian average compared to statewide White average – Hispanic average compared to statewide White average – Black average compared to statewide White average – LEP average compared to statewide non-LEP average – Special Education average compared to statewide non-Special Education average – FRP average compared to statewide non-FRP average

12
Score Breakdown ProficiencyGrowth Achievement Gap ReductionGraduationTotal Faribault High School15.3520.2620.662581.27 Faribault Middle School08.987.3921.83 Jefferson Elementary4.76.959.8328.63 Lincoln Elementary13.159.888.7442.35 Roosevelt Elementary3.2313.6213.5540.55

13
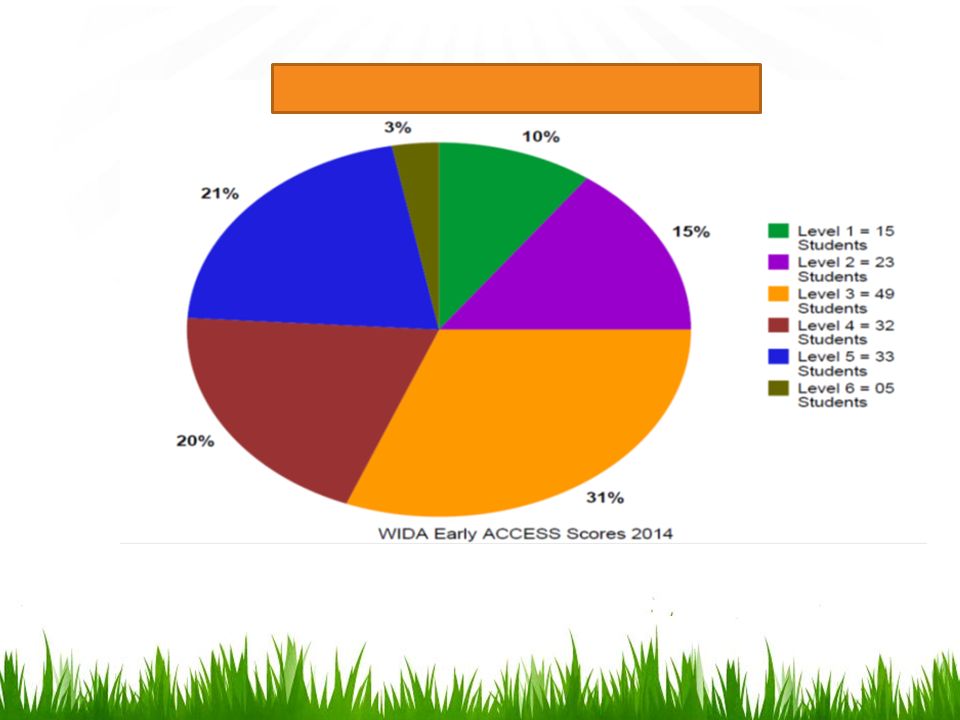
FAQ on EL Results 1)Why are EL scores so low? A = EL students by definition are not proficient….. in language. 2) How can we improve our EL scores if they are not proficient by definition? A = The state counts EL students who have reached proficiency and exited service for an additional 2 years. 3) What data can help me determine language proficiency? A = Use the WIDA ACCESS data. This will tell you students language proficiency level. EL Teachers at your school will have more in depth knowledge about your students language ability and acculturation history. 4) How do I move students towards proficiency? A = Move level 4 students to level 5. ***This does not mean forget about your lower level students.
 How can we improve our EL scores if they are not proficient by definition. A = The state counts EL students who have reached proficiency and exited service for an additional 2 years. 3) What data can help me determine language proficiency. A = Use the WIDA ACCESS data. This will tell you students language proficiency level. EL Teachers at your school will have more in depth knowledge about your students language ability and acculturation history. 4) How do I move students towards proficiency. A = Move level 4 students to level 5. ***This does not mean forget about your lower level students..")
15
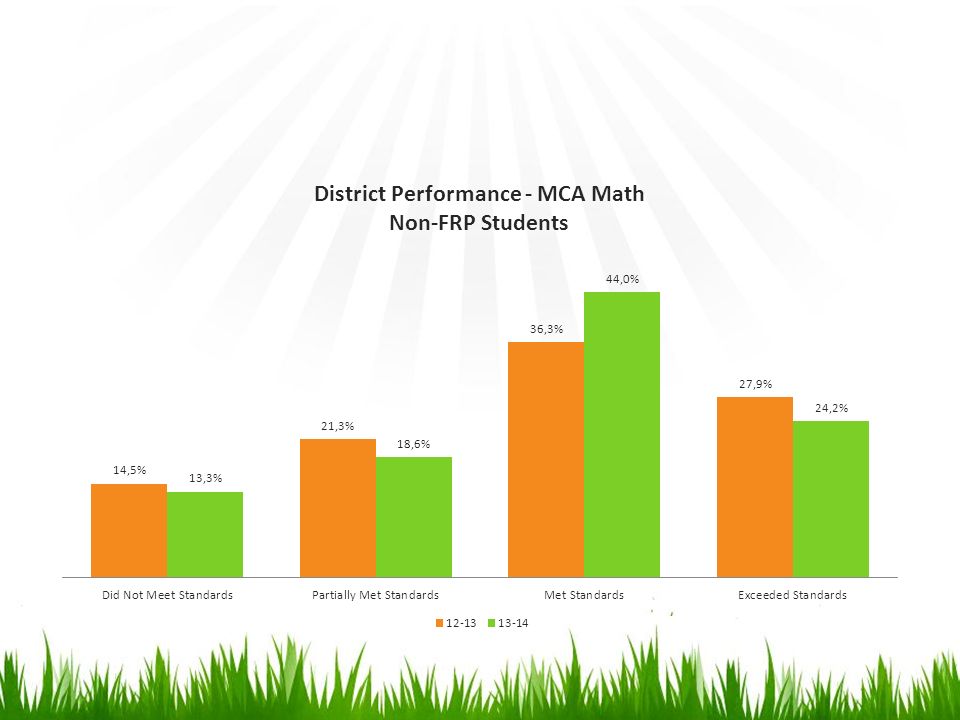
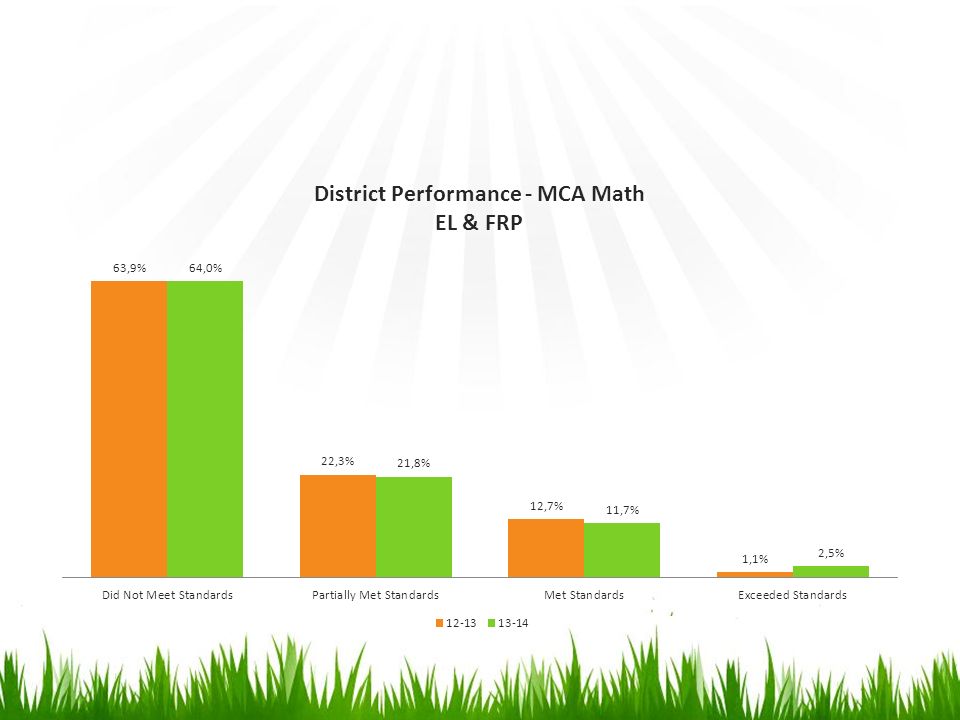
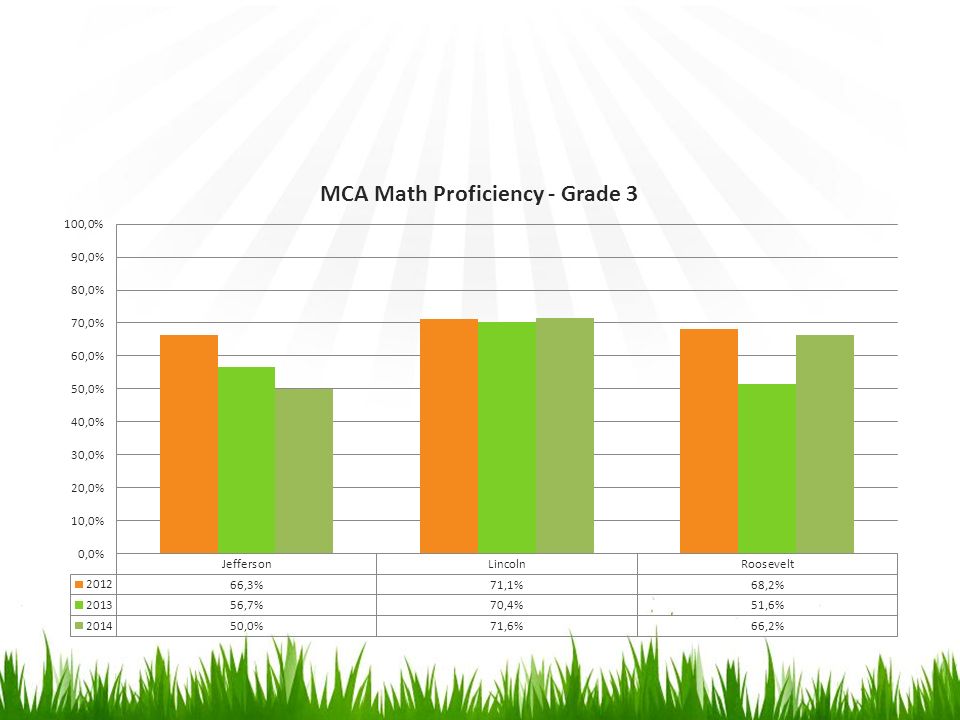
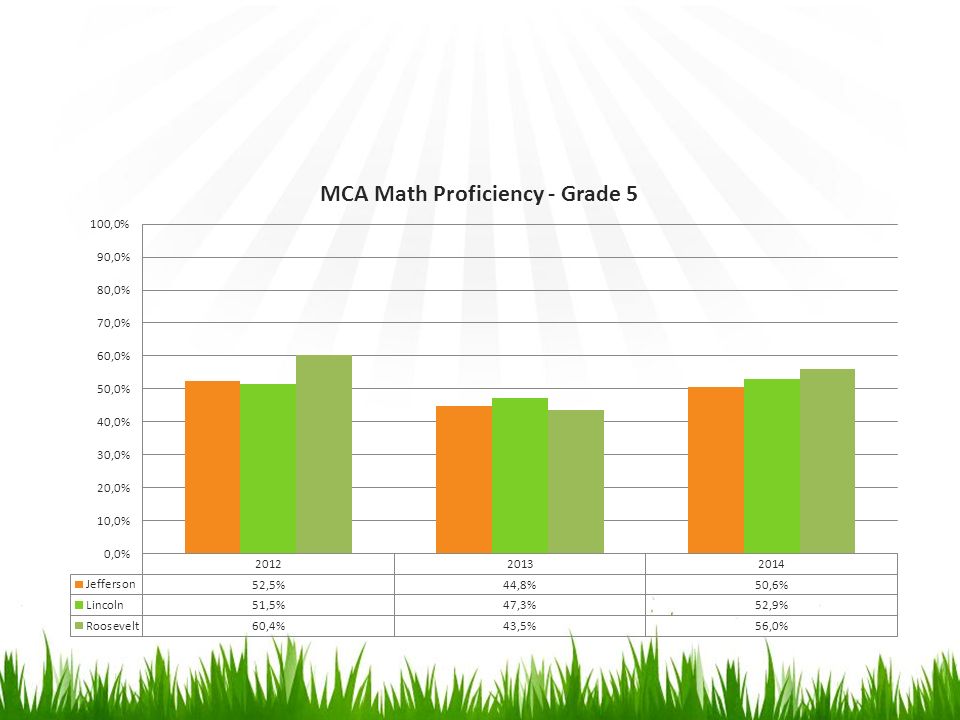
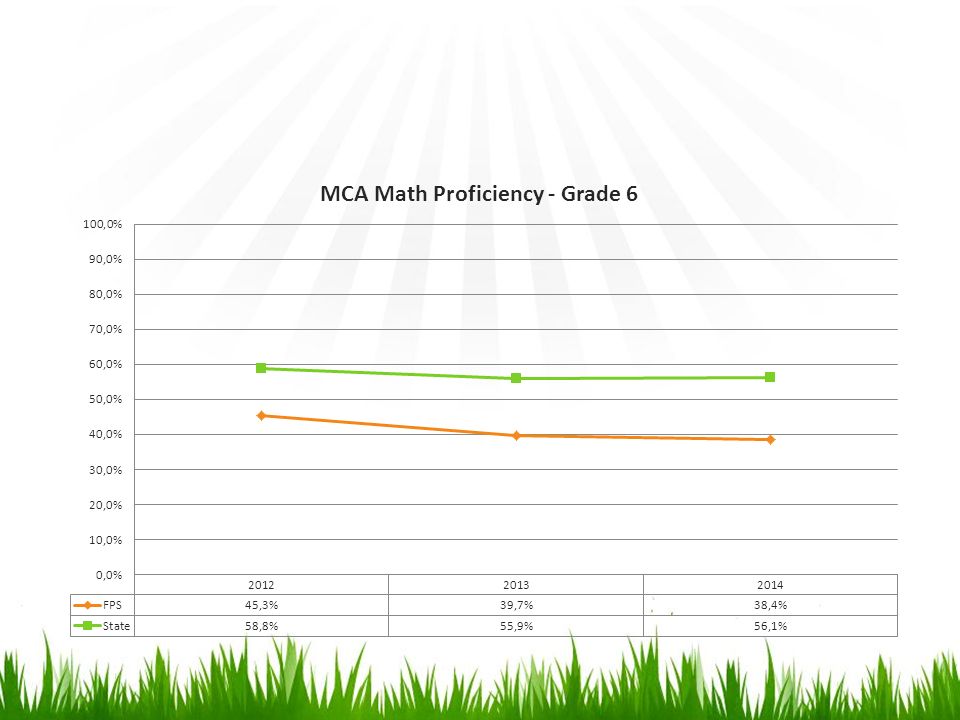
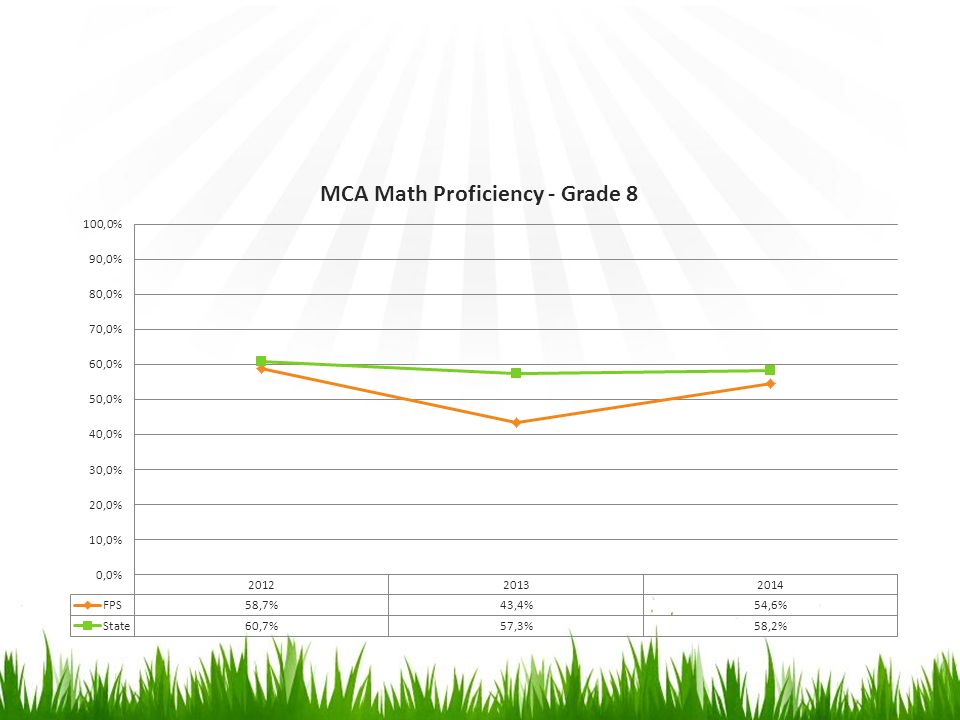
MATH

35
Middle School Proficiency Levels

36
***Unofficial

37
Strand Data **Strand data is a percentage of points earned, not proficiency Algebra StrandGeometry Strand Data Analysis & Probability Strand Grade 1154.1%55.4%54.7%

38
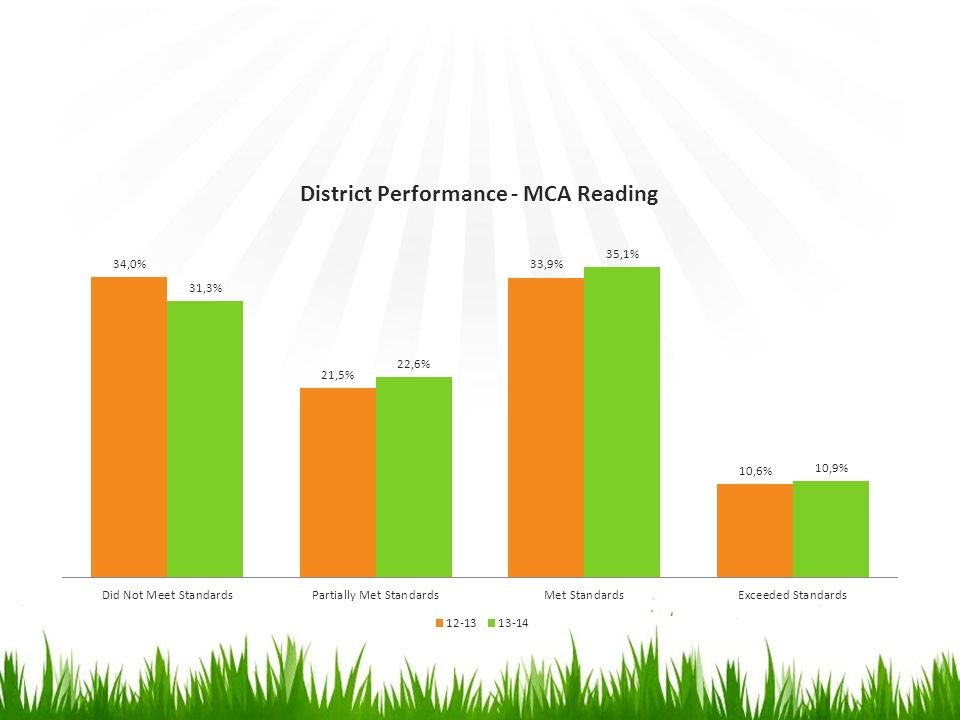
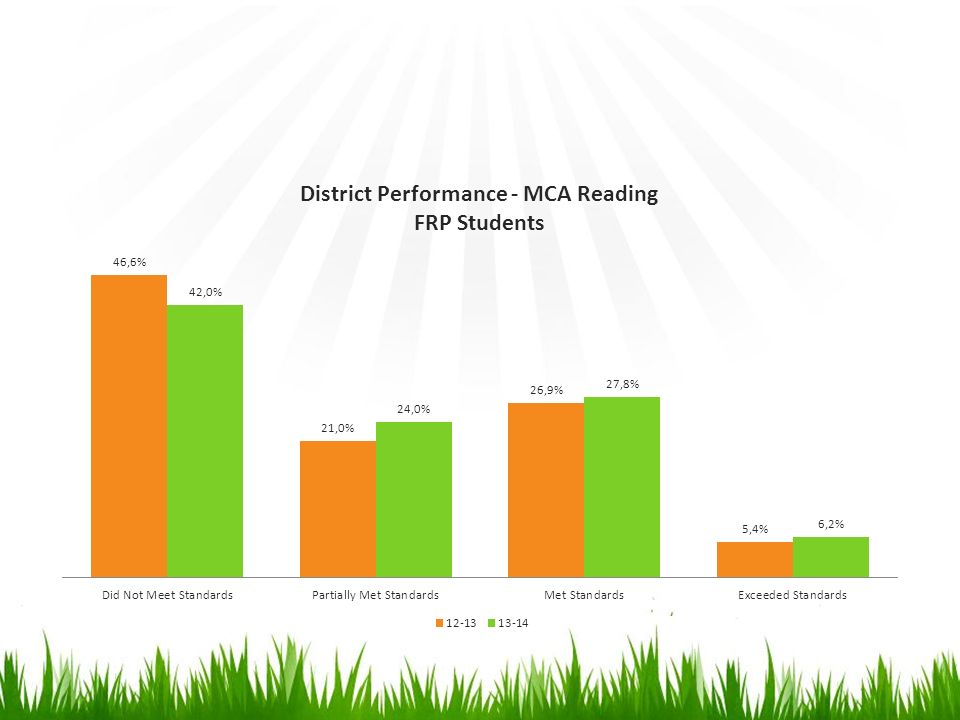
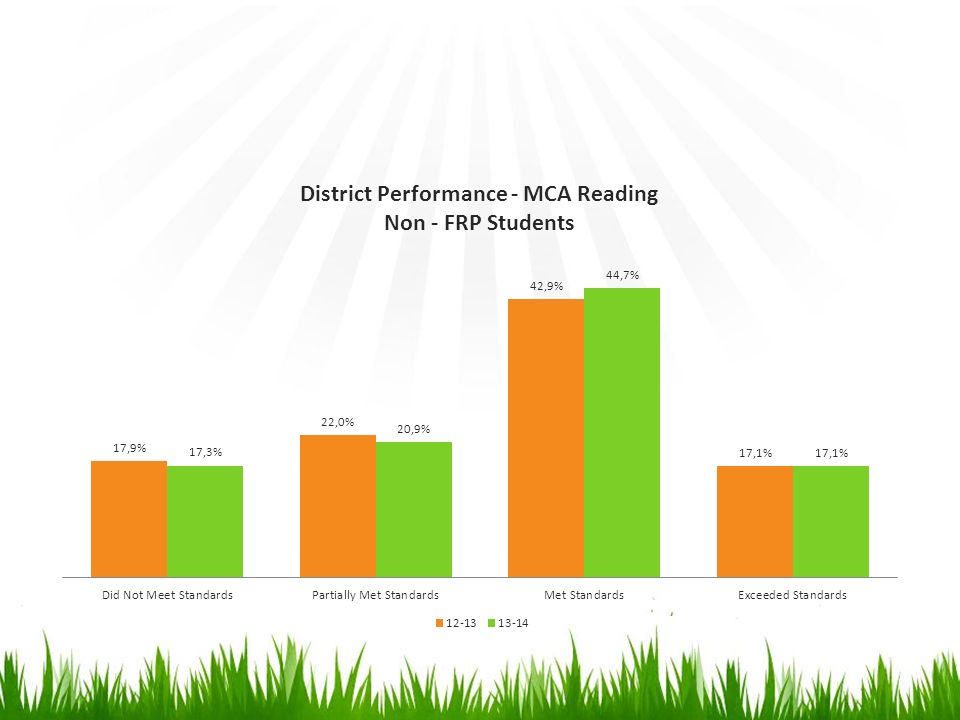
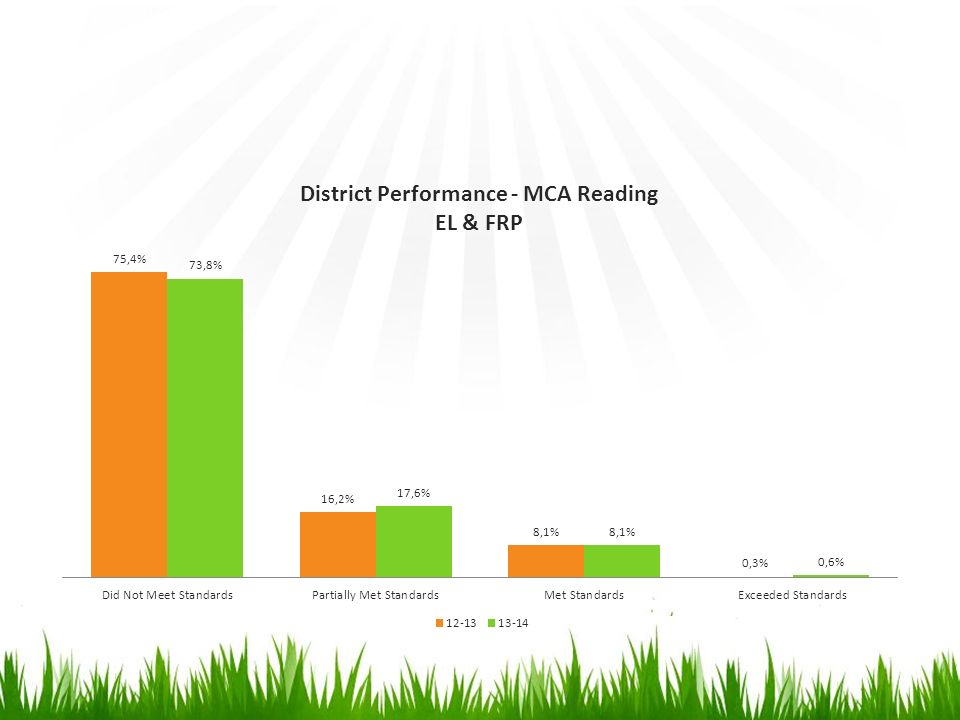
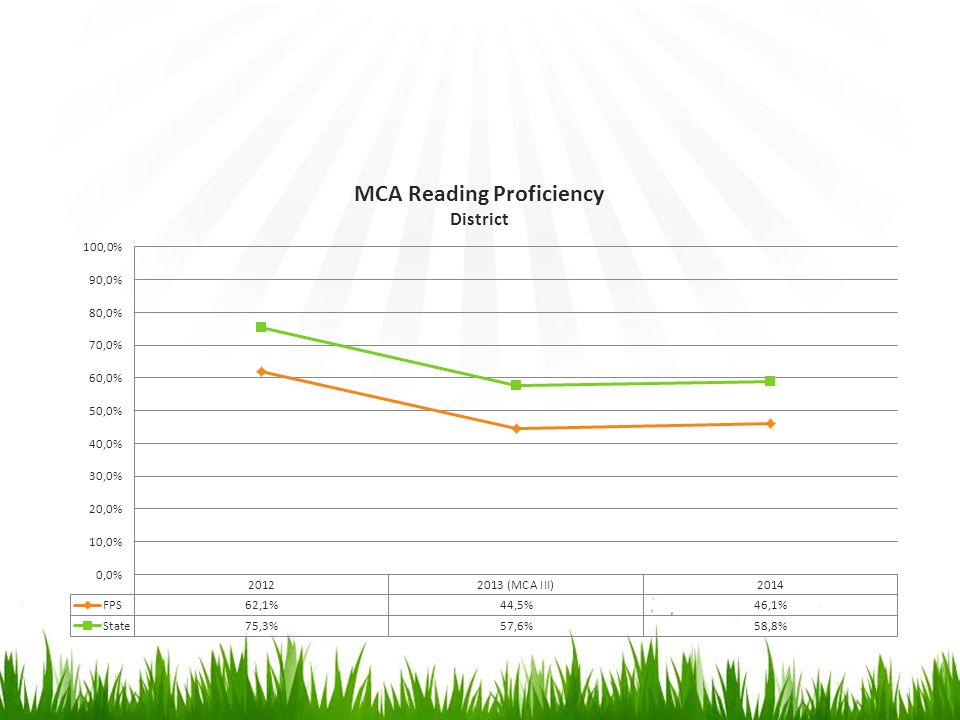
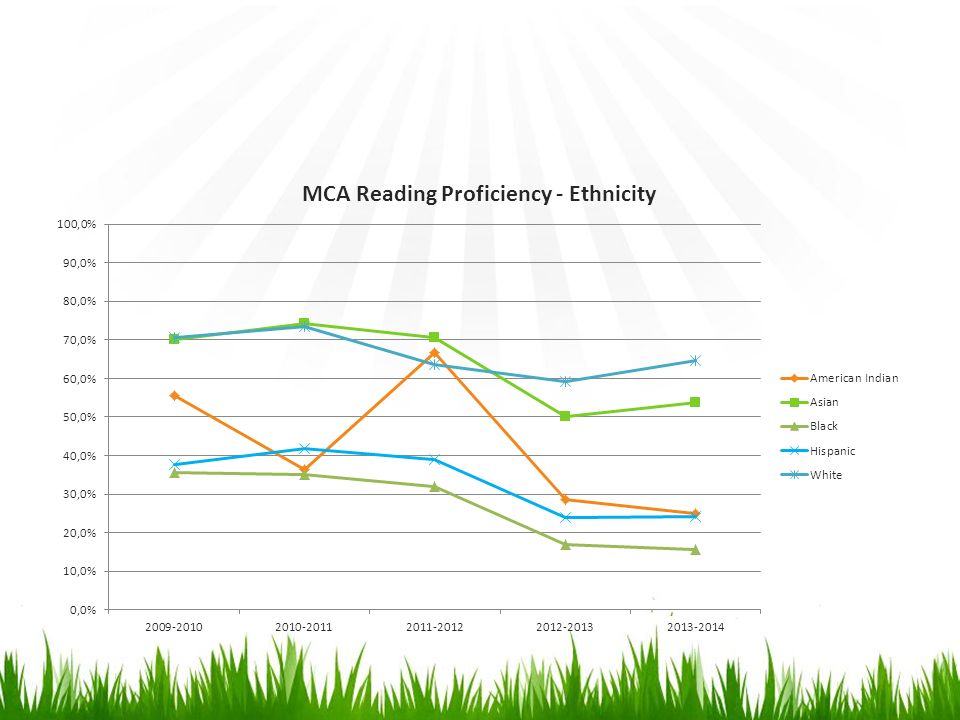
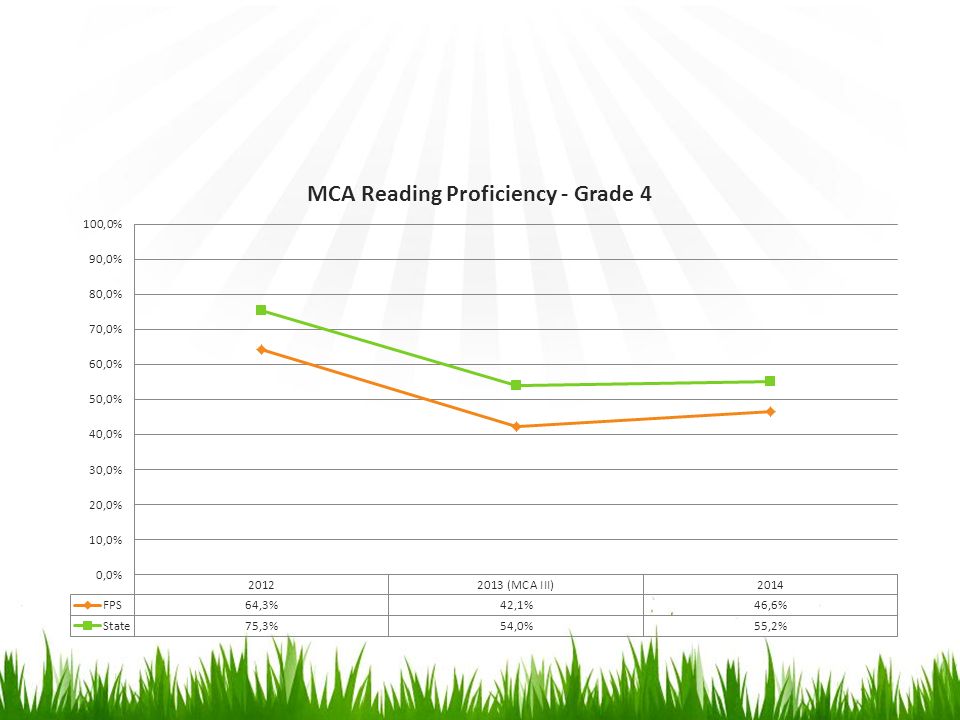
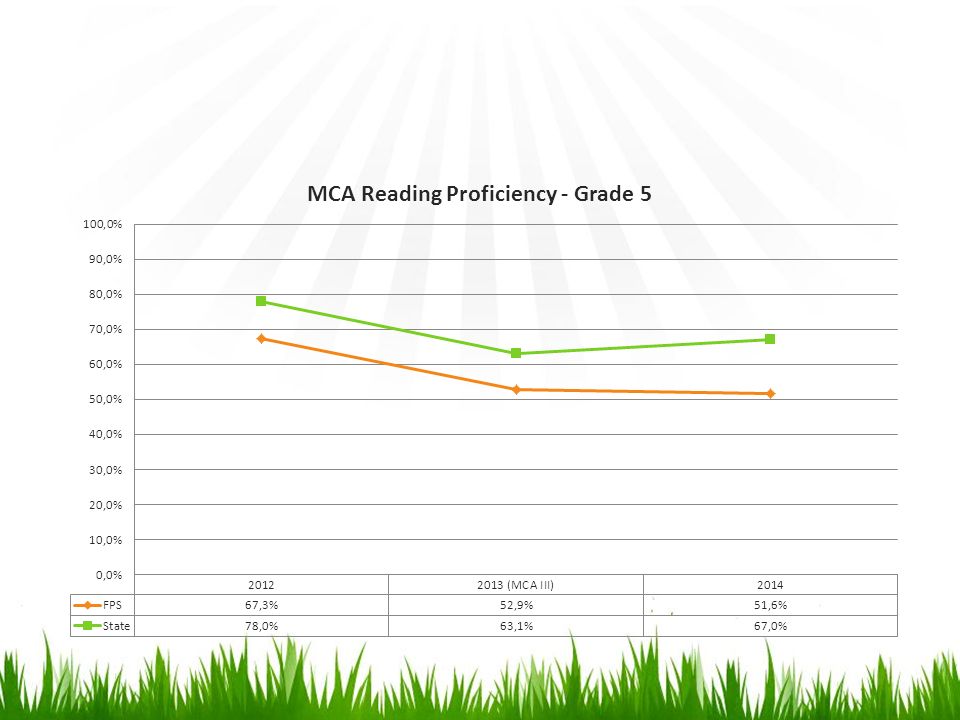
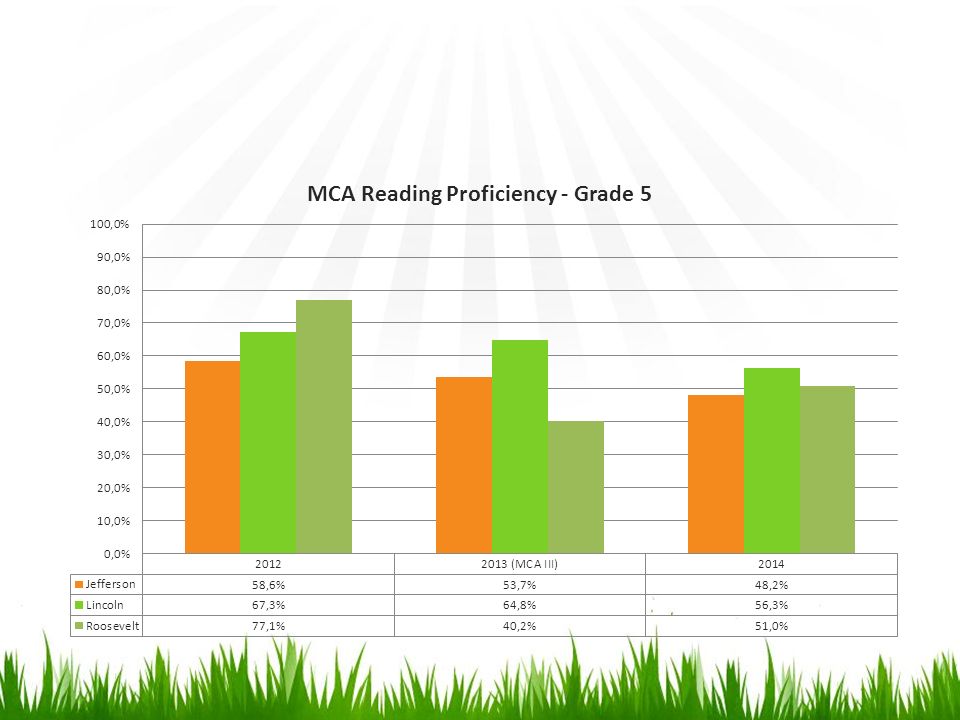
READING

59
Middle School Proficiency Levels

61
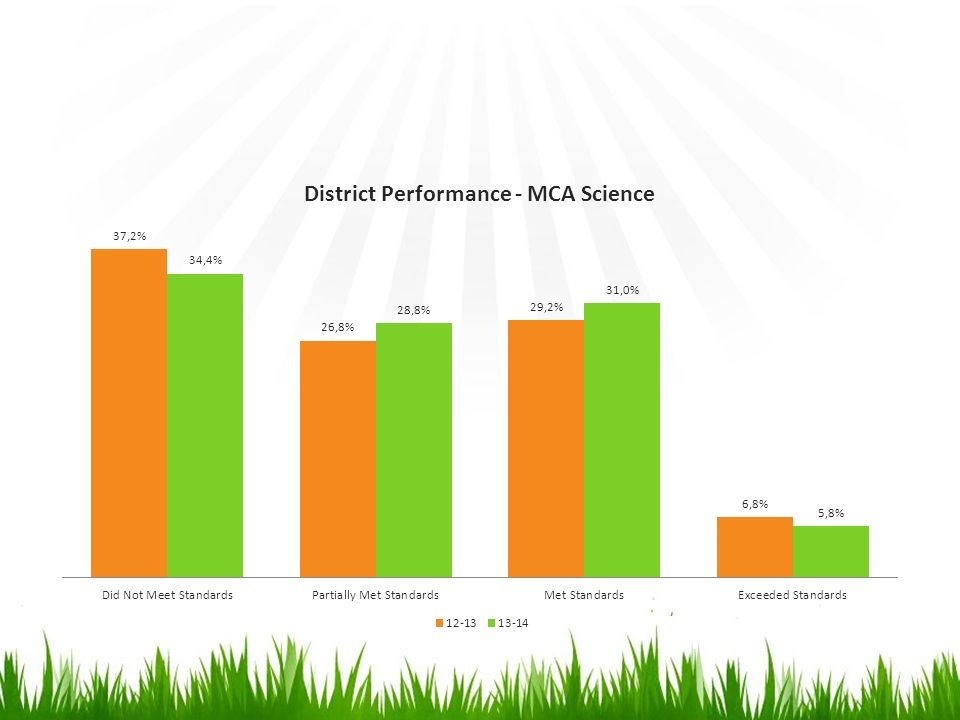
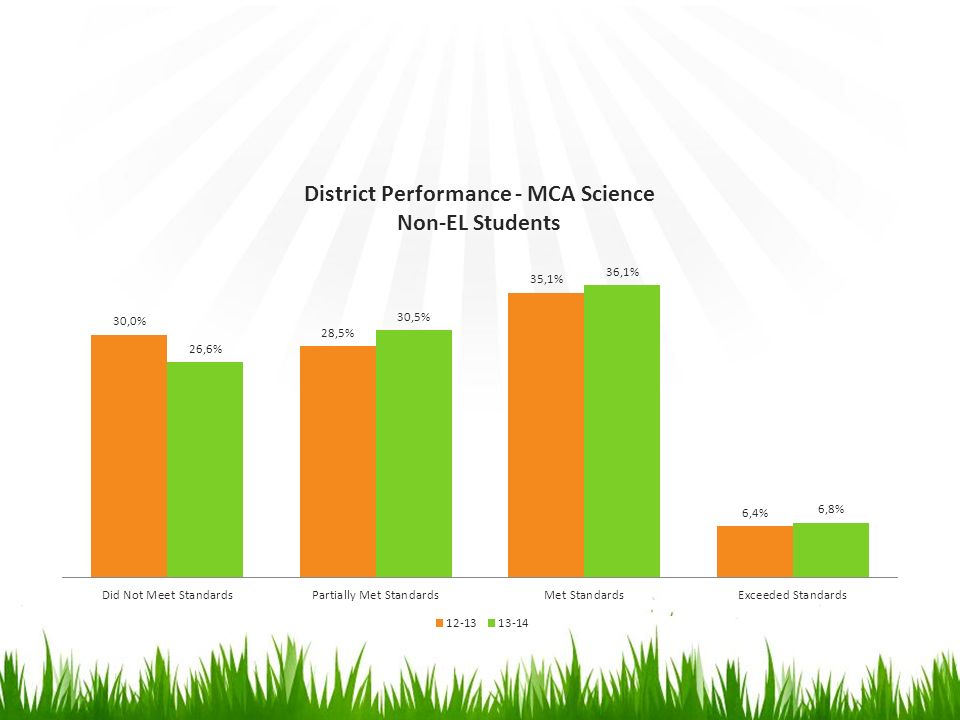
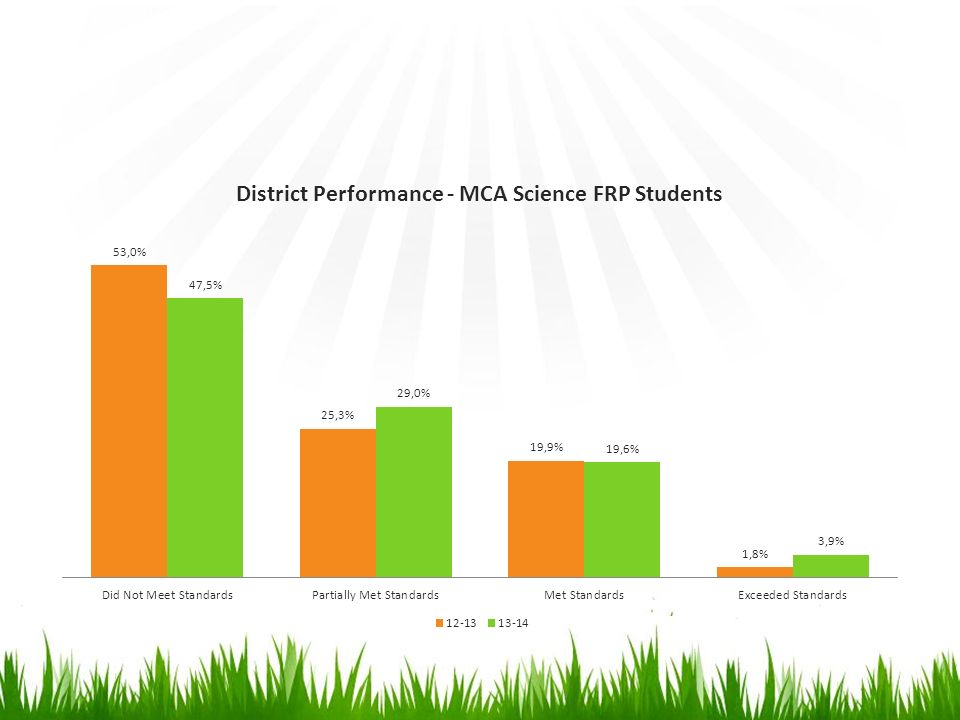
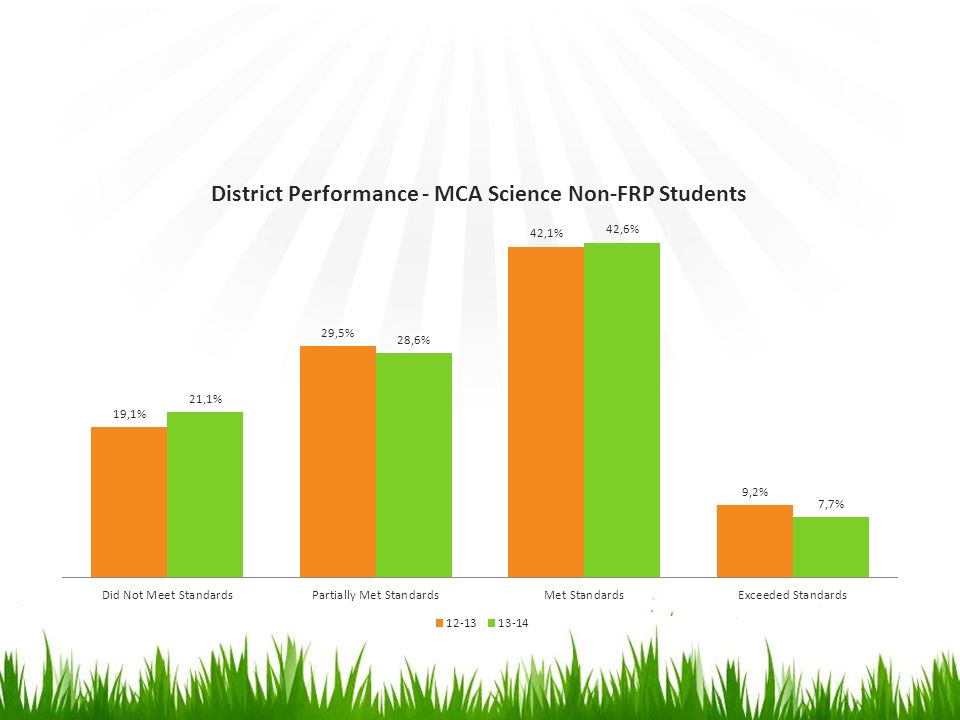
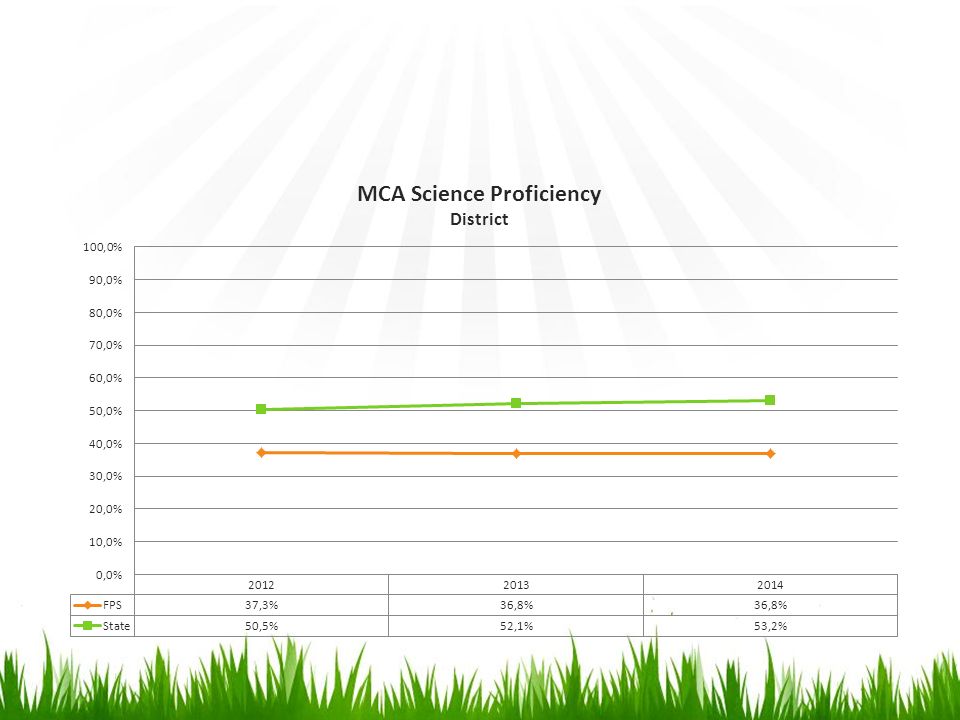
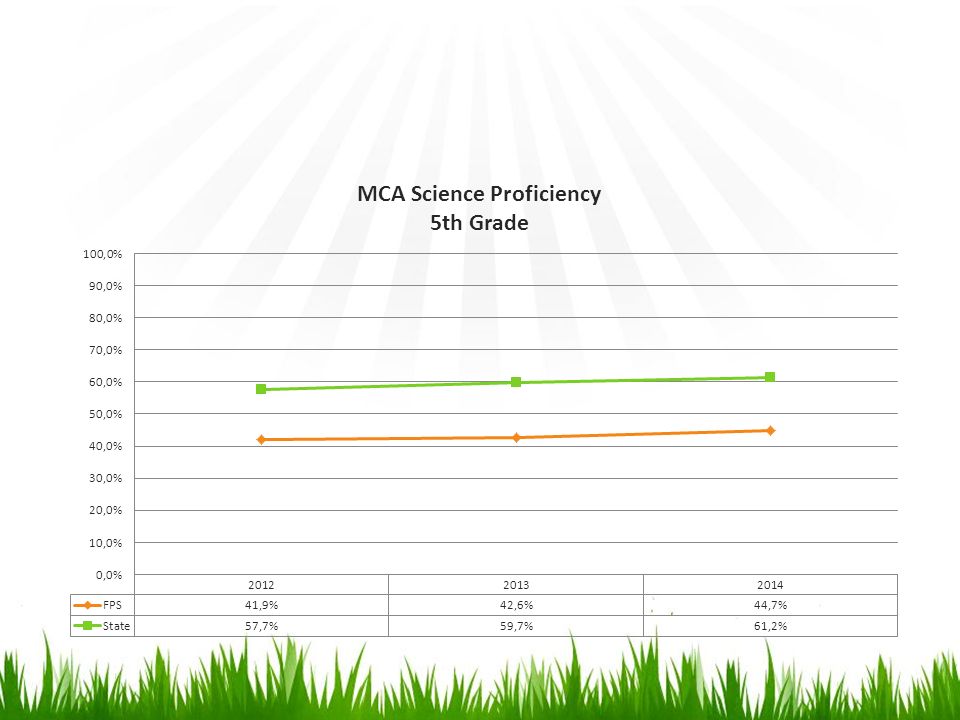
SCIENCE

73
Analyzing Proficiency Observe data patterns What are your data findings? What are you noticing as you dig through your building’s data? How does that compare to the district and state data? Write your findings on the flip chart. 73

74
Digging Deeper into your Strand Data Observe and discuss the data patterns you see, noting comparisons. Document strong and weak strands and achievement gaps on the flip chart.

75
Analyzing Proficiency Pose Hypotheses of Practice (HOPS) Explore and record on the flip chart possible explanations for your building’s strength and weakness. 75

76
Classroom Connections Suggest strategies that might improve these results. 76

77
Articulating the Vision What is it about this concern that we hope to change? Specify the Concern What subject area? Which grade levels? Which specific skills? Assessed how? 77

78
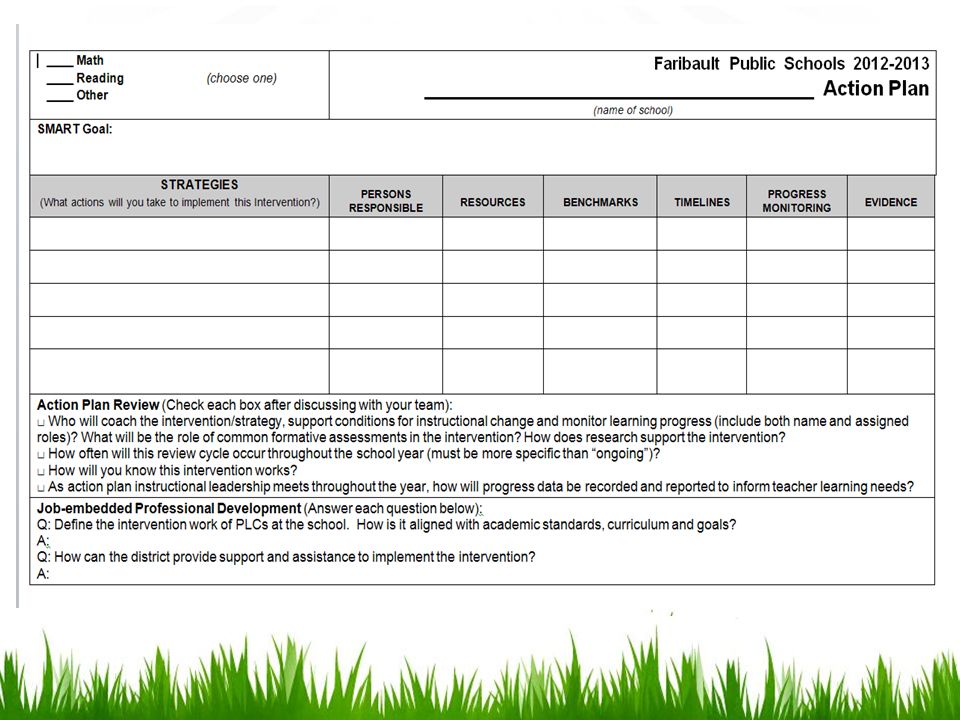
SMART GOAL S – Specific – What do you want to measure? M – Measurable – How will the goal be measured? A – Attainable – Is it a reachable goal? R – Results-oriented – How will the goal look when it is reached? T – Time-Bound – What is the timeline for reaching the goal?

79
SMART Goal By June 2014, 75% of free and reduced students will demonstrate proficiency in reading on the MCA Reading Assessment.

80
80 Crafting the Goal Use the template to craft the goal as a team. (specific skills) (subgroups or grade levels of students) (percent of students) proficiency MCA II Spring, 2011 Staff who will do the work Commitment We will of so that will demonstrate as measured by by
 (subgroups or grade levels of students) (percent of students) proficiency MCA II Spring, 2011 Staff who will do the work Commitment We will of so that will demonstrate as measured by by.")
81
Sample SMART Reading Goal We, the teaching staff at Johnson Middle School will improve students’ skills in vocabulary and comprehension in all content areas for all 6 th, 7 th and 8 th grade students so that 85% show proficiency or above, while accelerating the performance of special education students so that 65% show proficient levels on the MCA II reading assessments given in May, 2013. 81

84
THE END

Similar presentations


 UPDATE October 29, 2013.>")
 Spring 2009 California Standards Test.>")


 Michigan Department of Education Office of Psychometrics, Accountability, Research, & Evaluation Summer.>")

