Download presentation
Presentation is loading. Please wait.

1
The Analysis of Convective Storms

2
Thermodynamic Diagrams There are three desirable characteristics of atmospheric thermodynamic diagrams: The area enclosed by any cyclic process should be proportional to energy or work. The more straight lines the better. The angle between isotherms and dry adiabats should be as large as possible.

3
Emagram—Abscissa is T, ordinate is proportional to ln p. (From energy/mass). Tephigram—Abscissa is T, ordinate is logarithm of potential temperature, sometimes diagram is rotated (From T-phi) Stuve—Abscissa is T, ordinate is Area is not proportional to energy. Skew T-ln p—Similar to emagram, but temperature lines are skewed to increase the angle with dry adiabats.
. Tephigram—Abscissa is T, ordinate is logarithm of potential temperature, sometimes diagram is rotated (From T-phi) Stuve—Abscissa is T, ordinate is Area is not proportional to energy. Skew T-ln p—Similar to emagram, but temperature lines are skewed to increase the angle with dry adiabats..")
4
Convection Parameters Lifted Condensation Level (LCL) – level at which a parcel lifted from the surface will saturate Convective Condensation Level (CCL) – level at which a parcel from the surface heating to its convective temperature will saturate Convective Temperature – the temperature that the surface layer would need to be heated to to convect
 – level at which a parcel lifted from the surface will saturate Convective Condensation Level (CCL) – level at which a parcel from the surface heating to its convective temperature will saturate Convective Temperature – the temperature that the surface layer would need to be heated to to convect")
5
Convection Parameters (cont.) Level of Free Convection (LFC) – level at which a lifted parcel becomes warmer than its surroundings, and hence buoyant. Equilibrium Level (EL) – level at which a previously buoyant parcel’s temperature again equals the environmental temperature. This is an approximate height for thunderstorm anvils.
 – level at which a previously buoyant parcel’s temperature again equals the environmental temperature. This is an approximate height for thunderstorm anvils..")
6
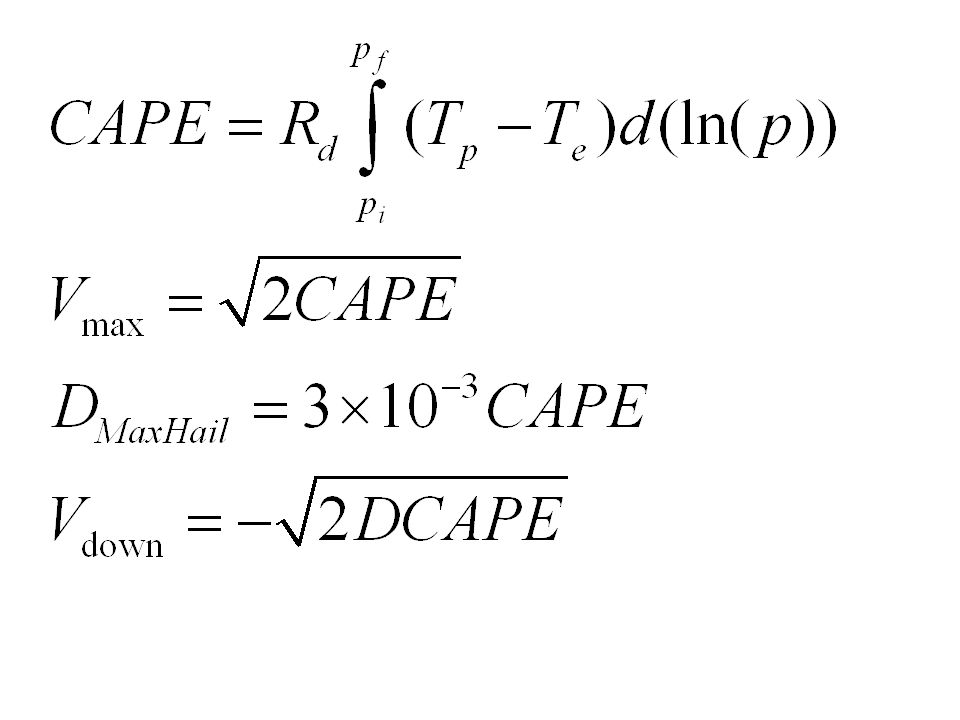
Convection Parameter (cont.) Convective Inhibition (CIN) – the “negative” energy area below a parcel’s level of free convection. Convective Available Potential Energy (CAPE) – The “positive” energy area where a parcel is accelerating upward. Downdraft Convective Available Potential Energy (DCAPE) – The negative energy area where a parcel can be accelerated downward evaporative cooling.
 – The positive energy area where a parcel is accelerating upward. Downdraft Convective Available Potential Energy (DCAPE) – The negative energy area where a parcel can be accelerated downward evaporative cooling..")
8
Stability Parameters All indices are useful diagnostics but should not be used blindly Lifted index (LI) Showalter index (SI) Total totals (TT) Severe Weather Threat Index (SWEAT) Bulk Richardson Number Storm Relative Helicity
 Showalter index (SI) Total totals (TT) Severe Weather Threat Index (SWEAT) Bulk Richardson Number Storm Relative Helicity")
9
Miller Type I “loaded gun sounding”

10
Firing gun sounding?

11
Miller Type IV “Inverted V sounding

12
Miller Type II (tropical sounding)
")
13
Miller Type III Sounding

14
Thunderstorm Types Single cell (pulse)—can be strong, but no severe Multicell—can be severe, but don’t generate strong tornadoes Supercell—rotating updraft, most severe storms
—can be strong, but no severe Multicell—can be severe, but don’t generate strong tornadoes Supercell—rotating updraft, most severe storms")
15
Single Cell Thunderstorm

16
Multicell Thunderstorm

18
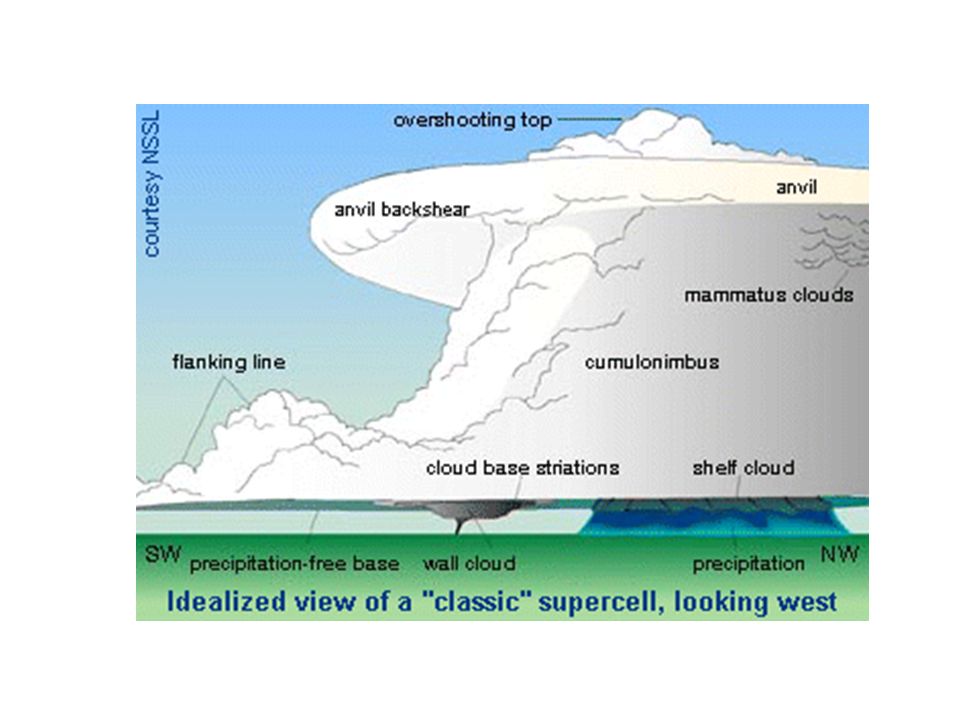
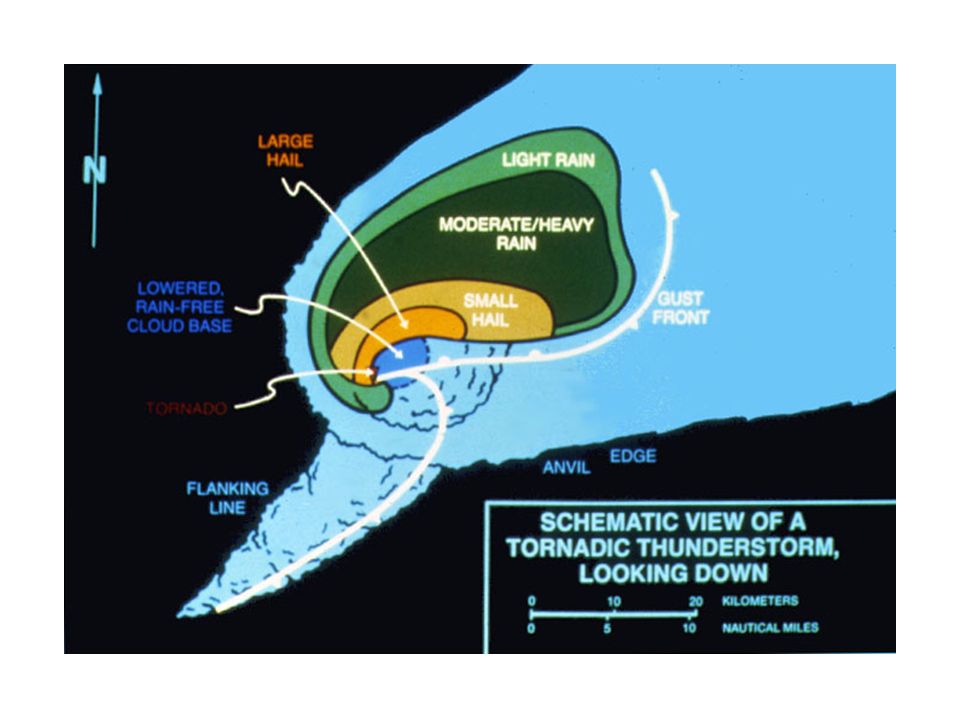
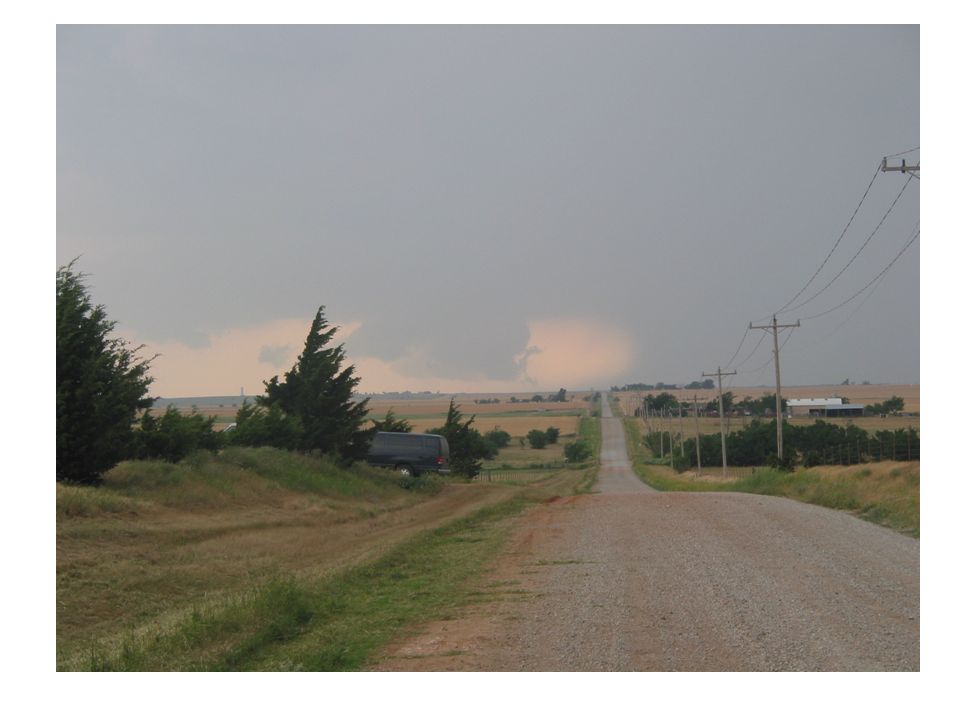
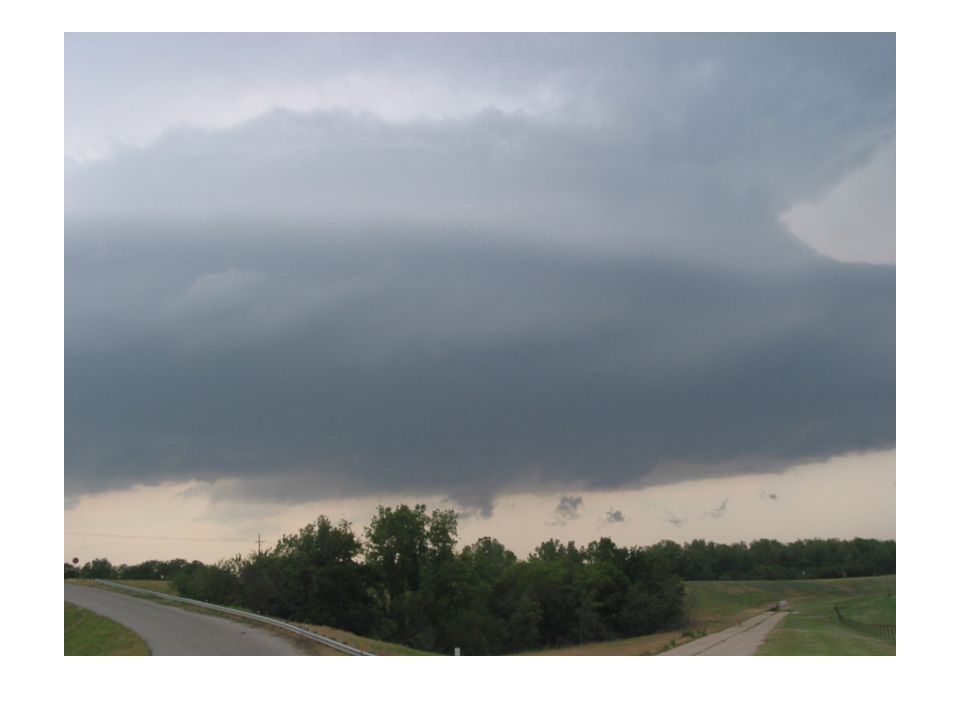
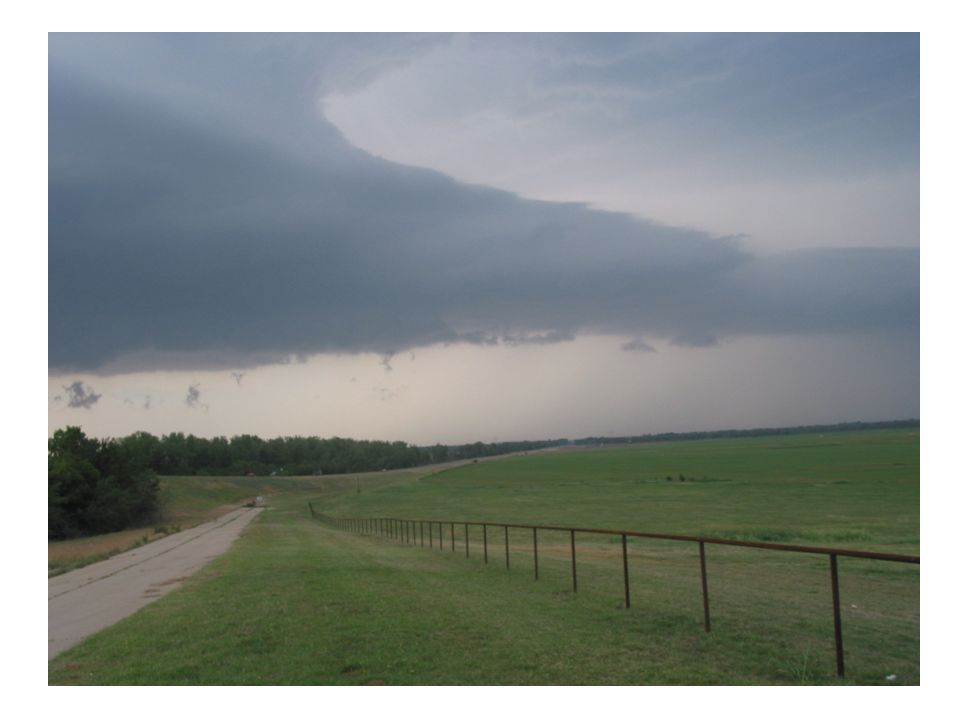
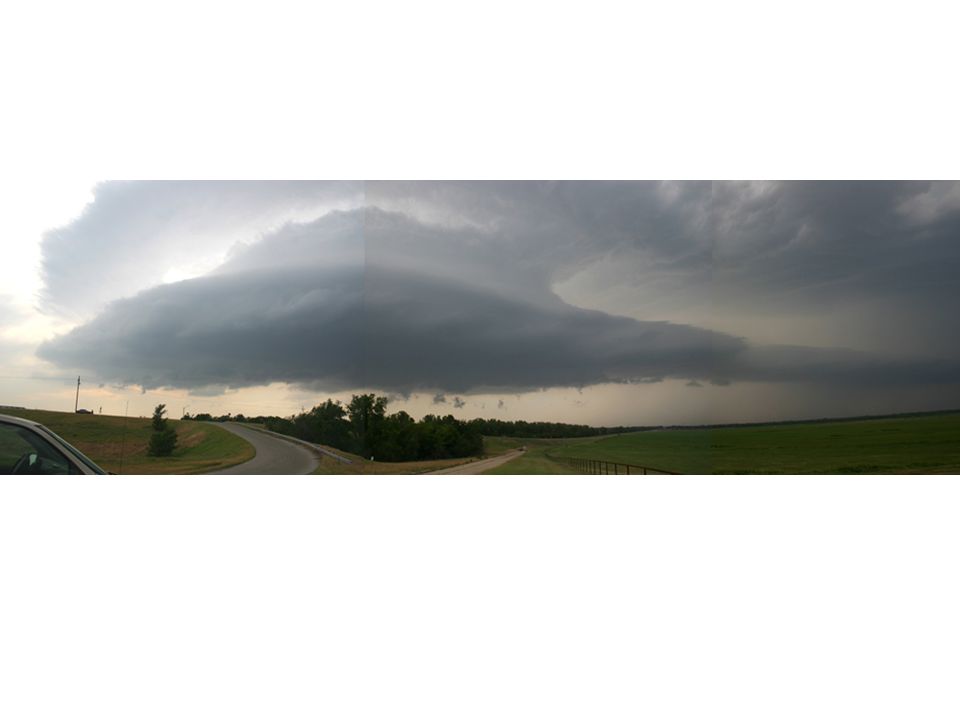
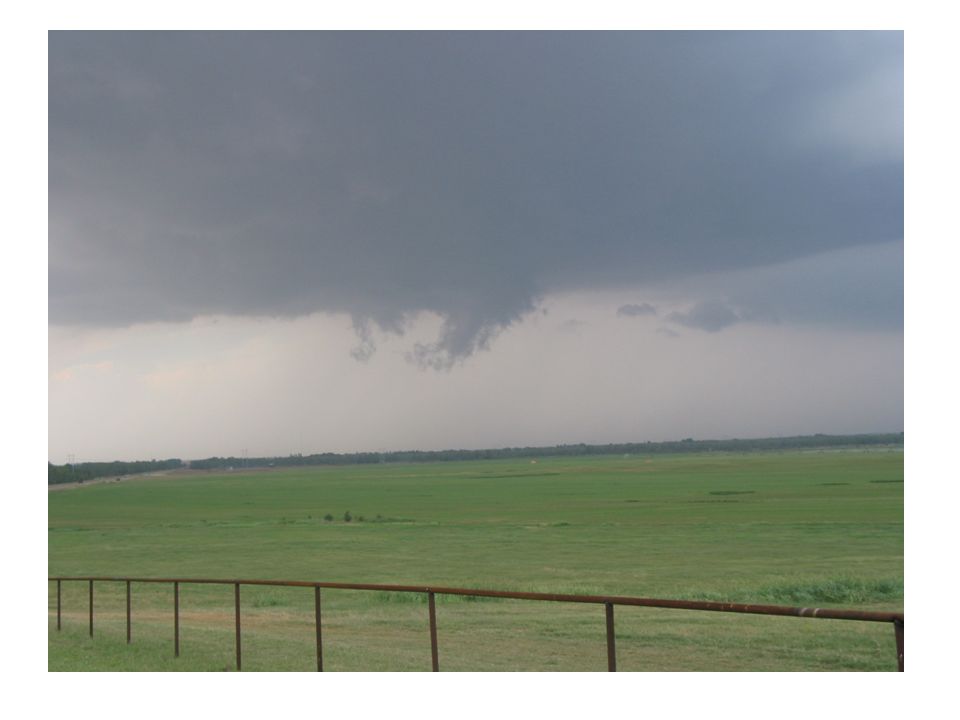
Supercell Thunderstorm

20
Conversion of Horizontal Vorticity to Vertical Vorticity

21
Storm Splitting

23
Tornado probability from Storm Prediction Center

24
Early afternoon satellite photo

25
Late afternoon satellite photo

Similar presentations

 Jones SWFDP Training Workshop on Severe Weather Forecasting Bujumbura, Burundi, Nov 11-16, 2013.>")


>")


