Download presentation
Presentation is loading. Please wait.

1
Preliminary Applications of the HL-RDHM within the Colorado Basin River Forecast Center Ed Clark, Hydrologist Presented July 26 th, 2007 as part of the WR Field Hydrology Seminar Series

2
NWS Distributed Model(s) RDHM: Research Distributed Hydrologic Model Object oriented with SAC-SMA, Snow17, API, Frozen Ground, Channel Shape, and Routing Curve sub-routines DHM: NWSRFS Operation Requires RDHM to setup parameter grids. Limited to SAC-SMA model and routing via the connectivity file. Delivered to the RFC’s in build 8.2. Output: Grids -- Any parameters states Time Series: Basin Average (any parameter) and Outlet Discharge. Output: Discharge time-series for display within NWSRFS
 and Outlet Discharge. Output: Discharge time-series for display within NWSRFS.")
3
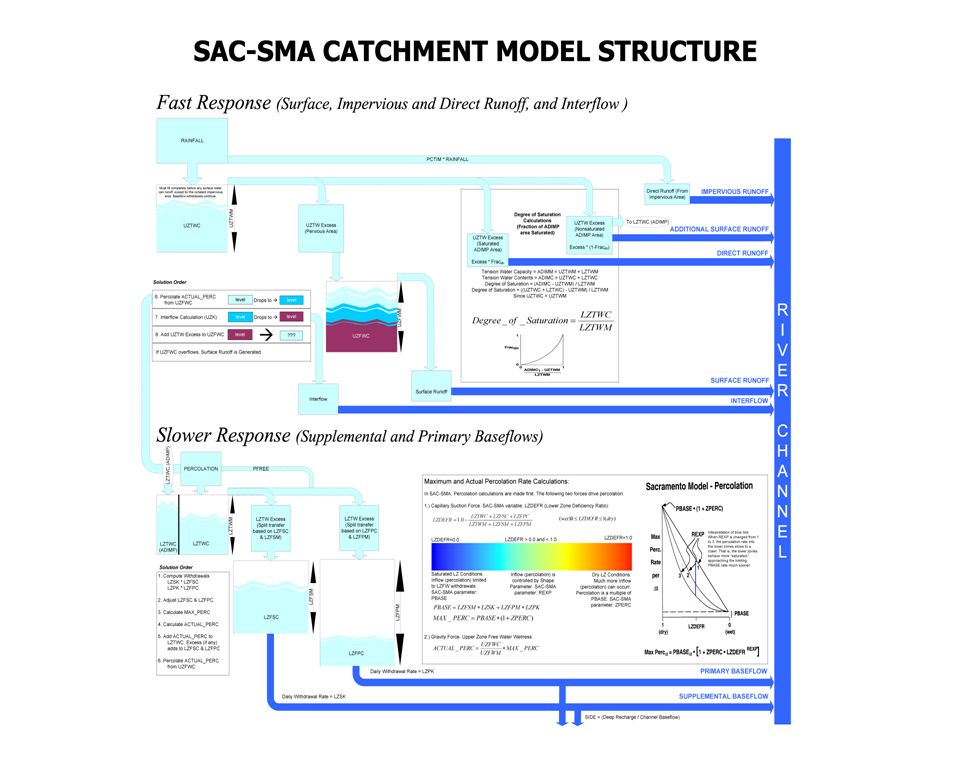
Model Structure Divides the basin of interest into ~4 km 2 grids. (HRAP) Requires gridded Surface Temperature and Precipitation (xmrg’s from MPE). Runs modules the existing models Snow17, Sacramento Soil Moisture Accounting Model (SAC-SMA) to generate runoff. Runoff is routed by solving the Kinematic Wave Equations.
 Requires gridded Surface Temperature and Precipitation (xmrg’s from MPE). Runs modules the existing models Snow17, Sacramento Soil Moisture Accounting Model (SAC-SMA) to generate runoff. Runoff is routed by solving the Kinematic Wave Equations..")
5
Model Concept : The HL-RDHM is an object oriented modeling system consisting of Snow Melt, Rainfall Runoff, Frozen Ground models and routing methods. Individual modules are called from within the RDHM architecture. Invoking any of the modules allows their parameters and states to be access by other modules from the three dimensional array or PixGraph. Snow17 Runoff SAC-SMA Water content in Soil tanks, ET Rain +melt Kinematic Wave Routing Discharge Hydrograph Snow Pack Water Contents at Depth FRZ (Sac-HT) Surface and subsurface flow
 Surface and subsurface flow.")
6
Evapotranspiration Mean Monthly PE and PE_adj grids. Mean Daily PE grids derived from point data and: PE_adj grids derived from Green Vegetation Fraction (NCEP global data set) and derived through the an empirical relationship with the calibration process.
 and derived through the an empirical relationship with the calibration process..")
7
Channel and Hill-slope routing Real HRAP Cell Hillslope model Cell-to-cell channel routing From Yu Zhang, OHD

8
Control and Calibration Input card is passed to the model. Defines location of data, simulation period, and calibration parameters. Parameters grids can be calibrated by multiplying the by a scalar. >1 <1 Gridded Parameter

9
Model Parameterization Snow17 MFMax and MFMin based on DEM analysis, provided by OHD. SAC-SMA grids provided by OHD and based on STATSGO data. Routing grids are generated from USGS field measurements by defining a relationship between channel shape and discharge. Other grids written out from the calibrated lumped model.

10
Evolution to a Fully Distributed Model Lumped Model. Extensively calibrated for the CBRFC with a great deal of forecaster skill. Lumped parameter values distributed by elevation zone. Used to check the mechanics of the model, and increase forecast skill with high intensity, convective events. Fully Distributed. Parameters based on Statsgo data, calibrated by applying a scalar multiplier, High Spatial Variability past Future Sac_LZTWM

11
Application/Demonstration Basins Comparison w/ RTi SNOWDAS. Gridded Snow17 Investigation Demonstration of gridded soil moisture “norms” and QPE driven small basin hydrograph. [Verde, Santa Cruz and San Pedro basins.]

12
Rapid surface-runoff and near surface soil moisture Does spatially distributing convective precipitation help improve our ability to simulate hydrographs in arid portions of the Southwest? Can the gridded Sac-SMA model be used to qualify the current conditions of near- surface soil moisture?

13
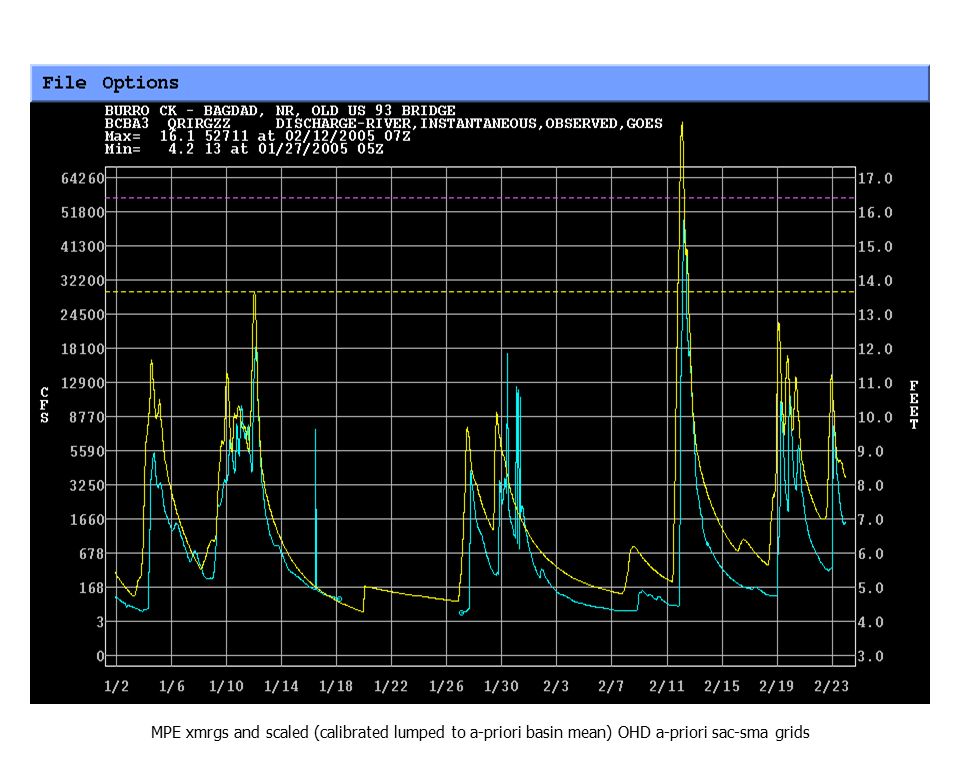
QPE driven small basin hydrograph – flash flooding quantification. MPE xmrgs and scaled (calibrated lumped to a-priori basin mean) OHD a-priori sac-sma grids
 OHD a-priori sac-sma grids.")
15
Normalized Soil Moisture Generate mean upper and lower tension water contents from the lumped model calibration. Compare the RDHM output tension water contents to this day’s normal conditions. Asks, where are we today compared to where we are “usually?”

16
April 1st, 2007May 1st, 2007June 1st, 2007July 1st, 2007July 14th, 2007July 21st, 2007 July 28th, 2007August 1st, 2007August 7th, 2007August 14th, 2007 August 20th, 2007 Seasonal Soil Moisture Simulation in the Upper Verde River Upper Zone Percent of Model Mean Lower Zone Percent of Model Mean

17
Soil Moisture Percent of Normal Upper Zone Lower Zone July 1, 2006

18
Soil Moisture Percent of Normal Upper Zone Lower Zone July 25, 2006

19
Prototype Upper Zone Normal Aug 20 th, 2007

20
Prototype Lower Zone Normal Aug 20th, 2007

21
Contents at Depth Utilizes Victor Koren’s Sacramento Heat Transfer (SAC-HT) model. Calculates frozen and liquid contents in a set of computational layers at specified depths. Outputs as outlet time-series or individual grids.

22
Lower Santa Cruz (at Laveen)
")
23
San Pedro At Tombstone

24
Proposed Soil Moisture Probes in the San Pedro near Tombstone and Bobacomari Basins. NOAA’s ESRL has proposed to place 6 sensors within the Bobacomari/San Pedro Tombstone Areas. Strengths: Existing Soil Moisture studies in Walnut Gulch. Bobacomari can be treated as headwater. Will cluster 3 sensors in one HRAP cell to better under stand variability. Other three will be placed on a cross section of the basin.

25
Continued Study Increase the number of calibrated basins. Increase the region over which soil moisture modeling is computed. Work with our customers (WFO’s, regional scientists and land managers) to better publish soil moisture simulations and observations.
 to better publish soil moisture simulations and observations..")
26
Questions? Available at: http://www.cbrfc.noaa.gov/present/present2007.cgi

Similar presentations


>")


 Reggina Cabrera NOAA/National Weather Service Eastern Region>")


 NRCS daily: 80 NRCS statistical: 78 Coordinated: 80 / 195% median.>")

>")