Download presentation
Presentation is loading. Please wait.

1
The CCC “CTE LaunchBoard”: How a Program-Specific Labor Market Information Portal is Redefining the Use of and Demand for Dashboards Kathy Booth & Patrick Perry, WestEd CAIR 2015 Conference

2
CTE LaunchBoard Very collaborative effort: CCC Chancellor’s Office (Workforce Development, Technology, Research, Information Systems) WestEd Cal-PASS + CTE Community (VERITAC) EDD Local Campuses What just got built? Where does it fit? California Community Colleges – Chancellor’s Office | 112 Colleges | 72 Districts | 2.6 Million Students 2

3
Dashboard Topology: Three Types of Dashboards (culled from various BI sources) Strategic dashboards provide executives information about “organizational health” Help identify macro trends and potential opportunities for expansion and improvement. Do not provide all the detailed information needed to make complex decisions, but instead led to opportunities for further analysis. Should be simple and contain aggregate metrics. Typically there is no need for interactive features and the data should not be updated frequently. Examples: CCC Student Success Scorecard, Salary Surfer 3

4
Dashboard Topology: Three Types of Dashboards Operational dashboards are used to monitor real time operations and alert users to deviations from the norm. This often means that operational dashboards need to be updated frequently if not in real time, contain less information than analytical or strategic dashboards, and make it nearly impossible to avoid or misunderstand an alert when something deviates from the acceptable standards. Operational dashboards should provide users with specific alerts and provide them with exactly what information they need to quickly get operations back to normal. Examples: Local Enrollment Management Information 4

5
Dashboard Topology: Three Types of Dashboards Analytical dashboards provide users with the data they need to understand trends and why certain things are happening by making comparisons across time and multiple variables. Analytical dashboards often contain more information and metrics to digest. Since understanding is the goal, analytical dashboards can be more complex than strategic or operations dashboards and require more expertise to understand. Analytical dashboards should facilitate interactions with the data, including viewing the data in increasing detail. Example: Data Mart (query tool), CCC LaunchBoard, CSU Student Success Dashboard 5
, CCC LaunchBoard, CSU Student Success Dashboard 5.")
6
Interactivity Local Interactivity with: Operational Dashboards is HIGH (daily, weekly) as they are local and urgent. Strategic Dashboards can be much lower (annual); high level of aggregation becomes more abstract to the practitioner 6
; high level of aggregation becomes more abstract to the practitioner 6.")
7
2014 Scorecard Survey: Findings [The Scorecard metrics] have been used with other metrics to support the development of the college's strategic plan and other initiatives and grant activities developed to improve student success. I think the Scorecard, and the ARCC report before it, started a conversation and kept it going because of the annual update. The Scorecard is not suitable for strategic planning or evaluation due to its use of the six-year cohort. The metrics do not reflect current student performance. The Scorecard metrics were developed specifically for accountability, and may not be suitable for other purposes such as planning and evaluation. Several respondents considered the Scorecard data to be “historical” that lacked “agility to make changes that affect or benefit current students.” The cohort-based metrics seem particularly inappropriate for planning/evaluation when the student population is changing. Analytic Dashboards: An emerging “mid-layer” tool? 7
![2014 Scorecard Survey: Findings [The Scorecard metrics] have been used with other metrics to support the development of the college s strategic plan and other initiatives and grant activities developed to improve student success.](http://images.slideplayer.com/27/9016981/slides/slide_7.jpg " I think the Scorecard, and the ARCC report before it, started a conversation and kept it going because of the annual update. The Scorecard is not suitable for strategic planning or evaluation due to its use of the six-year cohort. The metrics do not reflect current student performance. The Scorecard metrics were developed specifically for accountability, and may not be suitable for other purposes such as planning and evaluation. Several respondents considered the Scorecard data to be historical that lacked agility to make changes that affect or benefit current students. The cohort-based metrics seem particularly inappropriate for planning/evaluation when the student population is changing. Analytic Dashboards: An emerging mid-layer tool. 7.")
8
LaunchBoard The LaunchBoard provides data to California community colleges and feeder K-12 school districts on the effectiveness of career technical education (CTE) programs. Supported by the California Community College’s Chancellor’s Office (CCCCO) and hosted by Cal-PASS Plus, the Launchboard aggregates program and regional-level data including: Student characteristics, progress, and completion from the CCCCO database Wage data from Employment Development Department Employment outcomes from the CTE Employment Outcomes Survey Labor market information from EMSI Local information such as low-unit certificates and industry certifications 8
 and hosted by Cal-PASS Plus, the Launchboard aggregates program and regional-level data including: Student characteristics, progress, and completion from the CCCCO database Wage data from Employment Development Department Employment outcomes from the CTE Employment Outcomes Survey Labor market information from EMSI Local information such as low-unit certificates and industry certifications 8.")
9
LaunchBoard Origins Concept was developed at a statewide planning meeting of diverse CTE stakeholders (June 2012) Structure and metrics were developed by the RP Group, Cal-PASS Plus, Centers of Excellence, and WestEd as a proof-of-concept (July-November 2012) Chancellor’s Office adopted the concept and expanded the scope to include the Common Metrics used for Workforce and Economic Development grant reporting (December 2012-January 2013) Beta version vetted with the field (2013-2015) Version 2.0 set to launch January 2016 9
 Structure and metrics were developed by the RP Group, Cal-PASS Plus, Centers of Excellence, and WestEd as a proof-of-concept (July-November 2012) Chancellor’s Office adopted the concept and expanded the scope to include the Common Metrics used for Workforce and Economic Development grant reporting (December 2012-January 2013) Beta version vetted with the field ( ) Version 2.0 set to launch January")
10
Purpose of revision Reevaluated metrics to ensure that they better align with other state and federal initiatives they are based on available data the construction of the metrics accurately addresses the needs of practitioners Provide practitioners with visually-dynamic reports that address common questions 10

11
Determine what you want to see

12
Find answers to common questions

13
View supply and demand There were 16,830 more job openings than graduates in the region.

14
See graphics in table format

15
Examine equity gaps in student outcomes There were equity gaps for African American, Hispanic, Pacific Islander, and Two or More Races students.

16
Learn about employment outcomes After a year, 61% of graduates and skills-builder students were employed.

17
Track changes in earnings After a year, graduates and skills-builders were making 37% more.

18
Evaluate earnings outcomes After a year, 46% of graduates and skills-builders were making a living wage.

19
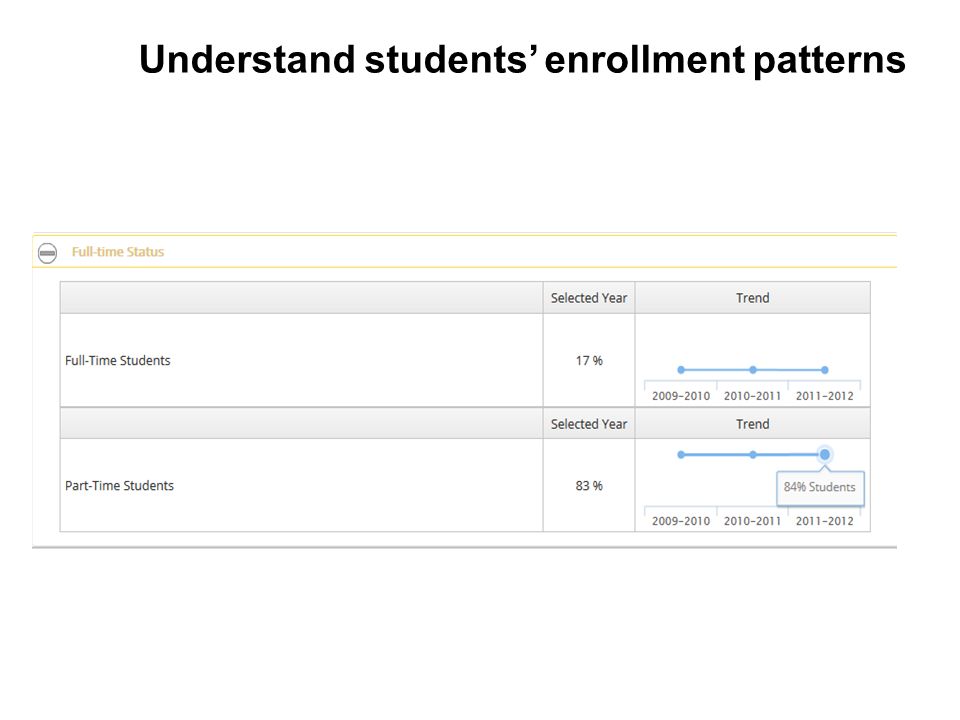
Understand students’ enrollment patterns

21
Review special needs populations

22
Track key milestones within a program area

23
Review success outcomes

25
See details on earnings

26
Review labor market information TOTAL PEOPLE EMPLOYED IN THE REGION MetricCurrent Year (2013)5 Years Ago (2008) 5 Year Change (2008- 2013) 5 Year Trend Requires Bachelor’s Degree or Higher Dietitians and Nutritionists2,3971,880517 Physician Assistants2,3491,962387 Athletic Trainers301302 Requires Associate Degree Radiation Therapist27526213 Respiratory Therapist4,3254,152173 Dental Hygienists5,6495,342307 Cardiovascular Technologists and Technicians1,1411,041100 Diagnostic Medical Sonographers1,1861.021165 Requires a Postsecondary Non-Degree Award Emergency Medical Technicians and Paramedics4,1983,676522 Psychiatric Technicians1,8531,75895 Surgical Technologists2,7992,477322 Licensed Practical and Licensed Vocational Nurses21,25216,8452,874 Medical Records and Health Information Technicians4,7924,301491 On-The-Job Training, No College Required Home Health Aides17,8668,7209.146 Occupational Therapy Aides23313598 Total employed, projected job openings, entry-level and median salaries
5 Years Ago (2008) 5 Year Change ( ) 5 Year Trend Requires Bachelor’s Degree or Higher Dietitians and Nutritionists2,3971, Physician Assistants2,3491, Athletic Trainers Requires Associate Degree Radiation Therapist Respiratory Therapist4,3254, Dental Hygienists5,6495, Cardiovascular Technologists and Technicians1,1411, Diagnostic Medical Sonographers1, Requires a Postsecondary Non-Degree Award Emergency Medical Technicians and Paramedics4,1983, Psychiatric Technicians1,8531,75895 Surgical Technologists2,7992, Licensed Practical and Licensed Vocational Nurses21,25216,8452,874 Medical Records and Health Information Technicians4,7924, On-The-Job Training, No College Required Home Health Aides17,8668, Occupational Therapy Aides Total employed, projected job openings, entry-level and median salaries")
27
Disaggregate and compare outcomes Gender Race/ethnicity Special needs populations: Foster youth, veterans, disabled students, first-generation, ever received financial aid, ever took a basic skills course First-time status: First-time, returning Full-time status: Full-time, part-time Employment outcomes: Skills-builders, locally-issued certificate recipients, Chancellor’s Office approved certificate recipients, degree recipients Regional comparison view: By college for milestones, success, and employment metrics State comparison view: College or region compared to statewide median outcomes

28
Future of Analytical Dashboards LaunchBoard lives “between” Strategic and Operational Dashboards currently in use Driven from a program-specific use and need Assembles data from many sources into program ODS Opens up data to new audiences Others will likely desire similar tools (Adult Ed? Noncredit? Basic Skills? Pathways Trust? CSU Center for Teacher Quality?) Further adds to both knowledge and burden of local IR shop Should there be a “between” layer of IR to navigate?
 Further adds to both knowledge and burden of local IR shop Should there be a between layer of IR to navigate .")
29
California Community Colleges – Chancellor’s Office | 113 Colleges | 72 Districts | 2.1 Million Students 29

Similar presentations


 Employment Outcomes Survey 2013 Tuesday, November 12, 2013 Workforce Workgroup Presentation E. Kuo FH IR&P.>")


