Download presentation
Presentation is loading. Please wait.

1
Debugging parallel programs

2
Breakpoint debugging Probably the most widely familiar method of debugging programs is breakpoint debugging. In this method, you are allowed to specify locations in your program (breakpoints) where the program execution will suddenly stop, giving you the opportunity to examine the program's state. You can then either let the program execute one or more instructions at a time, or allow it to continue until another breakpoint, and examine the state again. Breakpoint debugging works very well for serial programs that do not interact with any other dynamic entities (other programs or real-world devices). However, programs in the parallel and real-time domains may have their behavior and results altered if interrupted by a debugger. Events may go undetected, message queues may overflow, and moving parts may fail to stop in time, causing real-world damage to machines or people. One solution is to instrument the code, but the most frequently used way to do this is to insert print statements by hand, which has numerous disadvantages and limited power. A tool to instrument a program at runtime would need many of the capabilities of a debugger; and indeed, a typical debugger has most of the capabilities both to perform the instrumenting, and to help analyze the resulting trace data. A debugger could easily plant tracing instrumentation in the executing program, and just as easily could display the values of program data and arbitrary expressions collected, together with the associated source code; and it could do it all interactively. The Cygnus approach uses the popular GNU debugger, GDB, both to set up and to analyze trace experiments. In a trace experiment, the user specifies program locations to trace and what data to collect at each one (using the full power of the source language's symbolic expressions). A simplified, non-symbolic description of the trace experiment is downloaded to a separate trace collection program. Then the program is run while the specially written trace collection program collects the data. Finally, GDB is used again to review the traced events, stepping from one tracepoint execution to the next and displaying the recorded data values just as if debugging the program in real time; or GDB's scripting language is used to produce a report of the collected data, formatted to the user's specification. From: http://www.redhat.com/support/wpapers/cygnus/cygnus_heinsenberg/
 where the program execution will suddenly stop, giving you the opportunity to examine the program s state. You can then either let the program execute one or more instructions at a time, or allow it to continue until another breakpoint, and examine the state again. Breakpoint debugging works very well for serial programs that do not interact with any other dynamic entities (other programs or real-world devices). However, programs in the parallel and real-time domains may have their behavior and results altered if interrupted by a debugger. Events may go undetected, message queues may overflow, and moving parts may fail to stop in time, causing real-world damage to machines or people. One solution is to instrument the code, but the most frequently used way to do this is to insert print statements by hand, which has numerous disadvantages and limited power. A tool to instrument a program at runtime would need many of the capabilities of a debugger; and indeed, a typical debugger has most of the capabilities both to perform the instrumenting, and to help analyze the resulting trace data. A debugger could easily plant tracing instrumentation in the executing program, and just as easily could display the values of program data and arbitrary expressions collected, together with the associated source code; and it could do it all interactively. The Cygnus approach uses the popular GNU debugger, GDB, both to set up and to analyze trace experiments. In a trace experiment, the user specifies program locations to trace and what data to collect at each one (using the full power of the source language s symbolic expressions). A simplified, non-symbolic description of the trace experiment is downloaded to a separate trace collection program. Then the program is run while the specially written trace collection program collects the data. Finally, GDB is used again to review the traced events, stepping from one tracepoint execution to the next and displaying the recorded data values just as if debugging the program in real time; or GDB s scripting language is used to produce a report of the collected data, formatted to the user s specification. From:")
3
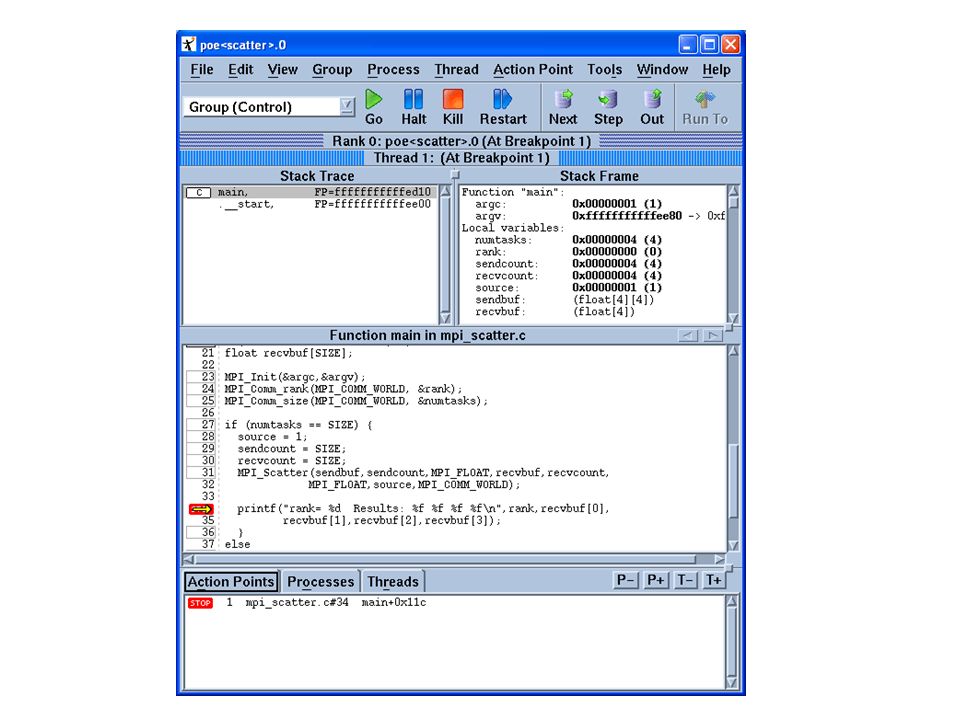
TotalView Most of the time MPI programs are debugged using print statements. The most popular breakpoint debugger is TotalView

4
What is TotalView? TotalView is a sophisticated software debugger product of Etnus LLC.Etnus LLC. Used for debugging, analyzing, and tuning program performance. Especially designed for use with complex, multi- process and/or multi-threaded applications. Has been selected as the Department of Energy's Advanced Simulation and Computing (ASC) program's debugger.Advanced Simulation and Computing (ASC)
 program s debugger.Advanced Simulation and Computing (ASC).")
5
Key Features of TotalView: Provides source and assembler level debugging for serial, parallel, multi-process and multi-threaded codes. Portable: able to be used in a variety of UNIX environments, including those with distributed, clustered, uniprocessor and SMP machines. Supports most popular parallel programming models/libraries such as MPI, OpenMP, Threads, PVM, SHMEM and hybrid. Provides all debugging facilities through easy to learn and use Xwindows based Graphical User Interface. Also provides a command line interpreter for non-GUI debugging. Can be used to debug a specified program, an unattached running process, or a core file.

6
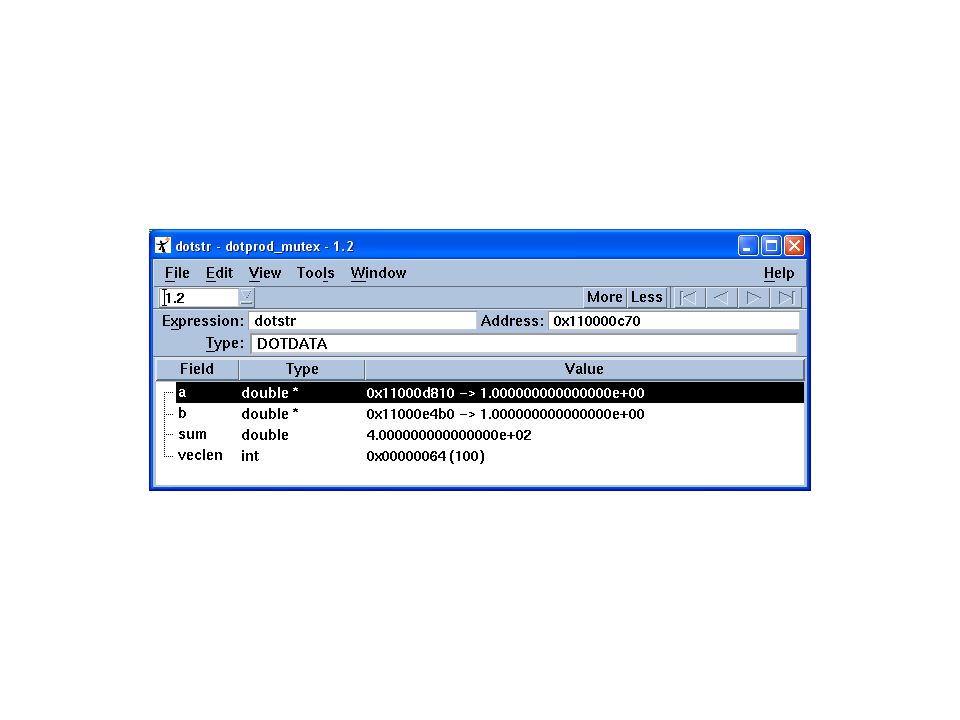
On a per process/thread basis, permits you to view: –Source code, assembler code, or both –Source for called functions –The execution stack trace (procedure calling stack) –Stack variables and registers –Program data (variables, arrays) –MPI message queues Provides for the insertion and execution of "code fragments" within the current process context. Provides several types of "action points", as well as the ability to set, delete, suppress, unsurpress and save them: –process breakpoint - on a source line basis –multi-process barrier - blocking breakpoint for parallel processes –conditional breakpoint - where breakpoint occurs only if a code fragment expression is satisfied –evaluation points - where code fragments are evaluated Allows you to easily modify program data (addresses, arrays, array slices, variables) while debugging Provides special features for memory related debugging Provides graphical visualization of array data during debugging session Includes an extensive web browser based online help system
 while debugging Provides special features for memory related debugging Provides graphical visualization of array data during debugging session Includes an extensive web browser based online help system.")
9
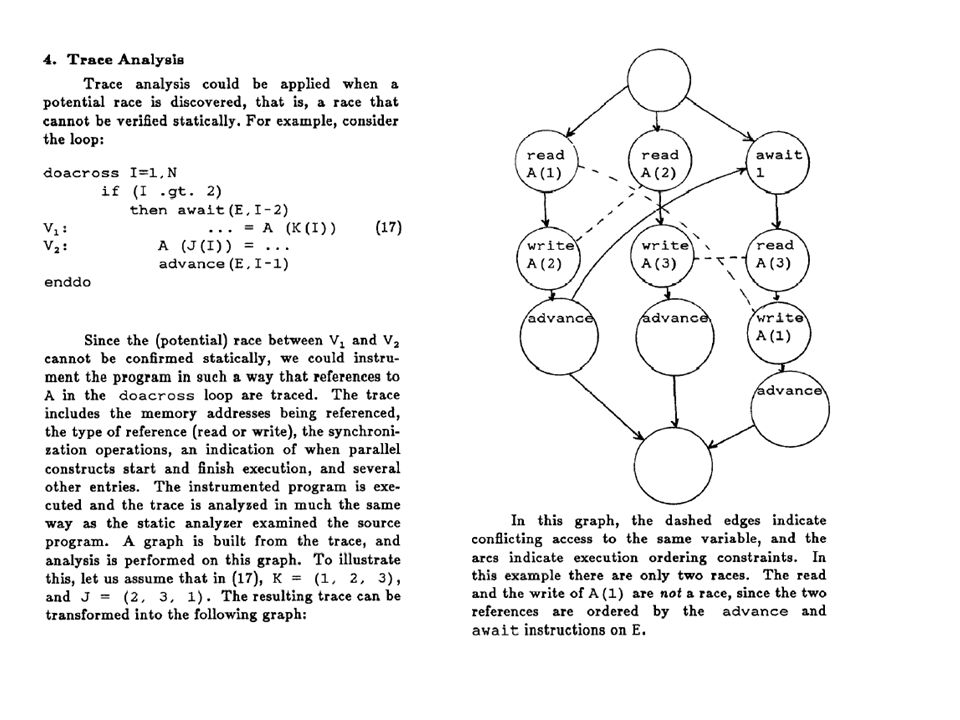
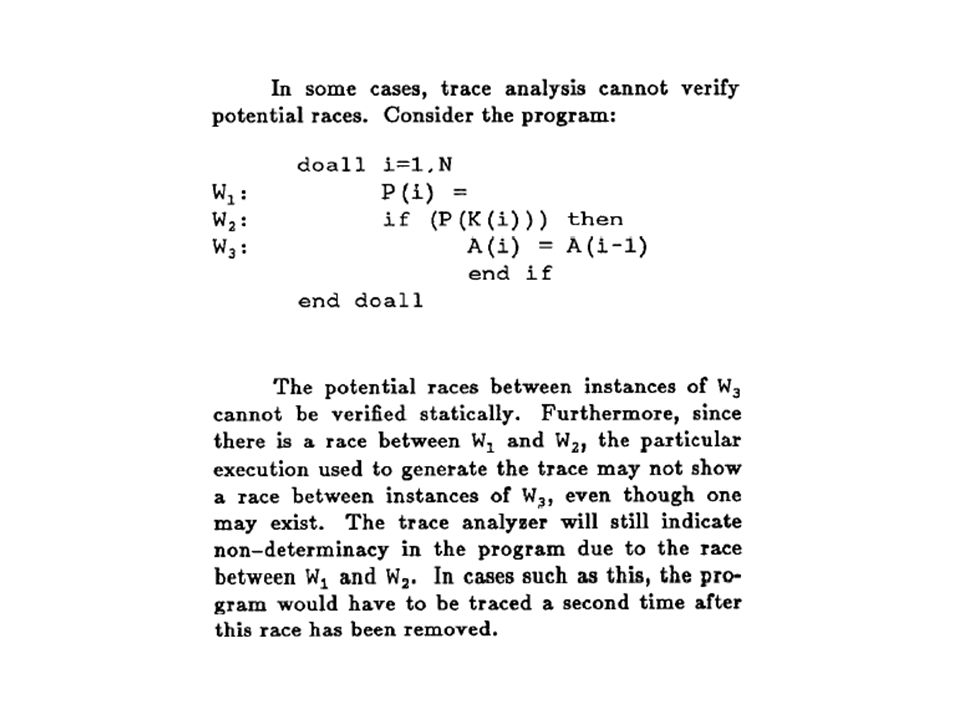
Detecting races with trace analysis The objective of trace analysis techniques is to identify races in parallel programs. The strategy consists in (conceptually) –executing the program, –generating a trace of all memory accesses and synchronization operations –Building a graph of orderings (solid arrows below) and conflicting memory references (dashed lines below) –Detecting races (when two nodes connected by dashed lines are not ordered by solid arrows) Example: Intel Thread Checker
 –executing the program, –generating a trace of all memory accesses and synchronization operations –Building a graph of orderings (solid arrows below) and conflicting memory references (dashed lines below) –Detecting races (when two nodes connected by dashed lines are not ordered by solid arrows) Example: Intel Thread Checker.")
10
Doacross synchronization

13
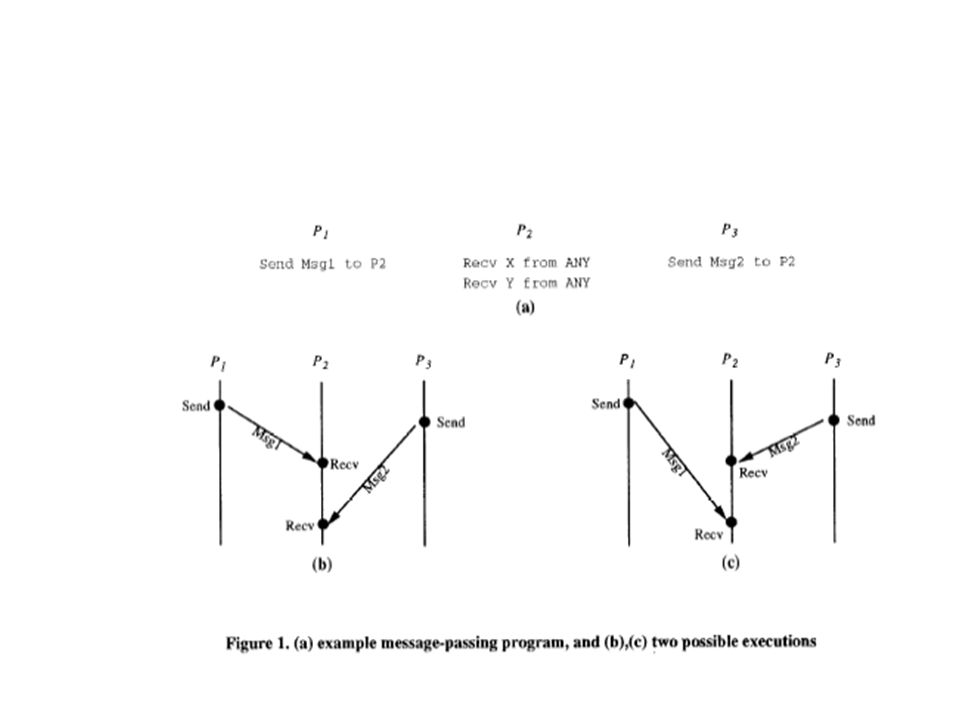
Replay Races are possible in MPI programs. For debugging we want to keep a history of events so that every time we run the program during debugging we get the same behavior. See: Optimal tracing and replay for debugging message-pass in parallel programs R. H. B. Netzer B. P. Miller Proceedings of the 1992 ACM/IEEE conference on Supercomputing Minneapolis, Minnesota, United States Pages: 502 - 511 Year of Publication: 1992 ISBN:0-8186- 2630-5

Similar presentations


 Java Virtual Machine â Core Java (API) Application Programming.>")


