Download presentation
Presentation is loading. Please wait.

2
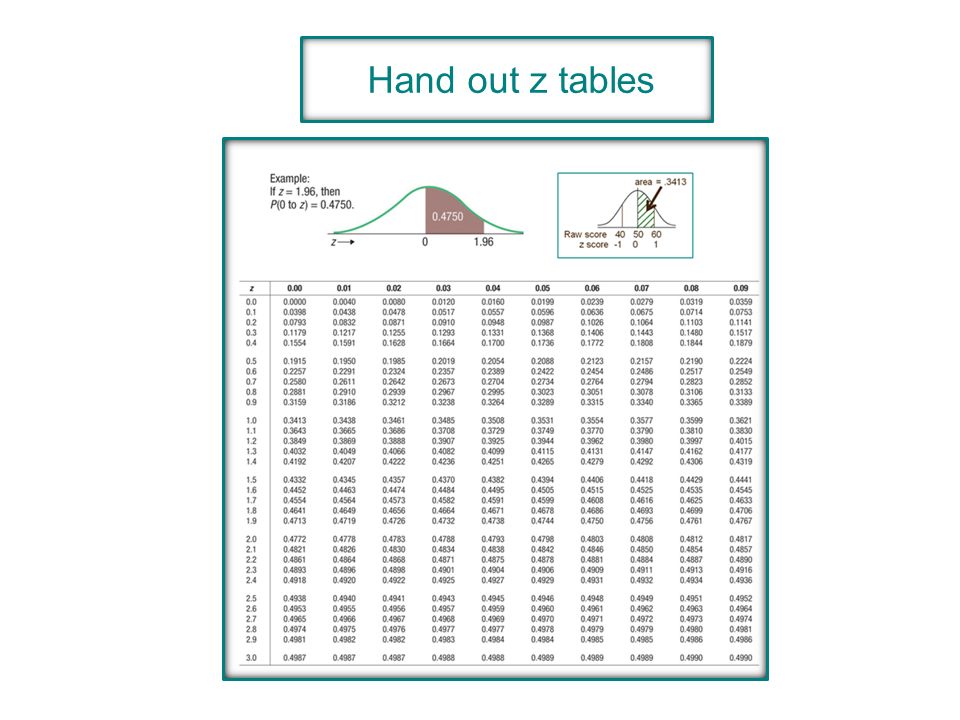
Hand out z tables

3
Introduction to Statistics for the Social Sciences SBS200, COMM200, GEOG200, PA200, POL200, or SOC200 Lecture Section 001, Spring 2015 Room 150 Harvill Building 8:00 - 8:50 Mondays, Wednesdays & Fridays. http://courses.eller.arizona.edu/mgmt/delaney/d15s_database_weekone_screenshot.xlsx

5
Labs continue this week finalizing Project 1

6
Schedule of readings Before next exam (March 6 th ) Please read chapters 5, 6, & 8 in Ha & Ha Please read Chapters 10, 11, 12 and 14 in Plous Chapter 10: The Representativeness Heuristic Chapter 11: The Availability Heuristic Chapter 12: Probability and Risk Chapter 14: The Perception of Randomness
 Please read chapters 5, 6, & 8 in Ha & Ha Please read Chapters 10, 11, 12 and 14 in Plous Chapter 10: The Representativeness Heuristic Chapter 11: The Availability Heuristic Chapter 12: Probability and Risk Chapter 14: The Perception of Randomness")
7
Homework due – Wednesday (February 25 th ) On class website: Please print and complete homework worksheet #10 Calculating z-score, raw scores and areas under normal curve
 On class website: Please print and complete homework worksheet #10 Calculating z-score, raw scores and areas under normal curve")
8
1. What is a “deviation score” 2. Preston has a deviation score of 2: What does that tell us about Preston? Is he taller or shorter than the mean? And by how much? Are most people in the group taller or shorter than Preston 3.Mike has a deviation score of -4: What does that tell us about Mike? Is he taller or shorter than the mean? And by how much? Are most people in the group taller or shorter than Mike 4.Diallo has a deviation score of 0: What does that tell us about Diallo? Is he taller or shorter than the mean? And by how much? Are most people in the group taller or shorter than Diallo? 5.Please write the formula for the standard deviation of a population 6.Please draw 3 curves showing 1, 2 & 3 standard deviations from mean How far away is each score from the mean? Preston is 2” taller than the mean (taller than most) Mike is 4” shorter than the mean (shorter than most) Diallo is exactly same height as mean (half taller half shorter) Writing Assignment – Revisit our old Pop Quiz Review
 Mike is 4 shorter than the mean (shorter than most) Diallo is exactly same height as mean (half taller half shorter) Writing Assignment – Revisit our old Pop Quiz Review.")
9
7. What does this symbol refer to? 8. What does this symbol refer to? 11. What does this symbol refer to? 9. What does this symbol refer to? 10. What does this symbol refer to? What is it called? What does it mean? Is it referring to a sample or population? What is it called? What does it mean? Is it referring to a sample or population? What is it called? What does it mean? Is it referring to a sample or population? What is it called? What does it mean? Is it referring to a sample or population? The standard deviation (population) The mean (population) The mean (sample) The standard deviation (sample) Each individual score sigma population mu x-bar population sample s Review Writing Assignment – Revisit our old Pop Quiz
 The mean (population) The mean (sample) The standard deviation (sample) Each individual score sigma population mu x-bar population sample s Review Writing Assignment – Revisit our old Pop Quiz.")
10
12. What does this refer to? 13. What does this refer to? 14. What do these two refer to? 15. What does this refer to? What are they called? How are they different What is it called? Use it for sample data or population? What are they called? What do they refer to? How are they different What are they called? How are they different Variance population sample Sigma squared S squared Deviation scores population sample Sum of squares population sample Degrees of freedom Review Writing Assignment – Revisit our old Pop Quiz

11
16. What does this refer to? What are they called? What do they refer to? How are they different 17. What does this refer to? What are they called? What do they refer to? How are they different Variance population sample Standard Deviation population sample Review Writing Assignment – Revisit our old Pop Quiz

12
Scores, standard deviations, and probabilities The normal curve always has the same shape. They differ only by having different means and standard deviation

13
Scores, standard deviations, and probabilities Actually 68.26 Actually 95.44 To be exactly 95% we will use z = 1.96

14
Scores, standard deviations, and probabilities What is total percent under curve? 100% What proportion of curve is above the mean?.50 The normal curve always has the same shape. They differ only by having different means and standard deviation Review

15
Scores, standard deviations, and probabilities Mean = 100 Standard deviation = 5 What percent of curve is below a score of 100? 50% What score is associated with 50 th percentile? median The normal curve always has the same shape. They differ only by having different means and standard deviation Review

16
Raw Scores (actual data) Distance from the mean (z scores) Proportion of curve (area from mean) convert We care about this! “percentiles” “percent of people” “proportion of curve” “relative position” We care about this! What is the actual number on this scale? “height” vs “weight” “pounds” vs “test score” Raw Scores (actual data) Distance from the mean (z scores) Proportion of curve (area from mean) convert Raw scores, z scores & probabilities z = -1z = 1 68% z = -1z = 1 68% Review
 Distance from the mean (z scores) Proportion of curve (area from mean) convert Raw scores, z scores & probabilities z = -1z = 1 68% z = -1z = 1 68% Review.")
17
Raw Scores Area & Probability Z Scores Formula z table Have raw score Find z Have z Find raw score Have area Find z Have z Find area Normal distribution Raw scores z-scores probabilities Review

18
2) Find z score 3) Go to z table - find area under correct column 1) Draw the picture 4) Report the area 50 60 60 50 10 z = 1 34.13% Raw Scores (actual data) Distance from the mean ( from raw to z scores) Proportion of curve (area from mean) z-table (from z to area) Find the area under the curve that falls between 50 and 60 Review
 Find z score 3) Go to z table - find area under correct column 1) Draw the picture 4) Report the area z = % Raw Scores (actual data) Distance from the mean ( from raw to z scores) Proportion of curve (area from mean) z-table (from z to area) Find the area under the curve that falls between 50 and 60 Review")
19
Writing Assignment Let’s do some problems Mean = 50 Standard deviation = 10

20
Let’s do some problems Mean = 50 Standard deviation = 10 Find the percentile rank for score of 60 ? Find the area under the curve that falls below 60 means the same thing as 60 Problem 1

21
Let’s do some problems Mean = 50 Standard deviation = 10 1) Find z score z score = 60 - 50 10 Hint always draw a picture! Find the percentile rank for score of 60 60 2) Go to z table - find area under correct column (.3413) 4) Percentile rank or score of 60 = 84.13% 3) Look at your picture - add.5000 to.3413 =.8413 ?.3413.5000 = 1 Raw Scores (actual data) Distance from the mean ( from raw to z scores) Proportion of curve (area from mean) z-table (from z to area) Problem 1
 Go to z table - find area under correct column (.3413) 4) Percentile rank or score of 60 = 84.13% 3) Look at your picture - add.5000 to.3413 = = 1 Raw Scores (actual data) Distance from the mean ( from raw to z scores) Proportion of curve (area from mean) z-table (from z to area) Problem 1.")
22
Mean = 50 Standard deviation = 10 1) Find z score z score = 75 - 50 10 Hint always draw a picture! Find the percentile rank for score of 75 75 2) Go to z table ? z score = 25 10 = 2.5.4938 Problem 2
 Go to z table . z score = = Problem 2.")
23
Mean = 50 Standard deviation = 10 1) Find z score z score = 75 - 50 10 Hint always draw a picture! Find the percentile rank for score of 75 75 2) Go to z table ? z score = 25 10 = 2.5.4938 4) Percentile rank or score of 75 = 99.38% 3) Look at your picture - add.5000 to.4938 =.9938.5000 Problem 2
 Go to z table . z score = = ) Percentile rank or score of 75 = 99.38% 3) Look at your picture - add.5000 to.4938 = Problem 2.")
24
Mean = 50 Standard deviation = 10 1) Find z score z score = 45 - 50 10 Find the percentile rank for score of 45 45 ? 2) Go to z table z score = - 5 10 = -0.5 Raw Scores (actual data) Distance from the mean ( from raw to z scores) Proportion of curve (area from mean) z-table (from z to area) Problem 3
 Go to z table z score = = -0.5 Raw Scores (actual data) Distance from the mean ( from raw to z scores) Proportion of curve (area from mean) z-table (from z to area) Problem 3.")
25
Mean = 50 Standard deviation = 10 1) Find z score z score = 45 - 50 10 Find the percentile rank for score of 45 45 ? 2) Go to z table z score = - 5 10 = -0.5 ?.1915 Problem 3
 Go to z table z score = = Problem 3.")
26
Mean = 50 Standard deviation = 10 1) Find z score z score = 45 - 50 10 Find the percentile rank for score of 45 45 2) Go to z table z score = - 5 10 = -0.5 4) Percentile rank or score of 45 = 30.85% 3) Look at your picture - subtract.5000 -.1915 =.3085.1915 ?.3085 Raw Scores (actual data) Distance from the mean ( from raw to z scores) Proportion of curve (area from mean) z-table (from z to area) Problem 3
 Find z score z score = Find the percentile rank for score of ) Go to z table z score = = ) Percentile rank or score of 45 = 30.85% 3) Look at your picture - subtract = Raw Scores (actual data) Distance from the mean ( from raw to z scores) Proportion of curve (area from mean) z-table (from z to area) Problem 3")
27
Mean = 50 Standard deviation = 10 1) Find z score z score = 55 - 50 10 Find the percentile rank for score of 55 ? 2) Go to z table z score = 5 10 = 0.5 55 Raw Scores (actual data) Distance from the mean ( from raw to z scores) Proportion of curve (area from mean) z-table (from z to area) Problem 4
 Go to z table z score = 5 10 = Raw Scores (actual data) Distance from the mean ( from raw to z scores) Proportion of curve (area from mean) z-table (from z to area) Problem 4.")
28
Mean = 50 Standard deviation = 10 1) Find z score z score = 55 - 50 10 Find the percentile rank for score of 55 2) Go to z table z score = 5 10 = 0.5 55.1915 ? Problem 4

29
Mean = 50 Standard deviation = 10 1) Find z score z score = 55 - 50 10 Find the percentile rank for score of 55 ? 2) Go to z table z score = 5 10 = 0.5 4) Percentile rank or score of 55 = 69.15% 3) Look at your picture - add.5000 +.1915 =.6915 55.1915.5 Raw Scores (actual data) Distance from the mean ( from raw to z scores) Proportion of curve (area from mean) z-table (from z to area) Problem 4
 Go to z table z score = 5 10 = 0.5 4) Percentile rank or score of 55 = 69.15% 3) Look at your picture - add = Raw Scores (actual data) Distance from the mean ( from raw to z scores) Proportion of curve (area from mean) z-table (from z to area) Problem 4.")
30
Find the score for z = -2 Mean = 50 Standard deviation = 10 raw score = mean + (z score)(standard deviation) Raw score = 50 + (-2)(10) Raw score = 50 + (-20) = 30 Hint always draw a picture! Find the score that is associated with a z score of -2 ? 30 Raw Scores (actual data) Distance from the mean ( from raw to z scores) Proportion of curve (area from mean) z-table (from z to area) Please note: When we are looking for the score from proportion we use the z-table ‘backwards’. We find the closest z to match our proportion
 Distance from the mean ( from raw to z scores) Proportion of curve (area from mean) z-table (from z to area) Please note: When we are looking for the score from proportion we use the z-table ‘backwards’. We find the closest z to match our proportion.")
31
Mean = 50 Standard deviation = 10 Find the score for percentile rank of 77%ile.7700 ? ? Raw Scores (actual data) Distance from the mean ( from raw to z scores) Proportion of curve (area from mean) z-table (from z to area) Please note: When we are looking for the score from proportion we use the z-table ‘backwards’. We find the closest z to match our proportion Problem 5
 Distance from the mean ( from raw to z scores) Proportion of curve (area from mean) z-table (from z to area) Please note: When we are looking for the score from proportion we use the z-table ‘backwards’. We find the closest z to match our proportion Problem 5.")
32
Mean = 50 Standard deviation = 10 Find the score for percentile rank of 77%ile 1) Go to z table - find z score for for area.2700 (.7700 -.5000) =.27.7700 ? ?.5.27.5.27 area =.2704 (closest I could find to.2700) z = 0.74 Please note: When we are looking for the score from proportion we use the z-table ‘backwards’. We find the closest z to match our proportion Problem 5.5 +.27 =.77
 z = 0.74 Please note: When we are looking for the score from proportion we use the z-table ‘backwards’. We find the closest z to match our proportion Problem =.77.")
33
Mean = 50 Standard deviation = 10 Find the score for percentile rank of 77%ile ?.5.27 2) x = mean + (z)(standard deviation) x = 50 + (0.74)(10) x = 57.4 Please note: When we are looking for the score from proportion we use the z-table ‘backwards’. We find the closest z to match our proportion x = 57.4.7700 ?.5.27 Problem 5

34
Mean = 50 Standard deviation = 10 Find the score for percentile rank of 55%ile.5500 ? ? Raw Scores (actual data) Distance from the mean ( from raw to z scores) Proportion of curve (area from mean) z-table (from z to area) Problem 6 Please note: When we are looking for the score from proportion we use the z-table ‘backwards’. We find the closest z to match our proportion
 Distance from the mean ( from raw to z scores) Proportion of curve (area from mean) z-table (from z to area) Problem 6 Please note: When we are looking for the score from proportion we use the z-table ‘backwards’. We find the closest z to match our proportion.")
35
Mean = 50 Standard deviation = 10 Find the score for percentile rank of 55%ile 1) Go to z table - find z score for for area.0500 (.5500 -.5000) =.05.5500 ? ?.5.05.5.05 area =.0517 (closest I could find to.0500) z = 0.13 Please note: When we are looking for the score from proportion we use the z-table ‘backwards’. We find the closest z to match our proportion Problem 6.5 +.05 =.55
 z = 0.13 Please note: When we are looking for the score from proportion we use the z-table ‘backwards’. We find the closest z to match our proportion Problem =.55.")
36
Mean = 50 Standard deviation = 10 Find the score for percentile rank of 55%ile 1) Go to z table - find z score for for area.0500 (.5500 -.5000) =.05.5500 ? ?.5.05.5.05 area =.0517 (closest I could find to.0500) z = 0.13 Please note: When we are looking for the score from proportion we use the z-table ‘backwards’. We find the closest z to match our proportion Problem 6
 z = 0.13 Please note: When we are looking for the score from proportion we use the z-table ‘backwards’. We find the closest z to match our proportion Problem 6.")
37
Mean = 50 Standard deviation = 10 Find the score for percentile rank of 55%ile 1) Go to z table - find z score for for area.0500 (.5500 -.5000) =.0500 area =.0517 (closest I could find to.0500) z = 0.13.5500 ? ?.5.05.5.05 2) x = mean + (z)(standard deviation) x = 50 + (0.13)(10) x = 51.3 Please note: When we are looking for the score from proportion we use the z-table ‘backwards’. We find the closest z to match our proportion x = 51.3 Problem 6
 x = mean + (z)(standard deviation) x = 50 + (0.13)(10) x = 51.3 Please note: When we are looking for the score from proportion we use the z-table ‘backwards’. We find the closest z to match our proportion x = 51.3 Problem 6.")
Similar presentations