Download presentation
Presentation is loading. Please wait.

1
6.8 Compare Statistics from Samples MM1D3a: Compare summary statistics (mean, median, quartiles, and interquartile range) from one sample data distribution to anther sample data distribution in describing center and variability of data. b: Compare averages of the summary statistics from a large number of samples to the corresponding population. Unit 4: The Chance of Winning

2
Vocabulary Quartile- The median of an ordered data set. Upper Quartile- The median of the upper half of an ordered set. Lower Quartile- The median of the lower half of an ordered data set. Interquartile Range- The difference between the upper quartile and the lower quartile.

3
Ex: Find the mean, median, range, lower quartile, upper quartile, and interquartile range of the data. 1. 11, 16, 18, 17, 20, 10, 14, 10, 17, 12

4
Ex: Find the mean, median, range, lower quartile, upper quartile, and interquartile range of the data. 2. 124, 179, 250, 196, 297, 221, 170, 276, 141

5
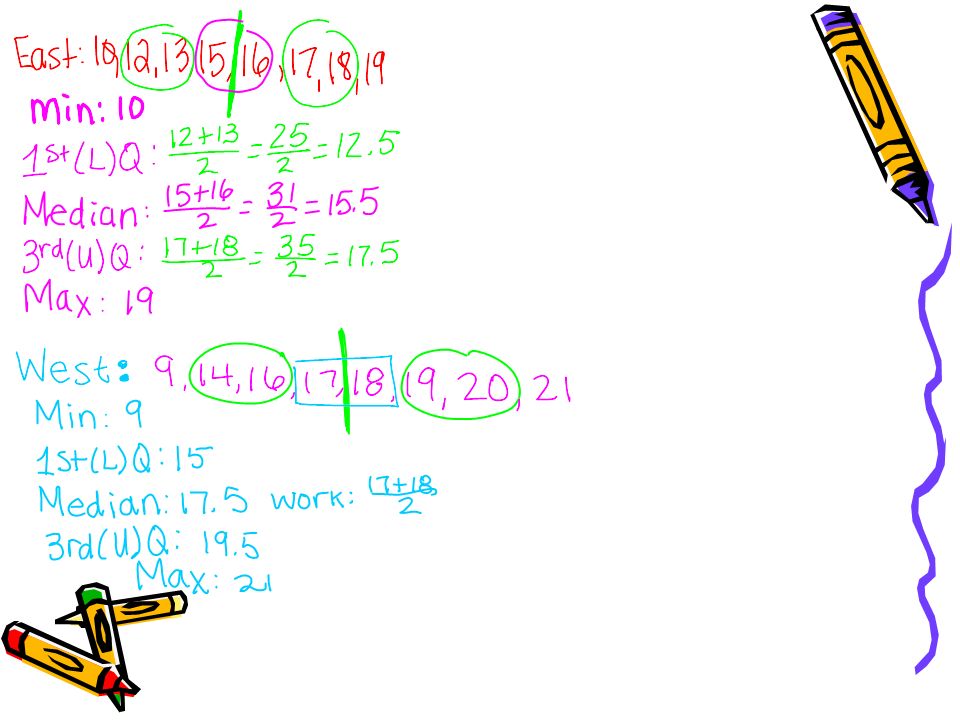
(Ex 3) Compare statistics from different samples The data sets below give the number of computers assembled by each employee during one month in the East production division and the West production division. Compare the data using the 5 number summary: minimum, 1 st quartile(Lower), median, 3rd quartile(Upper), and maximum. East: 19, 18, 17, 16, 15, 13, 12, 10 West: 21, 20, 19, 18, 17, 16, 14, 9
, median, 3rd quartile(Upper), and maximum. East: 19, 18, 17, 16, 15, 13, 12, 10 West: 21, 20, 19, 18, 17, 16, 14, 9.")
7
(Ex 4) Use a box and whisker plot to compare data.
 Use a box and whisker plot to compare data.")
8
Assignment p. 371 #1-6,8-9 (For #6, draw box and whisker plots and compare the 2 sets of data.)
")
Similar presentations


>")


. Boxplot A graph of a set of data obtained by drawing a horizontal line from the minimum to maximum values with quartiles.>")


 from one sample data.>")
