Download presentation
Presentation is loading. Please wait.

1
Sampling Techniques 19 th and 20 th

2
Learning Outcomes Students should be able to design the source, the type and the technique of collecting data

3
Outlines Population and sampling Determining sample size Sampling design Appropriate sampling design for different research purposes

4
Population, Element, Population Frame Population: – The entire group of people, events, or things of interest that needs to be investigated Ex: if the CEO of a computer firm wants to know the kinds of advertising strategies adopted by the computer firms in the Silicon Valley, then all computer firms located there will be the population. Element: – A single member of the population Ex: if 1000 blue-collar workers in a particular organization happen to be the population of interest to a researcher, then each blue-collar worker is an element. Population frame: – A listing of all the elements in the population from which the sample is drawn Ex: the payroll of an organization would serve as a population frame if its members are to be studied

5
Sample and Subject Sample: – a subset of population comprises some members selected from it (elements of the population would form the sample) Ex: if there are 145 in-patients in a hospital and 40 of them are to be surveyed by the hospital administrator to assess their level of satisfaction with the treatment received, then these 40 members will be the sample. Subject: – is a single member of the sample, just as an element of single member of population Ex: if a sample of 50 machines from a total of 500 machines is to inspected, then every one of the 50 machines is a subject.

6
Sampling Selection of sufficient number of items or elements from the population so that the properties of the sample (statistic) could be generalized to the population (parameter)
 could be generalized to the population (parameter)")
7
Reasons for Sampling Why sampling? – Less costs (cheaper than studying whole population) – Less errors due to less fatigue (better results) – Less time (quicker) – Destruction of elements avoided (e.g., bulbs) However biases in sampling might happen, either overestimation or underestimation in determining sample size
 – Less errors due to less fatigue (better results) – Less time (quicker) – Destruction of elements avoided (e.g., bulbs) However biases in sampling might happen, either overestimation or underestimation in determining sample size.")
8
Probability vs Nonprobability Sampling Probability sampling when elements in the population have a known equal chance of being selected as subjects in the sample, either unrestricted (simple random sampling) or restricted (complex probability sampling) Nonprobability sampling the elements in the population do not have any probabilities attached to their being chosen as sample subjects (the findings of the study from the sample cannot be confidently generalized to the population)
 or restricted (complex probability sampling) Nonprobability sampling the elements in the population do not have any probabilities attached to their being chosen as sample subjects (the findings of the study from the sample cannot be confidently generalized to the population)")
9
Simple Random Sampling Every element in the population has a known and equal chance of being selected as a subject. It is the most representative for most research purposes, has the least bias and offers the most generalizability Disadvantages are: – Most cumbersome and tedious – The entire listing of elements in population frequently unavailable – Very expensive – Not the most efficient design

10
Complex Probability Sampling Systematic sampling Stratified random sampling Cluster sampling Area sampling Double sampling

11
Systematic Sampling Every n th element in the population is sampled, starting from a randomly chosen element Example: – Want a sample of 35 household from a total of 240 houses. Could sample every 7 th house starting from a randomly chosen number from 1 to 10. If that random number is 7, sample 35 houses, starting with 7 th house (14 th house, 21 st house, etc). – Possible problem: there could be systematic bias, e.g., every 7 th house could be a corner house with different characteristics of both house and dwellers
. – Possible problem: there could be systematic bias, e.g., every 7 th house could be a corner house with different characteristics of both house and dwellers.")
12
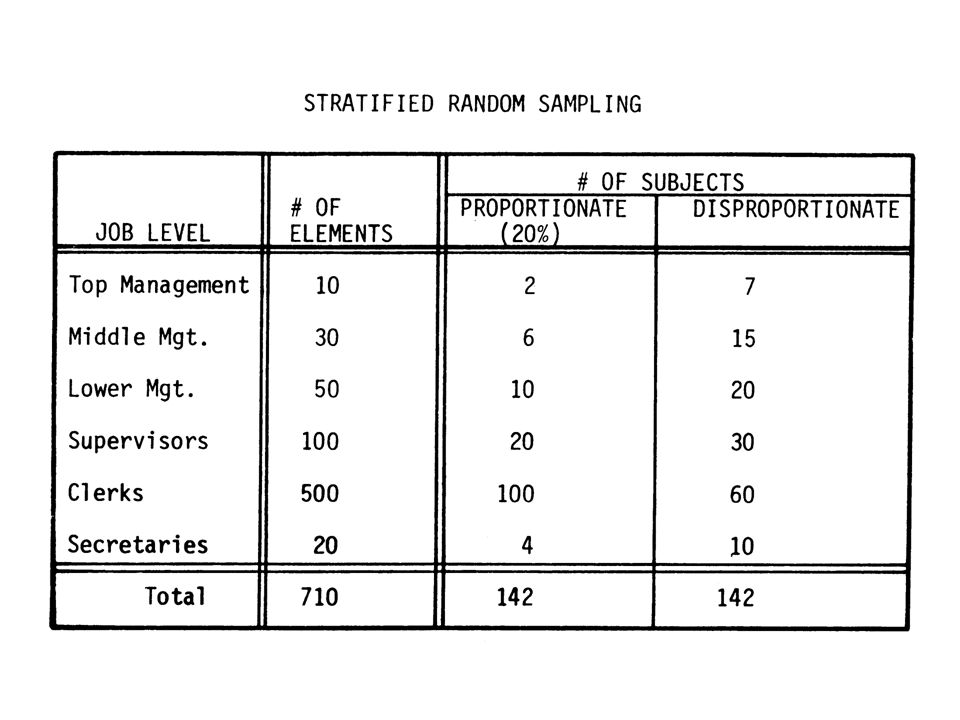
Stratified Random Sampling Comprises sampling from populations segregated into a number of mutually exclusive strata Example: – University students divided into sophomore, junior, senior, – Employees stratified into clerks, supervisors, managers Stratified random sampling can be proportionate or disproportionate Advantages: – Homogeneity between stratum and heterogeneity between strata – Statistical efficiency is greater – Sub-group can be analyzed – Different methods of analysis can be used for different sub-group

14
Cluster Sampling: – Take cluster or chunks of elements for study Example: sample all students in 07 PAJ and 07 PBJ to study the characteristics of Computer Science major Area Sampling: – Cluster sampling confined to a particular area Example: sampling residents of particular region, district, etc Double Sampling: – Collect preliminary data from a sample, and choose a sub-sample of that sample for more detailed investigation Example: Conduct unstructured interviews with a sample of 50. Repeat a structured interview with 30 out of 50 originally sampled

15
Nonprobability Sampling Convenience Sampling (collection of information from members of the population who are conveniently to provide it) – Survey whoever is easily available – Used for quick diagnosis situations – Simplest and cheapest – Weak representativeness (least reliable) Purposive Sampling (confined to specific types of people who can provide the desired information) consist of: Judgment sampling: experts’ opinion could be sought,e.g., doctor surveyed for cancer causes Quota sampling: establish quotas for numbers or proportion of people to be sampled, e.g., survey for research on dual career families: 50% working men and 50% working women surveyed Generalizations of the findings depend on the representativeness of the sample (the sophistication of the sampling technique used)
 – Survey whoever is easily available – Used for quick diagnosis situations – Simplest and cheapest – Weak representativeness (least reliable) Purposive Sampling (confined to specific types of people who can provide the desired information) consist of: Judgment sampling: experts’ opinion could be sought,e.g., doctor surveyed for cancer causes Quota sampling: establish quotas for numbers or proportion of people to be sampled, e.g., survey for research on dual career families: 50% working men and 50% working women surveyed Generalizations of the findings depend on the representativeness of the sample (the sophistication of the sampling technique used)")
16
How Big is Big The goal is to select a representative sample— – Larger samples are usually more representative – But larger samples are also more expensive – And larger samples ignore the power of scientific inference

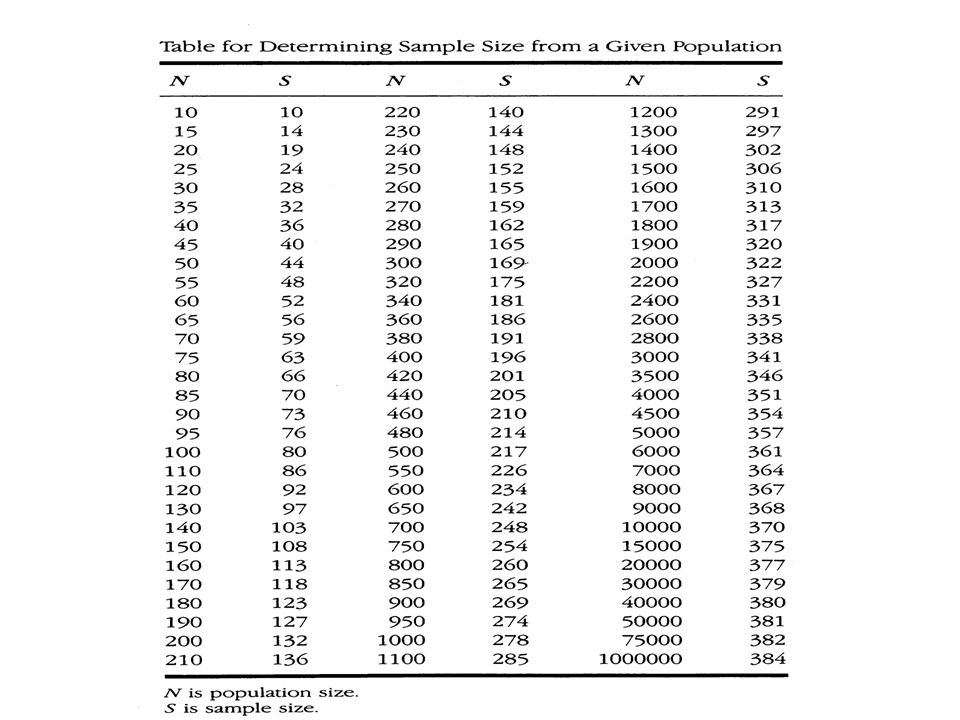
17
Estimating Sample Size Generally, larger samples are needed when – Variability within each group is great – Differences between groups are smaller Because – As a group becomes more diverse, more data points are needed to represent the group – As the difference between groups becomes smaller, more participants are needed to reach “critical mass” to detect the difference

18
Points for Consideration in Sampling What is the relevant population? What type of sample should we draw? What sampling frame do we use? What are the parameters of interest? How much accuracy and precision are desired? What is the sample size needed? Sampling costs?

21
Points for Consideration in Sampling What is the relevant population? What type of sample should we draw? What sampling frame do we use? What are the parameters of interest? How much accuracy and precision are desired? What is the sample size needed? Sampling costs?

Similar presentations