Download presentation
Presentation is loading. Please wait.

1
presented by Dewey M. Caron w/ data geeking by Jenai Fitzpatrick http://pnwhoneybeesurvey.com

3
Beekeeping Education

4
Respondent Hive Years 62% with 1,2 or 3 colonies; m=3, avg=4.2 [range 0-50] 48% with 1,2 or 3 years experience, M=4, avg=6 [range 0-60]
![Respondent Hive Years 62% with 1,2 or 3 colonies; m=3, avg=4.2 [range 0-50] 48% with 1,2 or 3 years experience, M=4, avg=6 [range 0-60]](http://images.slideplayer.com/25/8133308/slides/slide_4.jpg "Respondent Hive Years 62% with 1,2 or 3 colonies; m=3, avg=4.2 [range 0-50] 48% with 1,2 or 3 years experience, M=4, avg=6 [range 0-60]")
5
2014-15 Colony Losses-29% by Hive Type # spring hives 126 605 18 19 22 10 = 800 # fall hives 173 833 38 37 35 15 = 1131 PUB 51% 32% 85% 50% 43% 0% = 38%

6
Another view --PUB w/ Total losses # spring hives (PUB) 22 118 2 11 8 0 = 113 # fall hives 35 174 13 22 14 0 = 144 (PUB) Max = 24
 = 113 # fall hives = 144 (PUB) Max = 24")
7
% Loss by Origination (PNW) # spring hives 343 72 97 182 104 28 = 826 # fall hives 481 133 168 305 149 38 = 1274 (PNW) PUB 33% 52% 49% 39% 40% 20%
 # spring hives = 826 # fall hives = 1274 (PNW) PUB 33% 52% 49% 39% 40% 20%")
8
PUB numbers

9
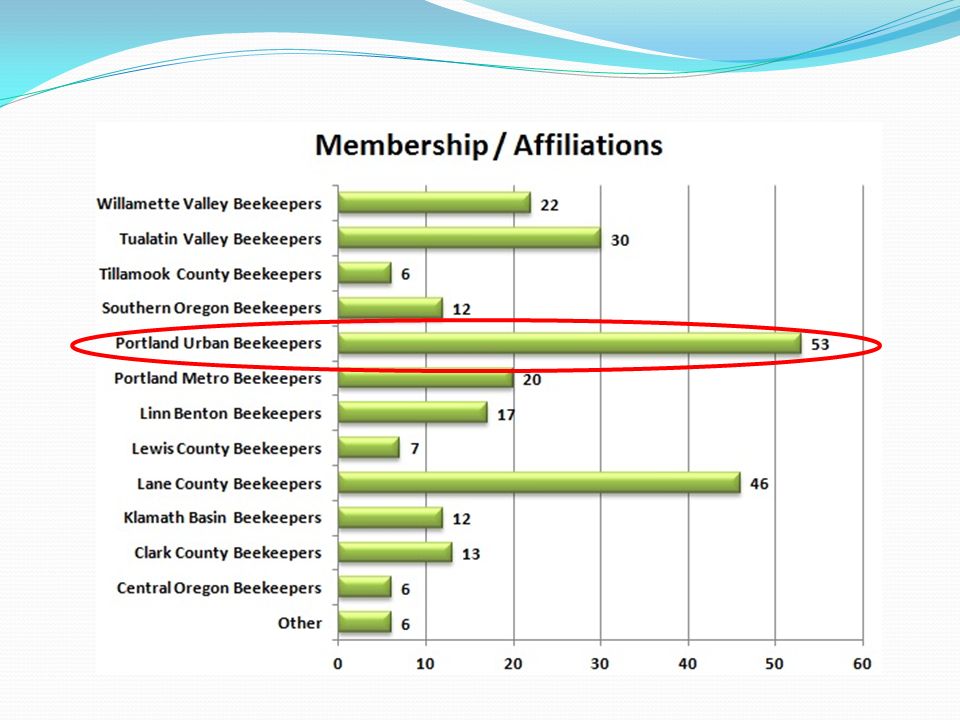
PUB Comparison Last 2 Seasons 69 53

10
42% 9-yr Avg 37% 23% 9-yr Avg = 29%

12
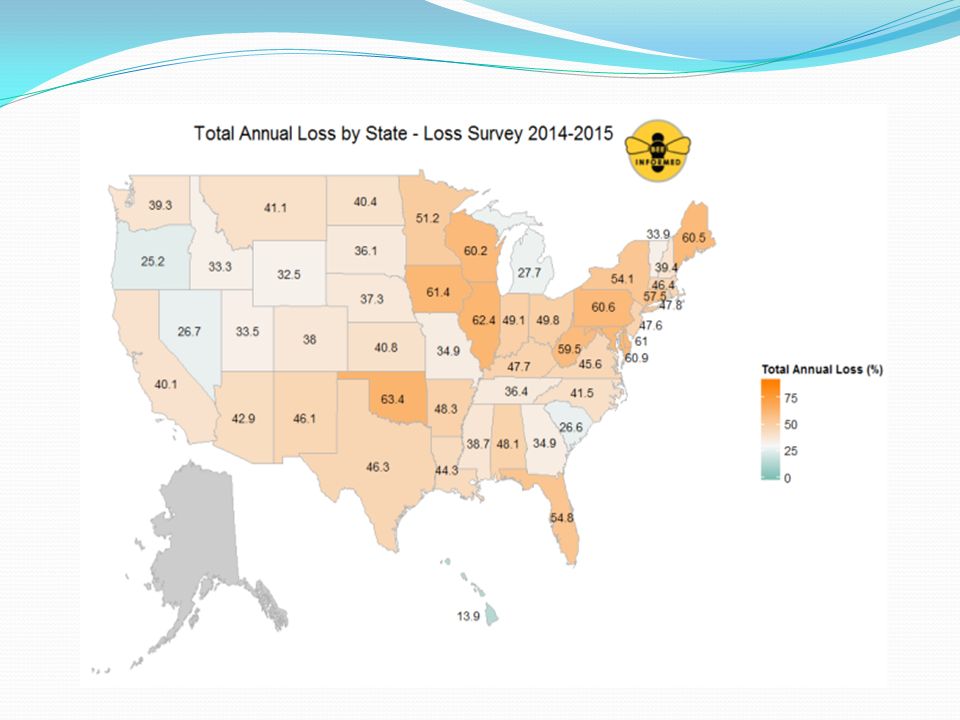
2015 Loss Comparisons # indiv. 41 13 250 6128 % est. col. 61% 60% unknown 14.5% 15.7%14.2% 23.1- [25.2]% OR 29%

13
8 Years of Comparison 16% 29%

16
Another view

18
ManagementsManagements

19
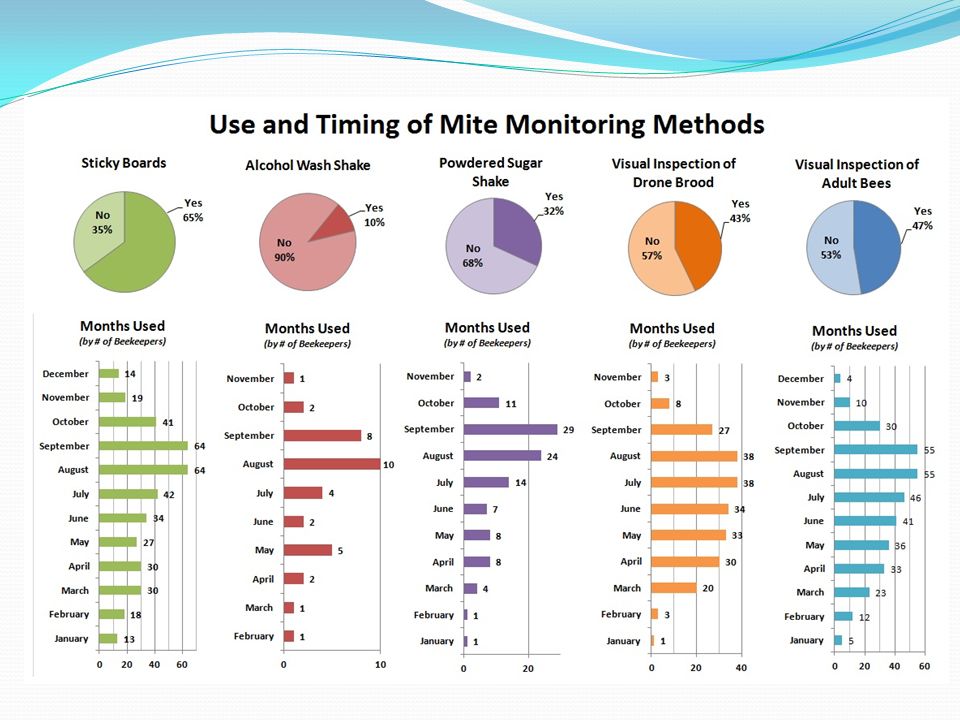
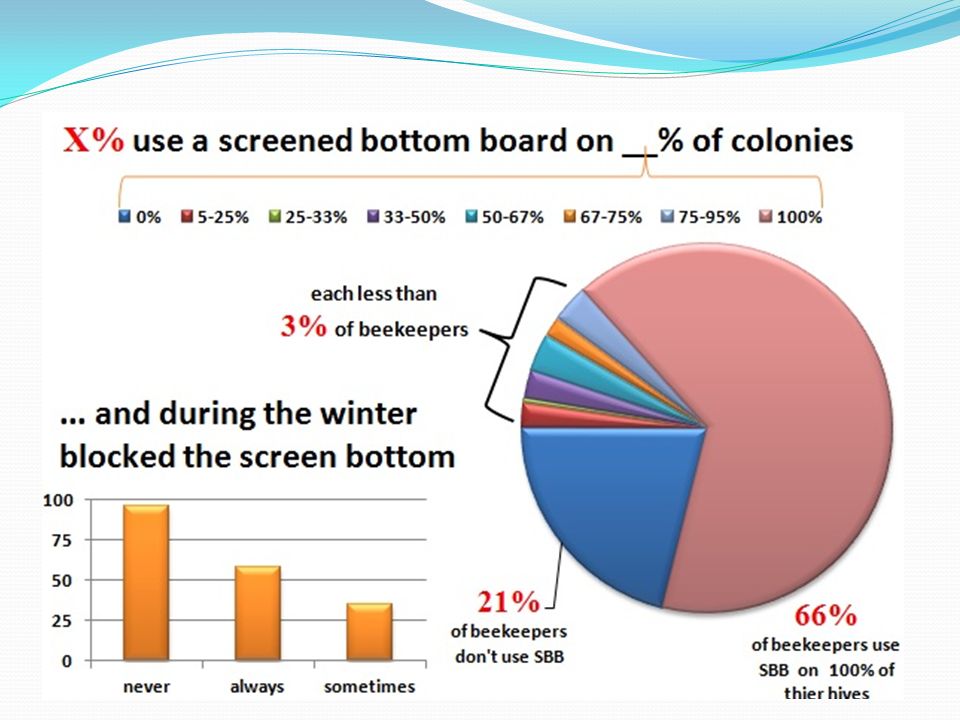
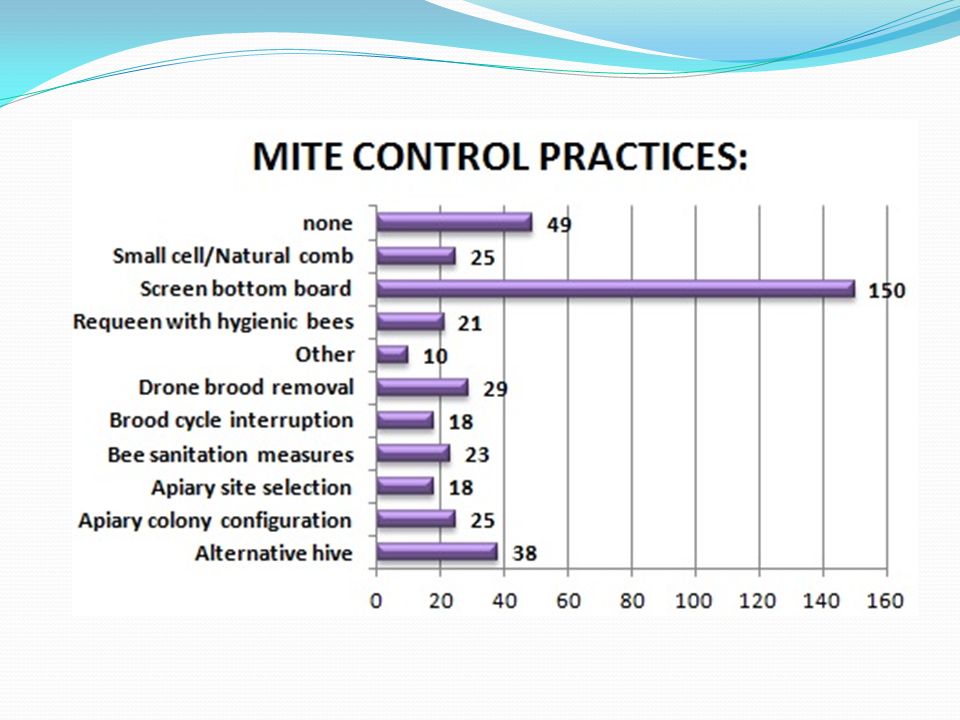
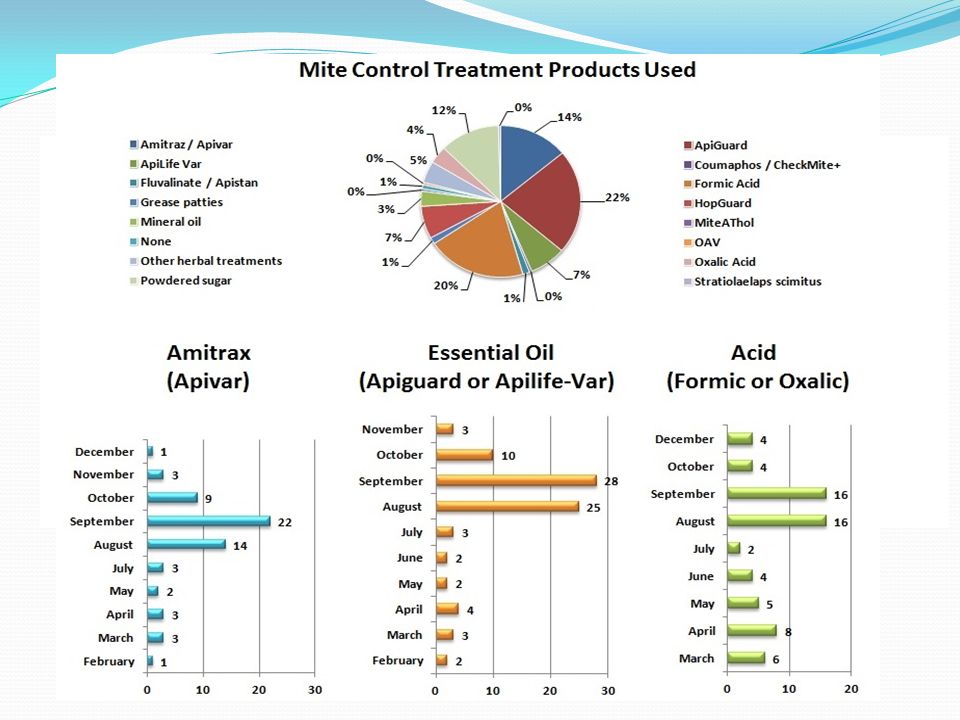
ControlControl

22
yes

25
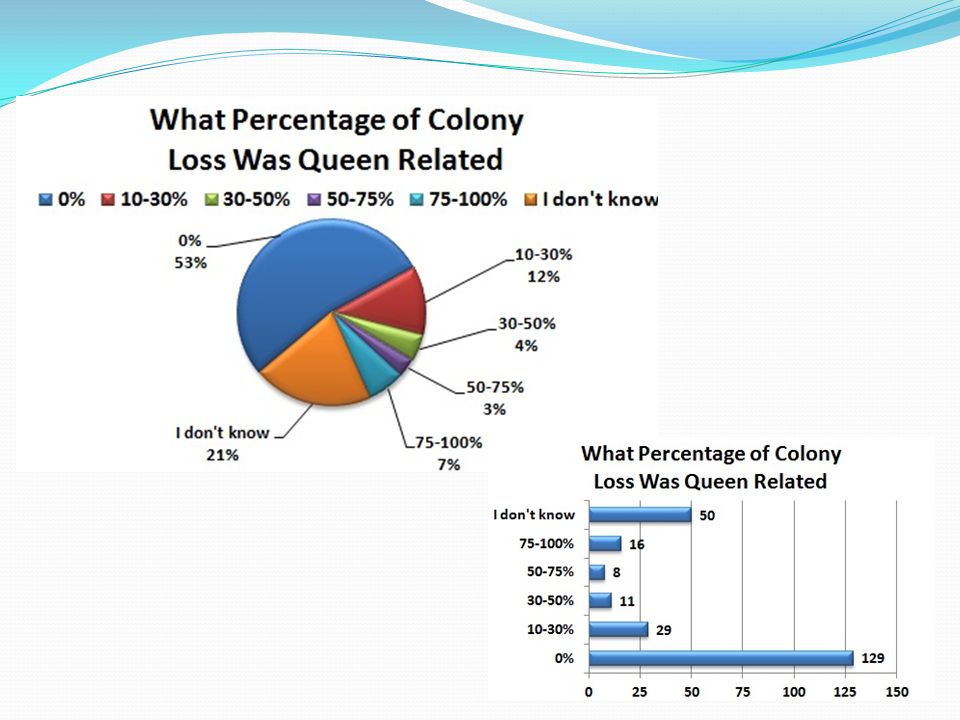
All about queens

26
Thank you http://pnwhoneybeesurvey.com/survey-results/http://pnwhoneybeesurvey.com/survey-results/2015-survey-reports/ Go to survey results (top bar)-- 2015 Survey reports
 Survey reports")
Similar presentations


 Kelly McGrory – Vice President Dan Borkoski.>")


 Avg. Weekly Hours Spent with Television.>")