Download presentation
Presentation is loading. Please wait.

2
Weather Briefings Wisconsin Balloon Group March 11, 2006 Brad Temeyer Brad.Temeyer@noaa.gov

3
Goals of Presentation Show you various formats a forecast can be displayed Show you various formats a forecast can be displayed Show you some of the tools meteorologists or FAA flight briefers use in preparing a briefing Show you some of the tools meteorologists or FAA flight briefers use in preparing a briefing Teach you how to identify a rapidly changing atmosphere Teach you how to identify a rapidly changing atmosphere Photo courtesy of Tesa Heid

4
http://www.weather.gov

5
http://www.weather.gov/forecasts/graphical/sectors

6
Grid Forecasts Allows for more precise “point” forecasts Allows for more precise “point” forecasts Separate grids for: Separate grids for: Temp (Max, Min, Hourly) Temp (Max, Min, Hourly) Dew point Dew point Wind (direction and speed) Wind (direction and speed) Weather conditions Weather conditions Sky Cover Sky Cover Precipitation Probability Precipitation Probability QPF QPF Can be broken down into smaller time increments than “today” and “tonight” Can be broken down into smaller time increments than “today” and “tonight” http://www.weather.gov/forecasts/graphical/sectors/index.php
 Temp (Max, Min, Hourly) Dew point Dew point Wind (direction and speed) Wind (direction and speed) Weather conditions Weather conditions Sky Cover Sky Cover Precipitation Probability Precipitation Probability QPF QPF Can be broken down into smaller time increments than today and tonight Can be broken down into smaller time increments than today and tonight")
7
http://www.weather.gov
8
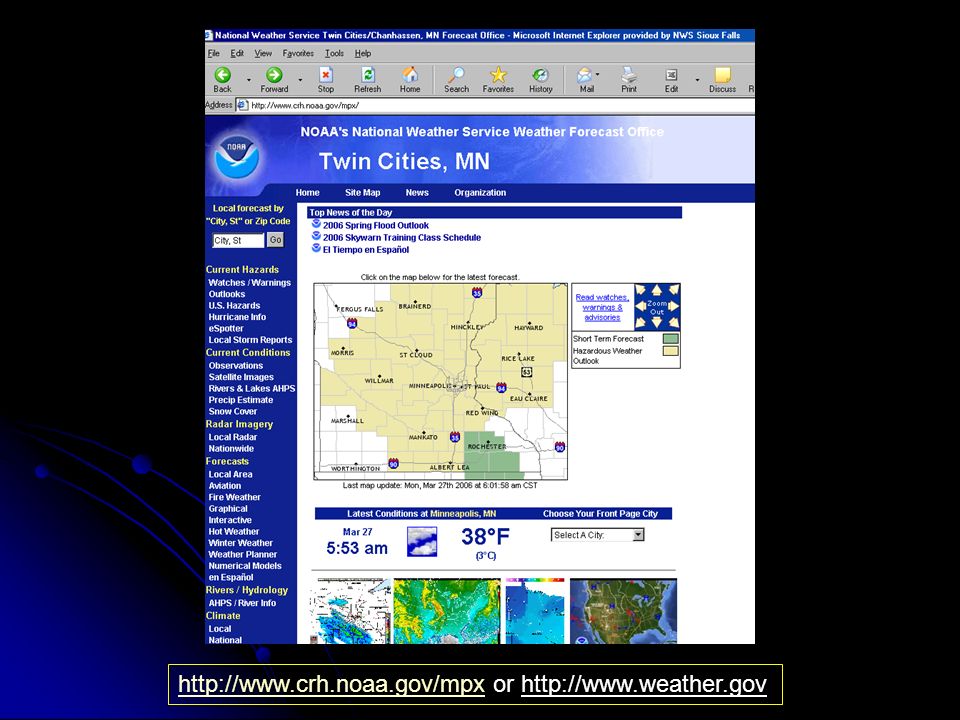
http://www.crh.noaa.gov/mpxhttp://www.crh.noaa.gov/mpx or http://www.weather.gov

10
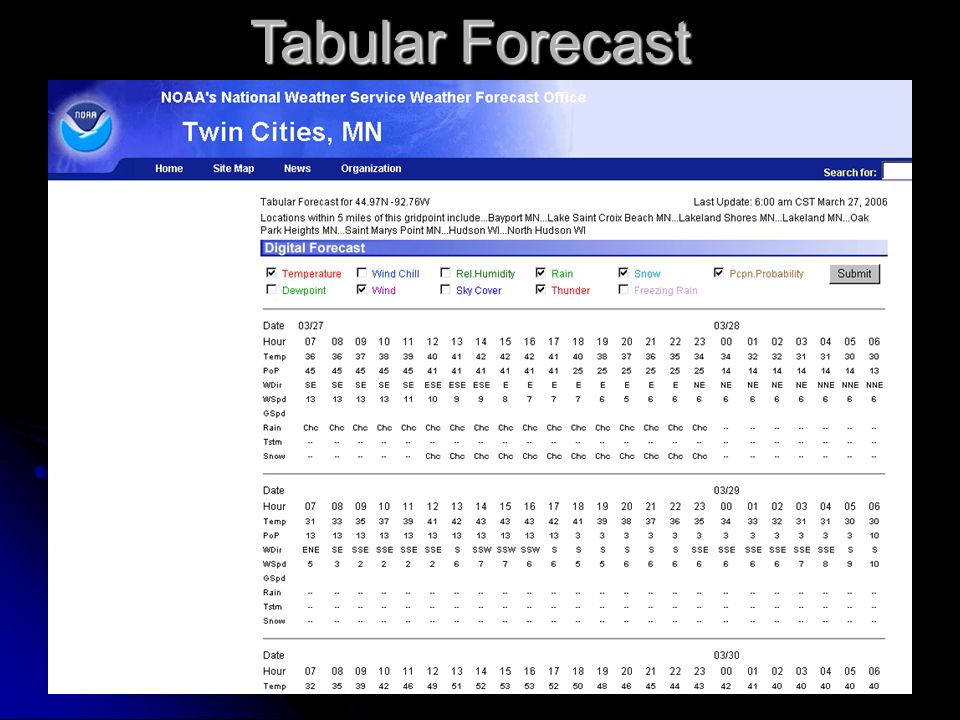
Tabular Forecast

11
http://www.crh.noaa.govhttp://www.crh.noaa.gov/fsd or http://www.weather.govhttp://www.weather.gov

12
Activity Planner

14
http://www.crh.noaa.govhttp://www.crh.noaa.gov/arx or http://www.weather.govhttp://www.weather.gov

17
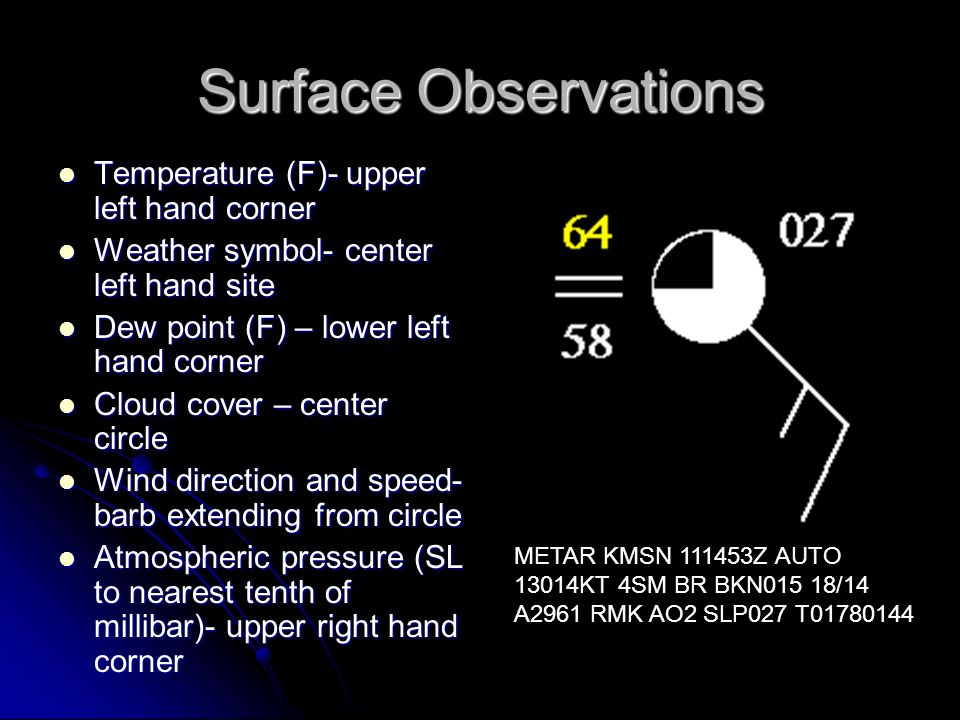
Surface Observations Temperature (F)- upper left hand corner Temperature (F)- upper left hand corner Weather symbol- center left hand site Weather symbol- center left hand site Dew point (F) – lower left hand corner Dew point (F) – lower left hand corner Cloud cover – center circle Cloud cover – center circle Wind direction and speed- barb extending from circle Wind direction and speed- barb extending from circle Atmospheric pressure (SL to nearest tenth of millibar)- upper right hand corner Atmospheric pressure (SL to nearest tenth of millibar)- upper right hand corner METAR KMSN 111453Z AUTO 13014KT 4SM BR BKN015 18/14 A2961 RMK AO2 SLP027 T01780144
- upper left hand corner Temperature (F)- upper left hand corner Weather symbol- center left hand site Weather symbol- center left hand site Dew point (F) – lower left hand corner Dew point (F) – lower left hand corner Cloud cover – center circle Cloud cover – center circle Wind direction and speed- barb extending from circle Wind direction and speed- barb extending from circle Atmospheric pressure (SL to nearest tenth of millibar)- upper right hand corner Atmospheric pressure (SL to nearest tenth of millibar)- upper right hand corner METAR KMSN Z AUTO 13014KT 4SM BR BKN015 18/14 A2961 RMK AO2 SLP027 T")
18
Observations L H http://www.rap.ucar.edu/weather/surface

19
Satellites and Radar

20
Satellites-Visible Imagery Visible-measures reflected solar energy Visible-measures reflected solar energy Works just like a camera-worthless at night Works just like a camera-worthless at night Brightest clouds indicate high concentrations of particles (e.g. ice and water vapor) Brightest clouds indicate high concentrations of particles (e.g. ice and water vapor)
 Brightest clouds indicate high concentrations of particles (e.g. ice and water vapor).")
21
Satellite-Infrared Imagery Infrared-measure cloud top temperature Infrared-measure cloud top temperature Enhances coldest temperatures Enhances coldest temperatures Only measure highest clouds in a layer Only measure highest clouds in a layer

22
Satellite-Water Vapor Water Vapor-displays amount of water vapor in atmosphere Water Vapor-displays amount of water vapor in atmosphere Aid in identifying upper level disturbances in atmosphere Aid in identifying upper level disturbances in atmosphere

23
VAD Wind Profiler

24
Wind Profilers

25
Atmospheric Soundings http://www.rap.ucar.edu/weather/upper

26
ACARS

27
BUFKIT http://www.erh.noaa.gov/buf/bufkit/bufkit.html

28
Model Plots http://www.rap.ucar.edu/weather/models

29
TAFs TAF- Terminal aerodrome forecast TAF- Terminal aerodrome forecast Issued for a five mile radius area surrounding the airport Issued for a five mile radius area surrounding the airport Surface wind (direction, speed, gusts) Surface wind (direction, speed, gusts) Visibility Visibility Weather (if needed) Weather (if needed) Obstruction to visibility (if needed) Obstruction to visibility (if needed) Sky cover, cloud heights Sky cover, cloud heights Non-convective low level wind shear Non-convective low level wind shear Can give you a ballpark idea of what to expect Can give you a ballpark idea of what to expect
 Surface wind (direction, speed, gusts) Visibility Visibility Weather (if needed) Weather (if needed) Obstruction to visibility (if needed) Obstruction to visibility (if needed) Sky cover, cloud heights Sky cover, cloud heights Non-convective low level wind shear Non-convective low level wind shear Can give you a ballpark idea of what to expect Can give you a ballpark idea of what to expect")
30
Cloud Clues

31
Cirrus 20000 ft+ agl 20000 ft+ agl Cause halos around sun or moon Cause halos around sun or moon Can signify approach of a disturbance Can signify approach of a disturbance Appears bright on infrared satellite, dull on visible Appears bright on infrared satellite, dull on visible

32
Altocumulus ~15,000 ft agl ~15,000 ft agl Indicate unstable atmosphere aloft Indicate unstable atmosphere aloft Can be a precursor to thunderstorm development when viewed early in the day Can be a precursor to thunderstorm development when viewed early in the day

33
Stratocumulus Develop 5,000 to 8,000 ft agl Develop 5,000 to 8,000 ft agl Little vertical development Little vertical development Form typically at the top of mixed layer near surface Form typically at the top of mixed layer near surface No significant weather expected unless become widespread and dense No significant weather expected unless become widespread and dense

34
Towering Cumulus Cloud bases typically occur around 5,000- 8,000 ft agl Cloud bases typically occur around 5,000- 8,000 ft agl Signify a relatively deep unstable layer developing updraft- thunderstorm potential Signify a relatively deep unstable layer developing updraft- thunderstorm potential If cloud collapses, could produce outflow If cloud collapses, could produce outflow

35
Cumulonimbus Thunderstorm Clouds Thunderstorm Clouds All severe weather types are possible All severe weather types are possible Good idea to keep feet on the ground Good idea to keep feet on the ground

36
Downdrafts Rain falls into dry layer near surface and evaporates Rain falls into dry layer near surface and evaporates Evaporated rain, i.e. Virga can enhance downdrafts Evaporated rain, i.e. Virga can enhance downdrafts Outflow boundaries Outflow boundaries Outflow from thunderstorms can travel 50+ miles away from a thunderstorm, causing sudden wind shear Outflow from thunderstorms can travel 50+ miles away from a thunderstorm, causing sudden wind shear

37
Mammatus Pouch like clouds Pouch like clouds Indicate severe turbulence and wind shear Indicate severe turbulence and wind shear

38
Thanks for inviting me! Questions?

Similar presentations