Download presentation
Presentation is loading. Please wait.

1
TA: Courtney Obergfell

2
TA : Courtney Obergfell Discussion: Wednesdays 12:05-12:55 PM, Room 823 AO & SS Office: AO & SS Room 1311 Email: obergfell@wisc.edu Office Hours: Mondays 11:00 AM-12:15 PM, Tuesdays 2:40-3:40 PM, or by appointment Discussion Website: http://www.aos.wisc.edu/~aos101co

3
On Front Name Email Year Intended Major On Back Why you signed up for a discussion section Topics you’d like covered

4
Hand in HW Short quiz Weather/Map Discussion Review of last week – questions? New lecture topic

5
Atmospheric Science: the comprehensive study of the physics, chemistry, and dynamics of the earth's atmosphere, from the earth's surface to several hundred kilometers. Oceanography: The scientific study of oceans, the life that inhabits them, and their physical characteristics, including the depth and extent of ocean waters, their movement and chemical makeup, and the topography and composition of the ocean floors.

6
Government National Weather Service: issues forecasts, warnings, fire weather, etc. Military Research: develops forecast models, research hurricanes, tornadoes, climate, develop satellites, etc. Private Industry commodity trading (agriculture, oil), energy companies (oil, wind farms), insurance/risk management, forecasting firms (transportation, construction, radio stations, etc.), air quality Academia Television
, energy companies (oil, wind farms), insurance/risk management, forecasting firms (transportation, construction, radio stations, etc.), air quality Academia Television.")
7
Daily concerns – What to wear, flight delays, etc Agriculture and Food concerns Safety Insurance and property damage Future

8
Observations allow meteorologists to assess the current state of the atmosphere Usually taken at the same time using the same standardization across the country to be consistent Taken by people or automated sensors

9
Temperature Dewpoint Barometric Pressure Wind Speed and Direction Cloud Cover Present Weather Cloud Type Etc…

10
Ships Buoys Commercial Aircraft (ACARS) Satellite All of this data goes into forecast models
 Satellite All of this data goes into forecast models")
11
Both are measured with a hygrothermometer which is shielded from the effects of direct sunlight. Dewpoint Dewpoint is the temperature at which the water vapor in the atmosphere condenses into liquid water. Dewpoint is not the same as Relative Humidity. Scientists and most of the world uses the Kelvin or Celsius scale, while the U.S. still uses the Fahrenheit scale.

12
Measured with barometer Units of hectopascals (hPa), millibars (mb) or inches of mercury (in Hg) Reported values are adjusted to sea level -- otherwise pressure maps would simply reflect topography
, millibars (mb) or inches of mercury (in Hg) Reported values are adjusted to sea level -- otherwise pressure maps would simply reflect topography")
13
Anemometer measures speed Weather vane tells us wind direction Speed measured in knots: 1 knot = 1.151 mph 1 knot = 0.514 m/s Weak hurricane has winds over 65 knots (75mph)! http://www.spl.org/images/branc h/BAL_art/anemometer.jpg

14
Amount and height Cloud type is done by sight only

15
Balloons with “radiosondes” attached are released twice per day at 72 stations in the U.S. (~900 worldwide) Measures temperature, dewpoint, wind speed and direction and pressure as it rapidly rises throughout the atmosphere Atmospheric “soundings” are created from these observations. These help meteorologists understand the vertical profiles of temperature, dewpoint, etc
 Measures temperature, dewpoint, wind speed and direction and pressure as it rapidly rises throughout the atmosphere Atmospheric soundings are created from these observations. These help meteorologists understand the vertical profiles of temperature, dewpoint, etc.")
16
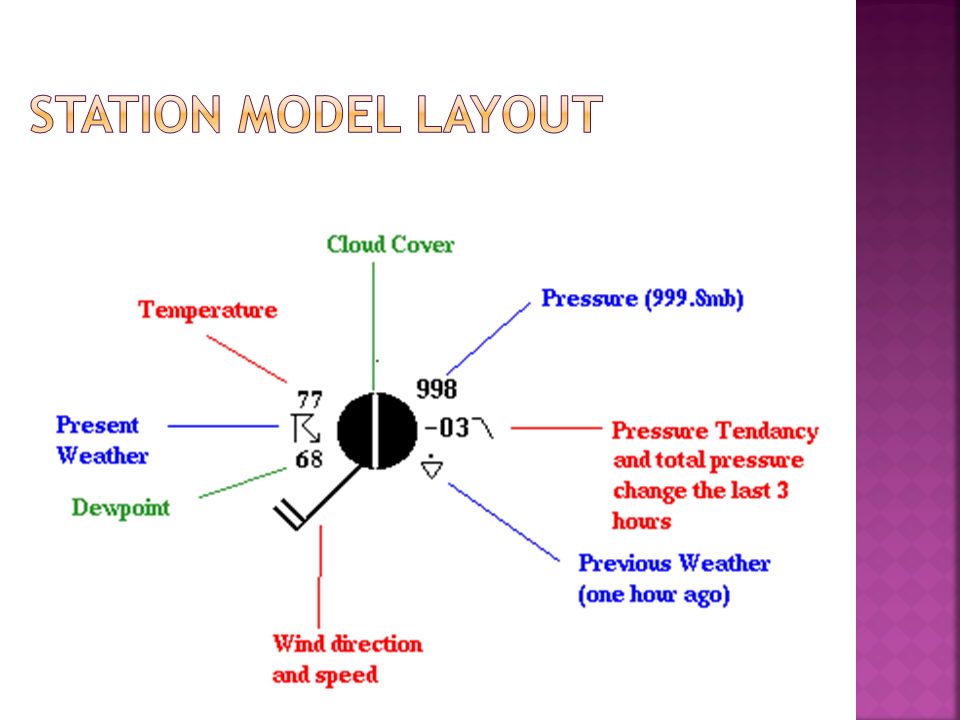
A very large amount of weather data can be retrieved from a given weather station

18
Temperature – In U.S., expressed in degrees Fahrenheit. Most other countries, in degrees Celsius. Dewpoint – Expressed in same units as temperature.

19
Wind Direction – The line drawn represents the direction from which the wind is blowing. Wind Speed – Represented as barbs on the line. Wind speed is measured in knots Short barb = 5 kts Long barb = 10 kts Triangle = 50 kts

20
Surface Pressure – Adjusted to sea level. Units are in mb. - If reported value is greater than 500, the initial 9 is missing. Place it on the left and divide by 10. I.e.: 827 = 982.7mb - If reported value is less than 500, the initial 10 is missing. Place it on the left and divide by 10. I.e.: 027 = 1002.7mb. Pressure Tendency – Change in pressure over last three hours. Change in pressure is represented by a value and line indicating how the pressure was changing.

22
Total cloud amount represents the fraction of the sky covered

23
Visibility – How far we can see from the observing point, expressed in units of miles. Present weather conditions – Symbols are used to convey this information (rain, snow, ice, etc.).
..")
Similar presentations


>")


