Download presentation
Presentation is loading. Please wait.

1
9th International PHOENICS User Conference Moscow, September 2002 A presentation by Dr. Paddy Phelps on behalf of Flowsolve and IAC Ltd September 2002

2
Predicting air flow and heat transfer in an anechoic test chamber for industrial chillers

3
Outline of Presentation b Industrial Context b Objectives of Study b Benefits of using CFD b Description of CFD Model b Simulations performed to date b Presentation of Results b Conclusions

4
Chiller Test Chamber Ventilation study b Industrial Context b Objectives of Study b Benefits of using CFD b Description of CFD Model b Simulations performed to date b Presentation of Results b Conclusions

5
Industrial Context b IAC Ltd design and construct a range of bespoke anechoic test chambers. b Their client in this instance was York Ltd, manufacturers of air chiller units for building HVAC systems. b York wish to improve the design of their products by testing them at the limits of their performance envelope

6
Industrial Context b Test chamber design brief calls for air supply temperatures at chiller intakes to be uniform to within 1 0 C. b Chiller unit intakes are located along upper body sides and ends. b Up to 12 ducted fans on top of unit emit highly swirling air extract flow, several degrees different from ambient

7
Test Chamber Geometry - 1

8
IAC Ltd Chiller Test Chamber ventilation study b Industrial Context b Objectives of Study b Benefits of using CFD b Description of CFD Model b Simulations performed to date b Presentation of Results b Conclusions

9
Objectives of Study b Use simulation tools to predict mixing of hot swirling extract flow with ambient airflow inside test facility b Provide input to design of chamber air supply / extract arrangements, by predicting likely effect on airflow patterns b Confirm client criteria for uniformity of temperature at chiller intakes can be met

10
Test Chamber Geometry - 2

11
Test Chamber Geometry - 3

12
Simulation Tool Options b Direct Experiment not applicable - building not yet constructednot applicable - building not yet constructed use to confirm other predictive toolsuse to confirm other predictive tools b Wind-Tunnel Modelling scale-up and thermal representation difficultscale-up and thermal representation difficult problem with interpretation of resultsproblem with interpretation of results b Numerical Simulation passive (Gaussian) dispersion modelspassive (Gaussian) dispersion models Computational Fluid DynamicsComputational Fluid Dynamics
 dispersion modelspassive (Gaussian) dispersion models Computational Fluid DynamicsComputational Fluid Dynamics")
13
IAC Ltd Chiller Test Chamber ventilation study b Industrial Context b Objectives of Study b Benefits of using CFD b Description of CFD Model b Simulations performed to date b Presentation of Results b Conclusions

14
Benefits of CFD Approach b No scale-up problem b Three-dimensional, steady or transient b Interrogatable predictions b Handles effect of blockages in domainblockages in domain recirculating flowrecirculating flow multiple inlets and outletsmultiple inlets and outlets multiple interacting heat sourcesmultiple interacting heat sources

15
IAC Ltd Chiller Test Chamber ventilation study b Industrial Context b Objectives of Study b Benefits of using CFD b Description of CFD Model b Simulations performed to date b Presentation of Results b Conclusions

16
Solution Domain(s) CHAMBER MODEL b Solution domain encompasses the test chamber up to, but not including, the outlet plenum Domain 15.22m by 18.88m by 8m highDomain 15.22m by 18.88m by 8m high PLENUM MODEL b Solution domain encompasses the outlet plenum only Domain 12.2m by 17.08m by 1.3m high Domain 12.2m by 17.08m by 1.3m high
 CHAMBER MODEL b Solution domain encompasses the test chamber up to, but not including, the outlet plenum Domain 15.22m by 18.88m by 8m highDomain 15.22m by 18.88m by 8m high PLENUM MODEL b Solution domain encompasses the outlet plenum only Domain 12.2m by 17.08m by 1.3m high Domain 12.2m by 17.08m by 1.3m high")
17
CFD Model Description - 1 b Representation of the effects of blockage due to the presence of an internal obstacle (chiller unit)blockage due to the presence of an internal obstacle (chiller unit) multiple inlets and outlets for chamber airmultiple inlets and outlets for chamber air resistance and mixing in extract silencersresistance and mixing in extract silencers distributed intakes on chiller sides & endsdistributed intakes on chiller sides & ends discrete, swirling outlets on chiller topdiscrete, swirling outlets on chiller top [ Flow inside chiller not solved for ]
![CFD Model Description - 1 b Representation of the effects of blockage due to the presence of an internal obstacle (chiller unit)blockage due to the presence of an internal obstacle (chiller unit) multiple inlets and outlets for chamber airmultiple inlets and outlets for chamber air resistance and mixing in extract silencersresistance and mixing in extract silencers distributed intakes on chiller sides & endsdistributed intakes on chiller sides & ends discrete, swirling outlets on chiller topdiscrete, swirling outlets on chiller top [ Flow inside chiller not solved for ]](http://images.slideplayer.com/3/781389/slides/slide_17.jpg "CFD Model Description - 1 b Representation of the effects of blockage due to the presence of an internal obstacle (chiller unit)blockage due to the presence of an internal obstacle (chiller unit) multiple inlets and outlets for chamber airmultiple inlets and outlets for chamber air resistance and mixing in extract silencersresistance and mixing in extract silencers distributed intakes on chiller sides & endsdistributed intakes on chiller sides & ends discrete, swirling outlets on chiller topdiscrete, swirling outlets on chiller top [ Flow inside chiller not solved for ]")
18
CFD Model Description - 2 b Dependent variables solved for : pressure (total mass conservation)pressure (total mass conservation) axial, lateral and vertical velocity componentsaxial, lateral and vertical velocity components air/chiller effluent mixture temperatureair/chiller effluent mixture temperature air residence time in chamberair residence time in chamber turbulence kinetic energyturbulence kinetic energy turbulence energy dissipation rateturbulence energy dissipation rate b Independent Variables: 3 spatial co-ordinates (x,y,z) and time3 spatial co-ordinates (x,y,z) and time
pressure (total mass conservation) axial, lateral and vertical velocity componentsaxial, lateral and vertical velocity components air/chiller effluent mixture temperatureair/chiller effluent mixture temperature air residence time in chamberair residence time in chamber turbulence kinetic energyturbulence kinetic energy turbulence energy dissipation rateturbulence energy dissipation rate b Independent Variables: 3 spatial co-ordinates (x,y,z) and time3 spatial co-ordinates (x,y,z) and time")
19
CFD Model Description - 3 b Iterative guess and correct solution procedure to convergence of scheme b Typical domain size - 15x8x19 m. b Around 1500 sweeps of domain required for convergence b Typical nodalisation level - 207,000 b Convergence involves solution of around 2,500 million simultaneous linked differential equations

20
CFD Model Description - 4 b The set of partial differential equations is solved within the defined solution domain and on a prescribed numerical grid b The equations represent conservation of mass, energy and momentum b The momentum equations are the familiar Navier-Stokes Equations which govern fluid flow

21
CFD Model Description - 5 b The equations may each be written in the form D( ) /Dt + div ( U - grad ) = S{ b Terms cover transience, convection, diffusion and sources respectively b Equation is cast into finite volume form by integrating it over the volume of each cell
 /Dt + div ( U - grad ) = S{ b Terms cover transience, convection, diffusion and sources respectively b Equation is cast into finite volume form by integrating it over the volume of each cell")
22
IAC Ltd Chiller Test Chamber Ventilation Study b Industrial Context b Objectives of Study b Benefits of using CFD b Description of CFD Model b Simulations performed b Results Obtained b Conclusions

23
Supply / Extract Arrangements Studied b Chamber air supply arrangement Straight supply ductsStraight supply ducts Angling of supply end regionsAngling of supply end regions Blocking middle regionBlocking middle region b Chamber air extract arrangement Long side outlet ductsLong side outlet ducts Small additional centre outletSmall additional centre outlet Large centre outletLarge centre outlet Small vestigial side outletsSmall vestigial side outlets

24
Chamber Geometry Arrangements Studied b Effect on chiller intake temperatures of: Friction on walls & ceilingFriction on walls & ceiling Silencer pressure losses at inlet & outletSilencer pressure losses at inlet & outlet Mid-height wall lipMid-height wall lip End hood on chillerEnd hood on chiller Baffles along chiller sidesBaffles along chiller sides Lip around centre ceiling extractLip around centre ceiling extract Swirl breaker above chillerSwirl breaker above chiller

25
Chiller Operating Conditions Studied b Chamber dimensions Dimensions 2.2 x 8..7 x 2.44 m. highDimensions 2.2 x 8..7 x 2.44 m. high 12 outlet fans, swirl angle = 30 degrees12 outlet fans, swirl angle = 30 degrees b Chiller Hot Operating Condition Inlet temperature ~ 35 deg.CInlet temperature ~ 35 deg.C Heat input = 951kW or 1019 kWHeat input = 951kW or 1019 kW Air flowrate = 75 or 67 m 3 /sAir flowrate = 75 or 67 m 3 /s b Chiller Cold Operating Condition Inlet temperature ~ 7 deg.CInlet temperature ~ 7 deg.C Heat input = -363kWHeat input = -363kW

26
Chamber Operating Conditions Studied b Chamber Air supply Rate Initially 110% of chiller throughputInitially 110% of chiller throughput ( i.e. 1.1*75 = 82.5 m 3 /s] Subsequently increased to 90 m 3 /sSubsequently increased to 90 m 3 /s b Hot Operating Condition Inlet supply temperature = 35 deg.CInlet supply temperature = 35 deg.C b Cold Operating Condition Inlet supply temperature = 7 deg.CInlet supply temperature = 7 deg.C

27
Overview of Workscope 34 simulations performed in 7 stages Stage 1 - Original design concept; effect of swirl; add small central outlet; remove lateral offset; longer central outlet; add wall friction; hot & cold runsStage 1 - Original design concept; effect of swirl; add small central outlet; remove lateral offset; longer central outlet; add wall friction; hot & cold runs Stage 2 - chamber outflow partitioning sensitivity; effect of inclining and part- blocking some of supply inletsStage 2 - chamber outflow partitioning sensitivity; effect of inclining and part- blocking some of supply inlets Stage 3 - revised chiller inflow partitioning; Central outlet lip and vestigial side outletsStage 3 - revised chiller inflow partitioning; Central outlet lip and vestigial side outlets

28
Overview of Workscope 34 simulations performed in 7 stages Stage 4 - chiller swirl level; outlet silencer resistance; central outlet lip.Stage 4 - chiller swirl level; outlet silencer resistance; central outlet lip. Stage 5 - Increase chamber air rate; chiller end and side baffles; increase chiller heat rate and reduce throughput for worst case.Stage 5 - Increase chamber air rate; chiller end and side baffles; increase chiller heat rate and reduce throughput for worst case. Stage 6 - Worst case run with swirl breakerStage 6 - Worst case run with swirl breaker Stage 7 - Air loading run with chiller off.Stage 7 - Air loading run with chiller off.

29
IAC Ltd Chiller Test Chamber Ventilation Study b Industrial Context b Objectives of Study b Benefits of using CFD b Description of CFD Model b Simulations performed b Results Obtained b Conclusions

30
Original Design Concept b Configuration Two long low-resistance side outletsTwo long low-resistance side outlets No central outletNo central outlet b Supply Chamber supply rate = 82.5 m 3 /sChamber supply rate = 82.5 m 3 /s Chamber supply temp = 35 deg. CChamber supply temp = 35 deg. C b Hot Chiller Operating Condition Chiller throughtput = 75 m 3 /sChiller throughtput = 75 m 3 /s Temperature rise through chiller = 11.17 deg CTemperature rise through chiller = 11.17 deg C

31
Original Design Concept: Predictions - 1 b Max temperature difference across chiller intake ports = 7.99 o C b Min intake temperature = 35.1 o C b Max intake temperature = 43.1 o C b Mean intake temperature = 36.65 o C b Mean intake residence time = 7.46 sec b Max chamber residence time = 72.1 sec

32
Original Design Concept: Predictions - 2

33
Original Design Concept: Predictions - 3

34
Original Design Concept: Predictions - 4

35
Original Design Concept: Initial Findings b Hot, highly swirling flow from chiller outlet creates non-symmetric flow patterns in chamber, despite symmetry of inlet, outlet and chiller locations b Hot recirculating flow re-entrained into chiller end intakes, creating a hot end and a cold end b Intake temperature differences are eight times desired criterion …...

36
Stage 1 Simulations b Effect of chiller outlet swirl level reducing swirl improves matters …reducing swirl improves matters … (but this is not an option) b add small central outlet T reduced to 4.35 o C T reduced to 4.35 o C b lengthen central outlet T increases slightly to 4.85 o C T increases slightly to 4.85 o C
 b add small central outlet T reduced to 4.35 o C T reduced to 4.35 o C b lengthen central outlet T increases slightly to 4.85 o C T increases slightly to 4.85 o C")
37
Stage 1 Simulations b Chamber wall friction T reduced slightly to 4.52 o C T reduced slightly to 4.52 o C b Hot and Cold Operation T for cold operation about half that when hot T for cold operation about half that when hot Hot operating condition will thus be the worst case for achieving the chiller intake temperature uniformity criterion

38
Stage 2 Simulations Supply/Extract geometry sensitivity b Chamber outflow partitioning sensitivity Tinkering with outlet resistance does not improve matters. T in range 4.5 to 6 o CTinkering with outlet resistance does not improve matters. T in range 4.5 to 6 o C b Inclining the outer supply inlets Directing outer inlet jets towards chiller ends, to sweep away descending hot fluid from intakes, does hot have desired effect.Directing outer inlet jets towards chiller ends, to sweep away descending hot fluid from intakes, does hot have desired effect. T in range 4.5 to 5 o C T in range 4.5 to 5 o C

39
Stage 2 Simulations Supply/Extract geometry sensitivity b Blocking the lower centre supply inlets Blocking the central lower inlet increases the incoming momentum of supply jets towards chiller sides. Does hot have very dramatic effect, reducing T by about 0.1 o CBlocking the central lower inlet increases the incoming momentum of supply jets towards chiller sides. Does hot have very dramatic effect, reducing T by about 0.1 o C

40
Stage 3 Simulations Sensitivity to Chiller Inflow specification Chiller inflow partitioning (ends, sides, base) derived from : b Manufacturers Estimates For hot operation, T is about 5.3 o CFor hot operation, T is about 5.3 o C b IAC Experimental Measurements For comparable run, T is about 3.1 o CFor comparable run, T is about 3.1 o C these more reliable data used for subsequent simulationsthese more reliable data used for subsequent simulations
 derived from : b Manufacturers Estimates For hot operation, T is about 5.3 o CFor hot operation, T is about 5.3 o C b IAC Experimental Measurements For comparable run, T is about 3.1 o CFor comparable run, T is about 3.1 o C these more reliable data used for subsequent simulationsthese more reliable data used for subsequent simulations")
41
Stage 3 Simulations Extract geometry sensitivity b Central outlet lip Adding a deep lip around periphery of central roof outlet should allow capture of more of swirling flow from chiller top.Adding a deep lip around periphery of central roof outlet should allow capture of more of swirling flow from chiller top. Unfortunately, it also provides a shortcut for hot air to the ends, leading to a dramatic increase in T !Unfortunately, it also provides a shortcut for hot air to the ends, leading to a dramatic increase in T ! Moral: Not all intuitive aids work as one might expect...

42
Unexpected Outcomes...

44
Stage 3 Simulations Extract geometry sensitivity b Further enlarged central outlet with vestigial side extract ducts Long extract ducts on each side replaced by four smaller apertures at intervals; central outlet further enlarged, but no lip. T falls to about 2.7 o CLong extract ducts on each side replaced by four smaller apertures at intervals; central outlet further enlarged, but no lip. T falls to about 2.7 o C

45
Stage 4 Simulations Sensitivity to chiller outlet swirl level For a reference geometry & hot operation b effect is dramatic..... for 0% swirl, T is about 0.6 o Cfor 0% swirl, T is about 0.6 o C for 30% swirl, T is about 1.3 o Cfor 30% swirl, T is about 1.3 o C for 100% swirl, T is about 6.0 o Cfor 100% swirl, T is about 6.0 o C

46
Stage 4 Simulations Further i/o geometry sensitivity b Outlet silencer resistance Specification of high and low resistance zones in inner and outer regions of central outlet has small (~10% reduction) effect on TSpecification of high and low resistance zones in inner and outer regions of central outlet has small (~10% reduction) effect on T b Increase airflow from 82.5 m 3 to 90 m 3 Increasing ventilation rate has a greater effect, reducing T by about 25%Increasing ventilation rate has a greater effect, reducing T by about 25%
 effect on TSpecification of high and low resistance zones in inner and outer regions of central outlet has small (~10% reduction) effect on T b Increase airflow from 82.5 m 3 to 90 m 3 Increasing ventilation rate has a greater effect, reducing T by about 25%Increasing ventilation rate has a greater effect, reducing T by about 25%")
47
Stage 5 Simulations Sensitivity to internal baffles Side and end baffles added, to channel supply air to intakes at chiller ends; channel supply air to intakes at chiller ends; prevent descending hot air plume being re- entrained into end inletsprevent descending hot air plume being re- entrained into end inlets Baffles and shrouds do not perform quite as envisaged... Dead zones form in end shrouds, negating some of supply-air channelling benefit.Dead zones form in end shrouds, negating some of supply-air channelling benefit. However, T reduced by about two thirdsHowever, T reduced by about two thirds

48
Baffled and Shrouded - - Tried and rejected - -

52
Final Simulations Worst case Operating Scenario b Chamber air flow increased to 90 m 3 /s b Chiller air flow reduced to 67 m 3 /s b Chiller heat input increased to 1051 kW

53
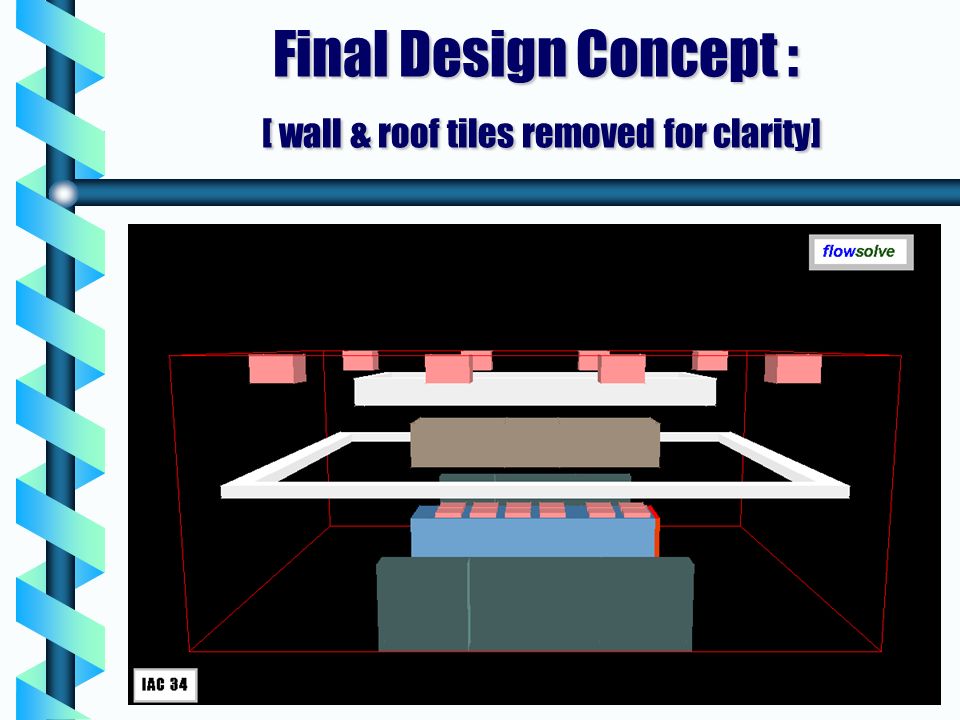
Final Design Concept Geometry : No baffles or end hoodsNo baffles or end hoods Normally-directed air supplyNormally-directed air supply Side-wall ridge at mid-heightSide-wall ridge at mid-height Enlarged central extract with four small extracts along each sideEnlarged central extract with four small extracts along each side Shallow centre outlet lipShallow centre outlet lip Swirl Breaker fitted between chiller top and air extract ductSwirl Breaker fitted between chiller top and air extract duct

54
Final Design Concept : [ wall & roof tiles removed for clarity]
![Final Design Concept : [ wall & roof tiles removed for clarity]](http://images.slideplayer.com/3/781389/slides/slide_54.jpg "Final Design Concept : [ wall & roof tiles removed for clarity]")
57
Final Design Concept: Predictions - 1 b Max temperature difference across chiller intake ports = 0.96 o C b Min intake temperature = 35.01 o C b Max intake temperature = 35.97 o C b Mean intake temperature = 35.13 o C b Mean intake residence time = 4.27 sec b Max chamber residence time = 128 sec

58
Final Design Concept : Predictions - 2

59
Final Design Concept : Predictions - 3

60
Final Design Concept : Predictions - 4

61
Final Design Concept : Predictions - 5

62
Final Design Concept : Air flow predictions - axial plane

63
Final Design Concept : Air flow predictions - transverse plane

66
Final Design Concept : Air flow predictions - plan view

69
Final Design Concept : Residence time Considerations b Flow-averaged residence time of air in chamber is ~19 secs. Maximum predicted is 128 seconds. b Region located below mid-wall lip, at non- control panel end and side, is the slowest clearing dead zone. b Times contoured depict time following injection into domain

70
Final Design Concept : Residence time predictions

72
Final Design Concept : Residence time predictions at axial section through centre of chiller

73
Final Design Concept : Residence time predictions at transverse section through centre of chiller

74
Final Design Concept : Residence time predictions at transverse section through far end of chiller

75
Conclusions - 1 b Attainment of 1-degree or less variance in chiller intake temperatures is thwarted by the re-entrainment of the hot swirling plume issuing from the top. b Attempts to modify air flow patterns to rectify matters by tinkering with inlets, outlets, baffles etc. only met with partial success

76
Conclusions - 2 b Breakthrough came in controlling the influence of the highly swirling chiller - outlet flow, by use of a waffle-iron type of swirl-breaker device. b This was more effective than using measures to try to divert the flow further downstream.

77
Conclusions - 3 b Final design concept can meet the clients design criterion for acceptable variance in chiller intake temperatures. b Some fine-tuning may be required upon final installation

78
Closure Final Concept Initial Concept

79
P.S....... And so they went ahead and built the test chamber.....

80
The fanfare of trumpets

81
P.S....... But the bean counters said lets try to do without the swirl breaker lets try to do without the swirl breaker and verily the measured results fell short of the clients design specification. of the clients design specification. and so they put the swirl breaker back, and came back for more modelling, and came back for more modelling, to fine tune the design to fine tune the design

82
The Test Chamber as built The Test Chamber as built

83
Changes to model for as built test cell geometry b Smaller 10-fan unit, located symmetrically and reversed b Chiller intakes: uniform flux along sides and bases of units, but not at ends b Anti-clockwise swirl at chiller fan outlets b Prescribed, non-uniform fan outlet temperatures; intake values computed b Non-uniform fan swirl profile

84
Changes to model for as built test cell geometry b Domain extended upwards to include representation of outlet plenum b Non-uniform inlet flow distribution, based on measured values b Triangular-section wall protrusions b Fine mesh swirl breaker

85
Model for as built test cell geometry

86
Changes to model for as built test cell geometry b Chamber air flow up to 92.5 m 3 /s b Chiller throughflow up to 72m 3 /s b Chiller heat input down to 869 kW b Grid nodalisation up to 276,000 cells

87
As Built Test Cell Geometry : Fine tuning simulations As Built Test Cell Geometry : Fine tuning simulations Effect on intake temperature profile of b Uniform and non-uniform T fan distributions b Swirl breaker fitment b Fan swirl angle

88
Changes to model for as built test cell geometry Run Specification b Non-uniform fan outlet temperatures, based on experimental measurements. Maximum temperature = 54.4 o C Minimum temperature = 42.6 o C b Fan swirl angle 45 o b As built swirl breaker design

89
As built test cell geometry: Flow pattern at chiller intakes As built test cell geometry: Flow pattern at chiller intakes

90
As built test cell geometry: Temperatures at intake level As built test cell geometry: Temperatures at intake level

91
As built test cell geometry: Flow patterns at fan outlet level As built test cell geometry: Flow patterns at fan outlet level

92
As built test cell geometry: Temperatures at fan outlet level As built test cell geometry: Temperatures at fan outlet level

93
As built test cell: Flow patterns below swirl-breaker level As built test cell: Flow patterns below swirl-breaker level

94
As built cell: Temperatures below swirl-breaker level As built cell: Temperatures below swirl-breaker level

95
As built test cell: Flow patterns at central outlet lip level As built test cell: Flow patterns at central outlet lip level

96
As built cell: Temperatures at central outlet lip level As built cell: Temperatures at central outlet lip level

97
As built cell : Flow patterns at section through fans 3 & 4 As built cell : Flow patterns at section through fans 3 & 4

98
As built cell : Temperatures at section through fans 3 & 4 As built cell : Temperatures at section through fans 3 & 4

99
As built cell : Flow patterns at section through fans 7 & 8 As built cell : Flow patterns at section through fans 7 & 8

100
As built cell : Temperatures at section through fans 7 & 8 As built cell : Temperatures at section through fans 7 & 8

101
As built cell : Flow patterns at section through near-side fans As built cell : Flow patterns at section through near-side fans

102
As built cell : Temperatures at section through near-side fans As built cell : Temperatures at section through near-side fans

103
As built cell : Flow patterns at section through far-side fans As built cell : Flow patterns at section through far-side fans

104
As built cell : Temperatures at section through far-side fans As built cell : Temperatures at section through far-side fans

105
As built test cell : Chiller intake temperature profile As built test cell : Chiller intake temperature profile

107
Conclusions b Highly non-uniform fan discharge temperatures lead to inlet temperature variations along length of unit b Local fluctuations can exceed 1 degree, especially close to top of unit b However, mixed-mean values for each unit remain well below this criterion

108
THANK YOU FOR YOUR ATTENTION

109
Points of Contact for further information b Flowsolve Ltd Dr. Paddy Phelps Dr. David Glynn 130 Arthur Rd. Wimbledon Park SW19 8AA 0208 944 0940 cfd@flowsolve.com b IAC Ltd Mr. Geoff Howse Mr. Greg Smith IAC House Moorside Road Winchester Hants SO23 7US 01962 873000

Similar presentations


 and Douglas Wylie (GEC Energy Services) IPUC 7 - Luxembourg - May 2000.>")


 Università di Napoli “Federico II” Naples,>")


