Download presentation
Presentation is loading. Please wait.

1
Penn State Cooperative Wetlands Center Conceptual Wetland Condition Gradient Condition Gradient Highest Ecological Integrity Non-Supporting Goals Human Disturbance Gradient Minimum Maximum HGM/IBI Measurements High Low

2
Penn State Cooperative Wetlands Center

4
F9 - Maintain of Native Plant Community General form of the model is: FCI = [(V SPPCOMP * 0.66 + V REGEN * 0.33) + V EXOTIC ]/2, where; V SPPCOMP : Floristic Quality Assessment Index (FQAI) V REGEN : regeneration of native tree species V EXOTIC : percent exotic species
![F9 - Maintain of Native Plant Community General form of the model is: FCI = [(V SPPCOMP * V REGEN * 0.33) + V EXOTIC ]/2, where; V SPPCOMP : Floristic Quality Assessment Index (FQAI) V REGEN : regeneration of native tree species V EXOTIC : percent exotic species](http://images.slideplayer.com/2/770773/slides/slide_4.jpg "F9 - Maintain of Native Plant Community General form of the model is: FCI = [(V SPPCOMP * V REGEN * 0.33) + V EXOTIC ]/2, where; V SPPCOMP : Floristic Quality Assessment Index (FQAI) V REGEN : regeneration of native tree species V EXOTIC : percent exotic species")
5
Penn State Cooperative Wetlands Center

7
Forested - 22% Agriculture - 40% Urban - 38%

8
Penn State Cooperative Wetlands Center F12 - Maintenance of Landscape Scale Diversity General form of the model is (within 1-km radius): FCI = (V AQCON + V UNDEVEL + V SDI + V MPS )/4 V AQCON : degree of aquatic connectivity (100-yr floodplain, stream density, nearest NWI wetland) V UNDEVEL : average of two sub-variables: V RDDEN - density of roads in 1-km radius circle V URB - % of 1-km radius circle in urban development V SDI : natural log of the Shannon diversity index of 8 landscape categories V MPS : mean forested patch size within a 1-km radius circle
: FCI = (V AQCON + V UNDEVEL + V SDI + V MPS )/4 V AQCON : degree of aquatic connectivity (100-yr floodplain, stream density, nearest NWI wetland) V UNDEVEL : average of two sub-variables: V RDDEN - density of roads in 1-km radius circle V URB - % of 1-km radius circle in urban development V SDI : natural log of the Shannon diversity index of 8 landscape categories V MPS : mean forested patch size within a 1-km radius circle")
9
Penn State Cooperative Wetlands Center

10
Inventory ConditionRestoration Map landuse in watershed; calculate preliminary landscape measures Synoptic map of restoration potential (existing wetlands, landuse, roads & streams) Level 1 Level 2 Level 3 Utilize existing resources (NWI) Map of abundance zones with verified inventory Apply HGM functional assessment models to probability based sampling locations Map depicting abundance zones,verified inventory, and probable condition Performance criteria matrices provide restoration standards Develop and apply landscape-based approach to obtain abundance map Apply stressor checklist Map depicting overlay of wetland abundance zones, levels of potential threat, and landuse, roads & streams
 Level 1 Level 2 Level 3 Utilize existing resources (NWI) Map of abundance zones with verified inventory Apply HGM functional assessment models to probability based sampling locations Map depicting abundance zones,verified inventory, and probable condition Performance criteria matrices provide restoration standards Develop and apply landscape-based approach to obtain abundance map Apply stressor checklist Map depicting overlay of wetland abundance zones, levels of potential threat, and landuse, roads & streams")
11
Penn State Cooperative Wetlands Center

17
Comparison of Landscape and Rapid Assessment Scores

18
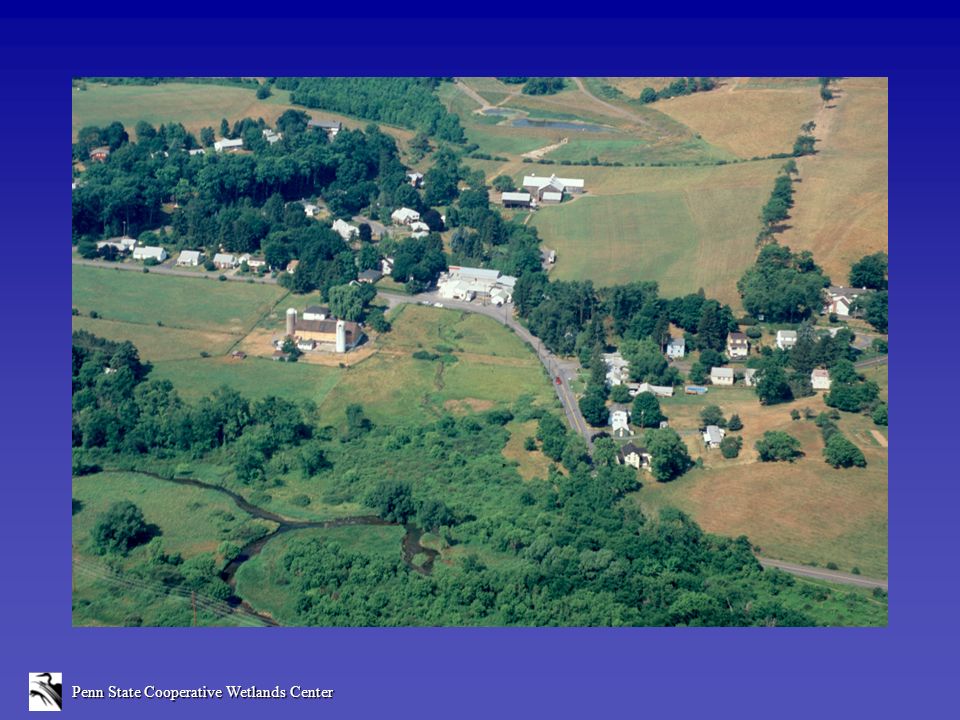
Penn State Cooperative Wetlands Center Upper Juniata Headwater Floodplains

19
Penn State Cooperative Wetlands Center

21
Agricultural Use Urbanization Mining Pollutant Trans. Eutrophication Turbidity Sedimentation Hydrologic Modif. Fragmentation Organic Matter Hydroperiod Macroinvertebrates Bird Community Amphibian Comm. Plant Community Acidification Soil Microtopography

22
Penn State Cooperative Wetlands Center

23
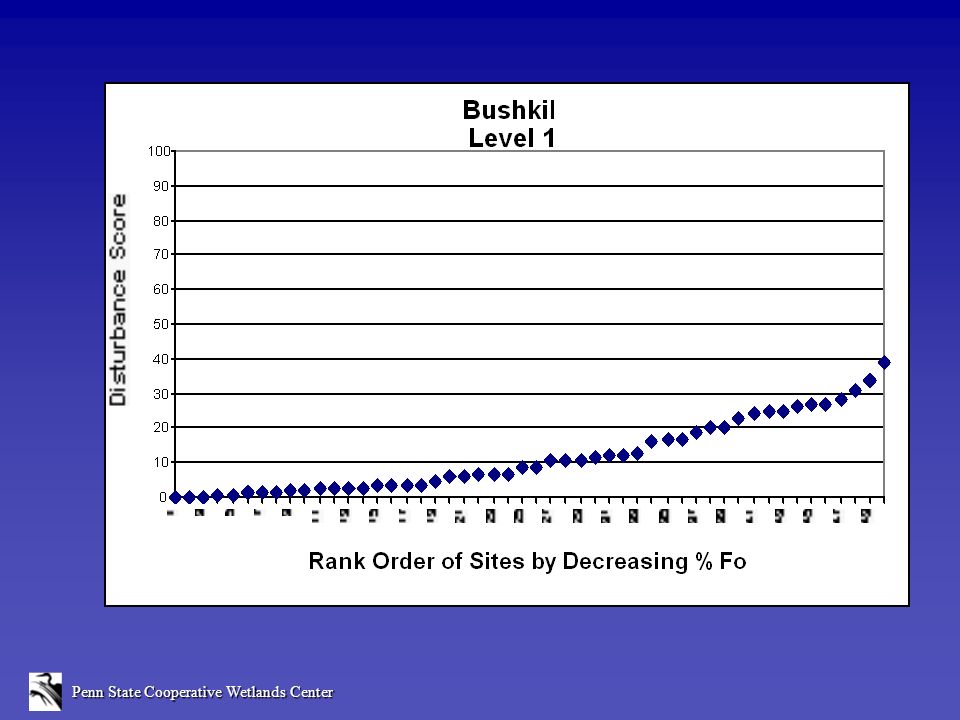
0100 Disturbance Score 50 Spring Creek Little Fishing Creek Juniata Brandywine Yellow Breeches Shavers Creek Bushkill White Deer Creek 2575 Degraded Reference Standard Level 1 Watershed Scores Based on 50 Randomly-Selected Wetlands

24
Penn State Cooperative Wetlands Center Products Under Development at the Cooperative Wetlands Center Wetland Plant IBI Bird Community Index (Landscape) Wetland Bird IBI Macroinvertebrate IBI Amphibian IBI Streamside Salamander IBI Calibrated HGM Functional Models
 Wetland Bird IBI Macroinvertebrate IBI Amphibian IBI Streamside Salamander IBI Calibrated HGM Functional Models")
25
Penn State Cooperative Wetlands Center Summary Future (2002-2012) Definition and delineation will remain unchanged Implementation of HGM and IBI for assessing wetland condition Development and implementation of WQS for wetlands Watershed reporting of wetland condition by states by 2012
 Definition and delineation will remain unchanged Implementation of HGM and IBI for assessing wetland condition Development and implementation of WQS for wetlands Watershed reporting of wetland condition by states by 2012")
Similar presentations